#AN010: De-Escalation, ECB, Oil Prices and more
Hi, I’m Forex Trader Andrea Russo and today we’re going to take a look at this week’s news. Thank you all for the great number of readers I’m receiving these days.
Don’t forget that by visiting my website, you can also connect with me on other platforms and you can also find exclusive Benefits for my readers.
🔶 Key Highlights of the Week
ECB’s Villeroy Confirms Rate-Cut Bias Amid Energy Volatility
Governor François Villeroy de Galhau signaled that the European Central Bank remains open to further rate cuts—even with recent oil-price volatility—due to a strong euro and controlled inflation
Oil Prices Surge—and Recede—on Iran Tensions and Ceasefire News
U.S. strikes on Iran triggered at 5–7% spike in crude, pushing Brent above $77/barrel, before plummeting as ceasefire sentiment returned
Dovish Shift at the Fed
Multiple Fed officials (Bowman, Waller, Goolsbee) openly support a July rate cut, shifting dollar sentiment
Emerging-Market Pressure: Indian Rupee in Focus
Rising oil costs and geopolitical instability weigh on the INR, prompting potential RBI intervention
Geopolitical De-escalation Eases Market Risk
A U.S.-Iran ceasefire triggered a sharp retreat in oil, boosted equities globally, and weakened safe-haven USD and gold
-Forex Market Reactions: What Traders Need to Know
EUR/USD:
Rate-cut window in Europe: The ECB's dovish tone softens EUR's upside, while oil volatility now has less impact.
USD weakness: Dovish Fed commentary has dented dollar strength
Key chart signals: A sustained break below 1.0670 could open further downside toward 1.0600–1.0535.
USD/JPY:
Choppy action off failed breakouts near 148.00—watch for JPY resilience risk amid risk-off repricing
AUD/USD & Other Emerging Currencies:
Oil-driven FX pressure affecting the AUD—tracked via crude sensitivity.
The Indian rupee weakness hints at broader emerging-market stress in risk-sensitive currencies
🛠️ Strategy & Outlook for Traders
Theme Implication for FX
Fed dovishness Dollar softness → supports EUR, JPY, EM currencies
ECB policy flexibility Cap on EUR gains → neutral bias until data confirms
Oil volatility Medium-term risk for AUD, CAD, NOK, RUB
Geopolitical calm Risk-on sentiment → pressure on safe-haven USD & JPY
🎯 Trade Setups:
EUR/USD: Short on fall below 1.0670—target 1.0600–1.0535; stop above 1.0760.
AUD/USD: Short biased if oil sustains above $75; aligned with broader commodity-driven themes.
USD/JPY: Watch for continuation short if risk appetite returns; else, trade reversals at 148.00 key.
EURUSD trade ideas
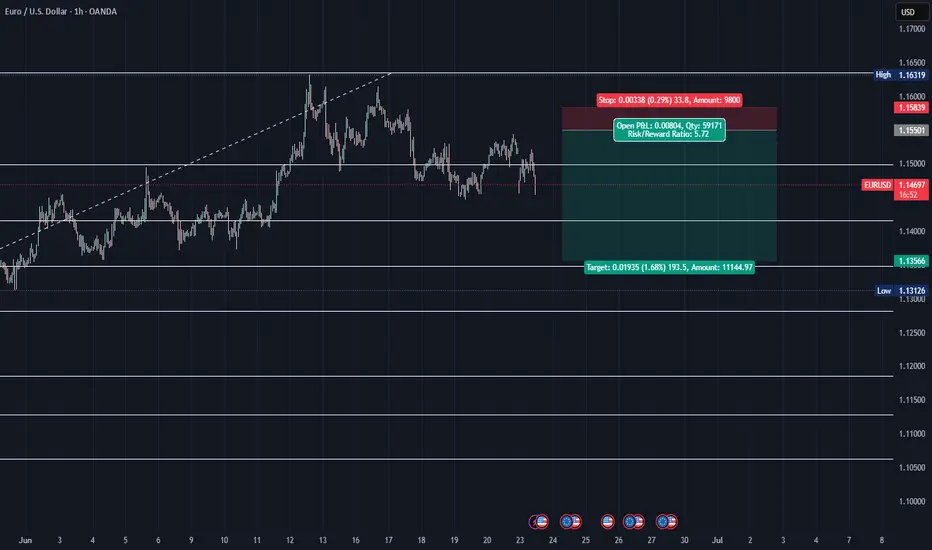
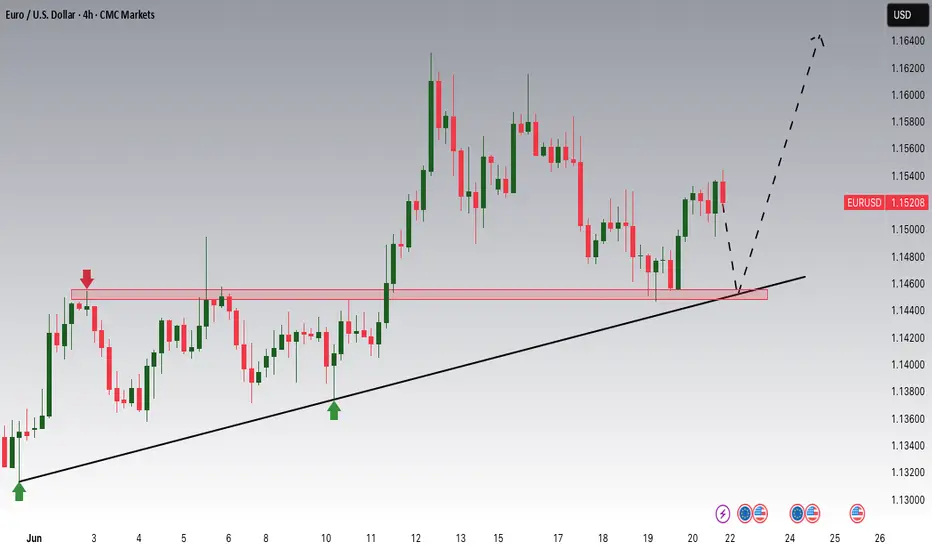
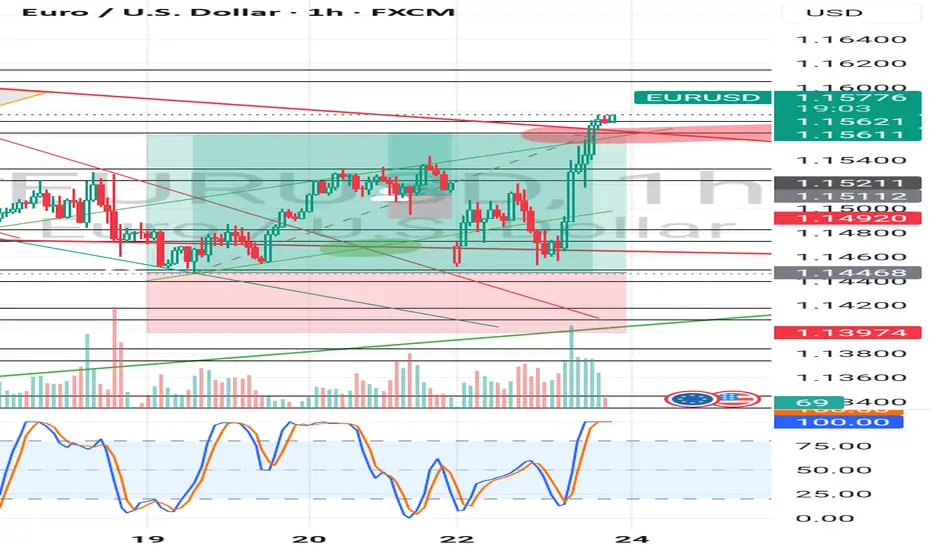
EURUSD shortIn my previous analysis in Friday, June 20, I had short pending order on this pair.
Due to US attack on Iran base's over the weekend, I closed it and put another pending short position visible here.
SL: 1.1582
Entry: 1.1550
TP: 1.1357
I expect higher volatility today, but don't expect bigger jump to the upside, so my risk:reward is bigger now.
I expect the price to clean Friday high's and go down again.
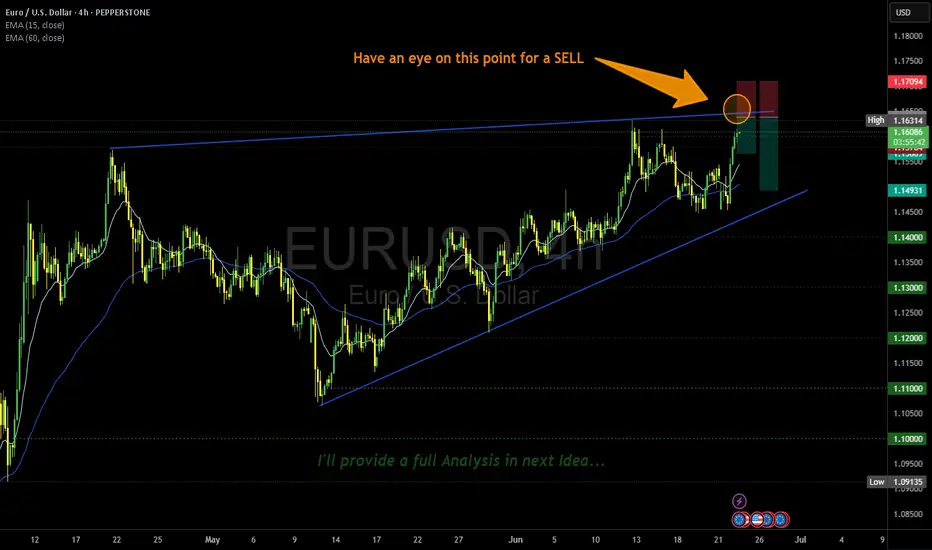
EURUSD entering the Bear Zone ...Have an eye on the Orange Circle for a possible short position...
Stay tuned for the comprehensive analysis in next IDEA...
Thank you for your attention and support...
#EURUSD #MJTRADING #FOREX
EURUSD SHORT FORECAST Q2 W26 D24 Y25EURUSD SHORT FORECAST Q2 W26 D24 Y25
Professional Risk Managers👋
Welcome back to another FRGNT chart update📈
Diving into some Forex setups using predominantly higher time frame order blocks alongside confirmation breaks of structure.
Let’s see what price action is telling us today!
💡Here are some trade confluences📝
✅Daily order block
✅15' order block
✅Intraday breaks of structure
✅4H Order block
🔑 Remember, to participate in trading comes always with a degree of risk, therefore as professional risk managers it remains vital that we stick to our risk management plan as well as our trading strategies.
📈The rest, we leave to the balance of probabilities.
💡Fail to plan. Plan to fail.
🏆It has always been that simple.
❤️Good luck with your trading journey, I shall see you at the very top.
🎯Trade consistent, FRGNT X
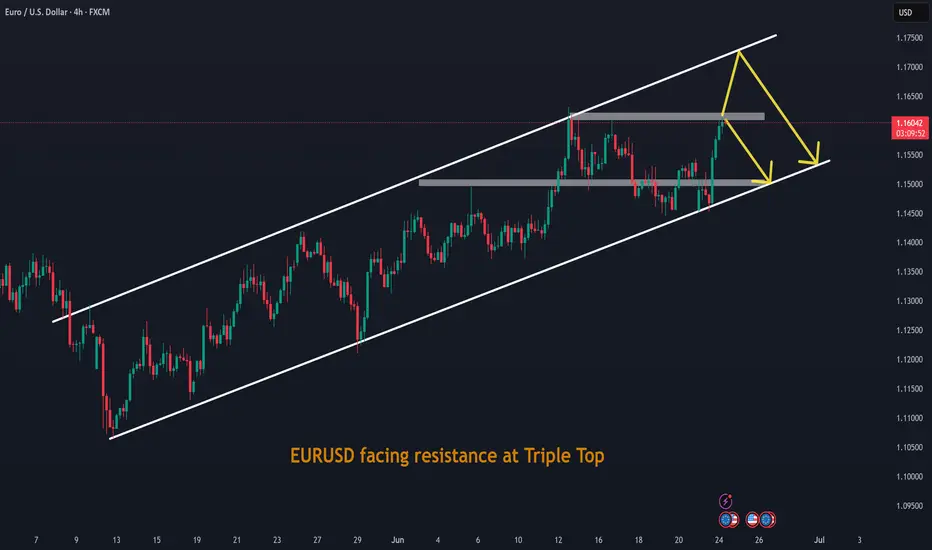
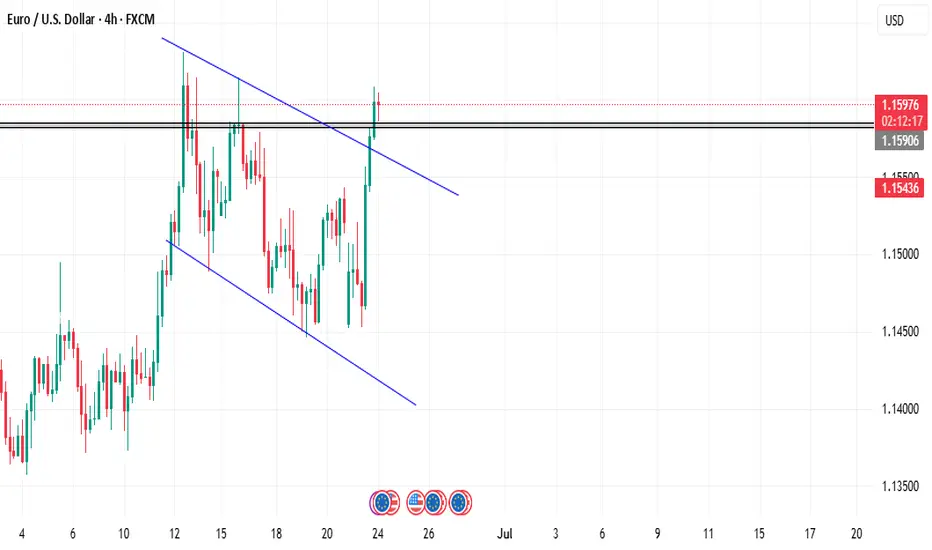
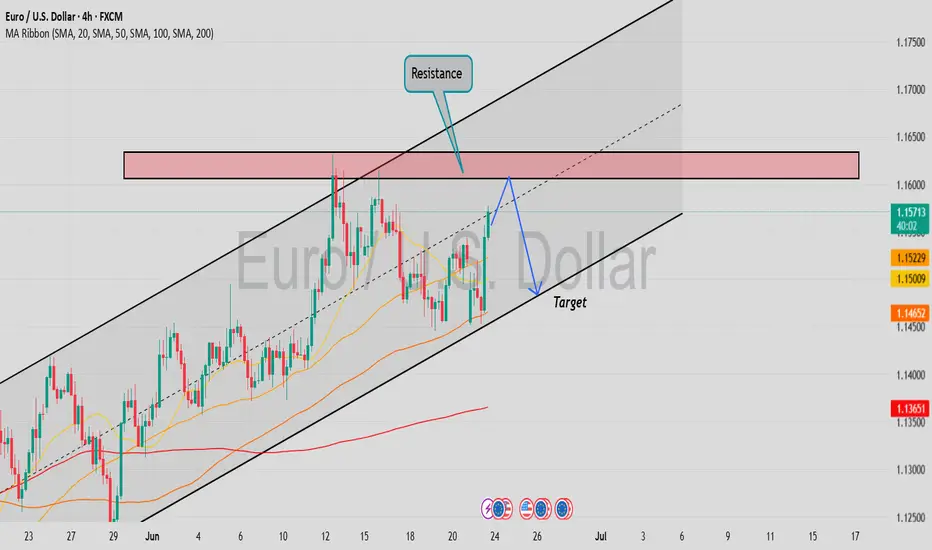
EURUSD facing resistance at Triple TopEURUSD facing resistance at Triple Top. With new geo-political situtaion yesterday night, Eith it will retace from this level or from upper channel line.
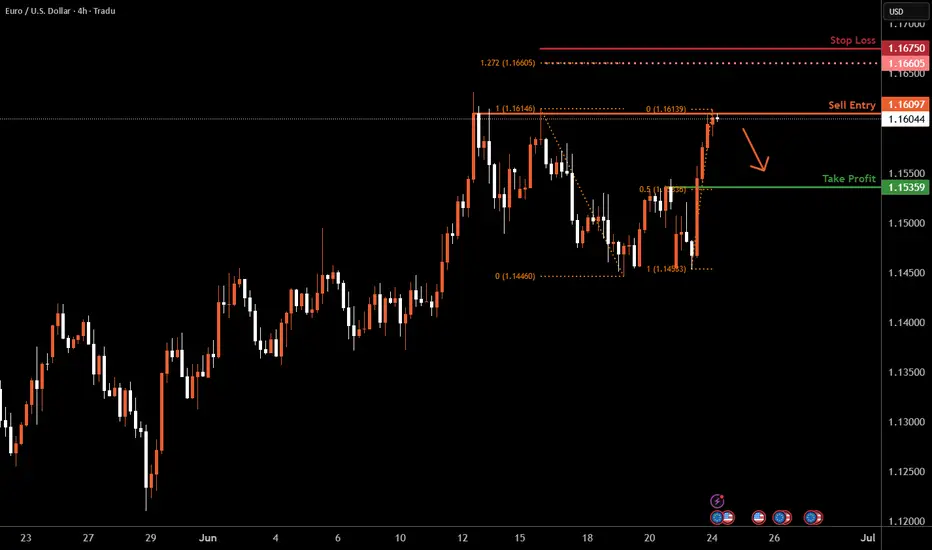
Euro H4 | Potential reversal off a multi-swing-high resistanceThe Euro (EUR/USD) is rising towards a multi-swing-high resistance and could potentially reverse off this level to drop lower.
Sell entry is at 1.1609 which is a multi-swing-high resistance.
Stop loss is at 1.1675 which is a level that sits above the 127.2% Fibonacci extension.
Take profit is at 1.1535 which is a pullback support that aligns with a 50% Fiboancci retracement.
High Risk Investment Warning
Trading Forex/CFDs on margin carries a high level of risk and may not be suitable for all investors. Leverage can work against you.
Stratos Markets Limited (tradu.com ):
CFDs are complex instruments and come with a high risk of losing money rapidly due to leverage. 63% of retail investor accounts lose money when trading CFDs with this provider. You should consider whether you understand how CFDs work and whether you can afford to take the high risk of losing your money.
Stratos Europe Ltd (tradu.com ):
CFDs are complex instruments and come with a high risk of losing money rapidly due to leverage. 63% of retail investor accounts lose money when trading CFDs with this provider. You should consider whether you understand how CFDs work and whether you can afford to take the high risk of losing your money.
Stratos Global LLC (tradu.com ):
Losses can exceed deposits.
Please be advised that the information presented on TradingView is provided to Tradu (‘Company’, ‘we’) by a third-party provider (‘TFA Global Pte Ltd’). Please be reminded that you are solely responsible for the trading decisions on your account. There is a very high degree of risk involved in trading. Any information and/or content is intended entirely for research, educational and informational purposes only and does not constitute investment or consultation advice or investment strategy. The information is not tailored to the investment needs of any specific person and therefore does not involve a consideration of any of the investment objectives, financial situation or needs of any viewer that may receive it. Kindly also note that past performance is not a reliable indicator of future results. Actual results may differ materially from those anticipated in forward-looking or past performance statements. We assume no liability as to the accuracy or completeness of any of the information and/or content provided herein and the Company cannot be held responsible for any omission, mistake nor for any loss or damage including without limitation to any loss of profit which may arise from reliance on any information supplied by TFA Global Pte Ltd.
The speaker(s) is neither an employee, agent nor representative of Tradu and is therefore acting independently. The opinions given are their own, constitute general market commentary, and do not constitute the opinion or advice of Tradu or any form of personal or investment advice. Tradu neither endorses nor guarantees offerings of third-party speakers, nor is Tradu responsible for the content, veracity or opinions of third-party speakers, presenters or participants.
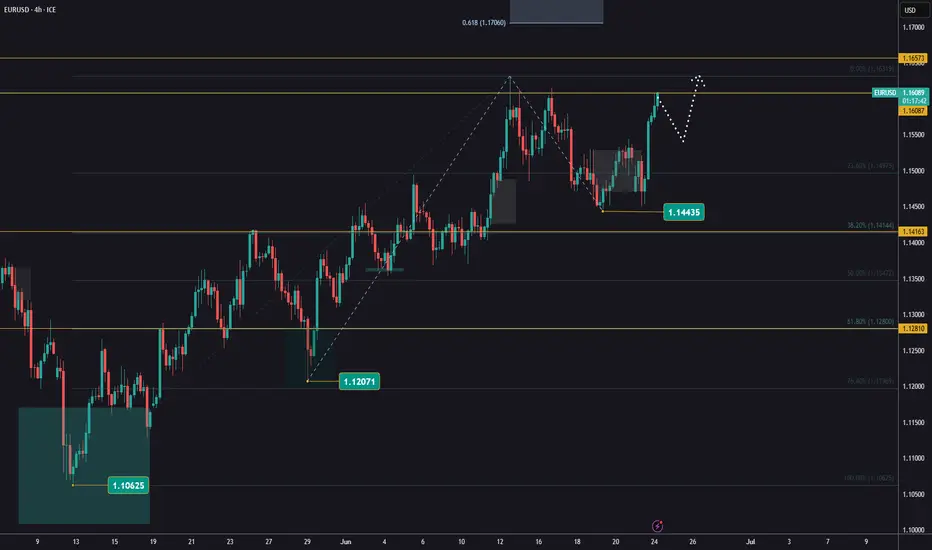
Uptrend on EURUSDEURUSD has moved higher and is now testing the previous high.
This confirms the analysis and opens up additional buying opportunities.
Reduce the risk on all active buy positions as the analysis plays out.
Additional entries can be considered after a pullback or a breakout followed by a retest.
The next target is 1,1706!
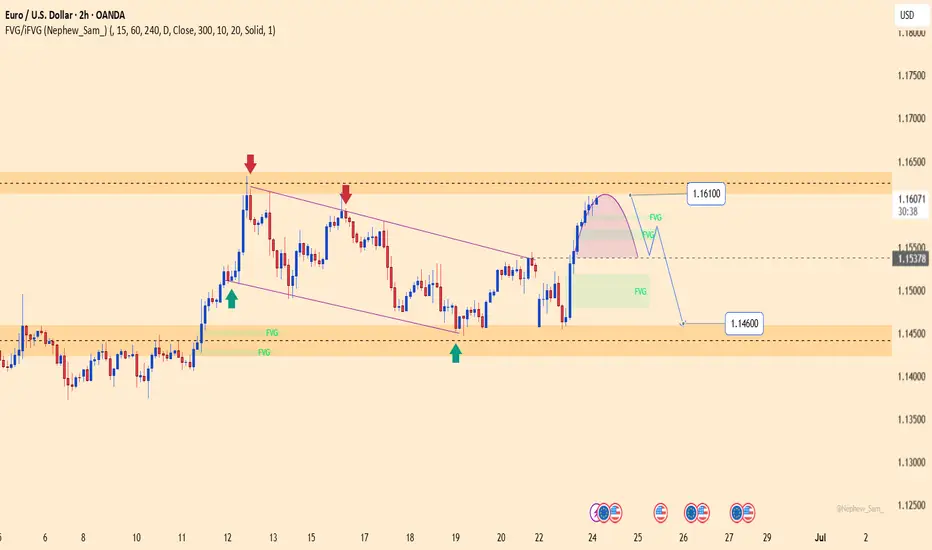
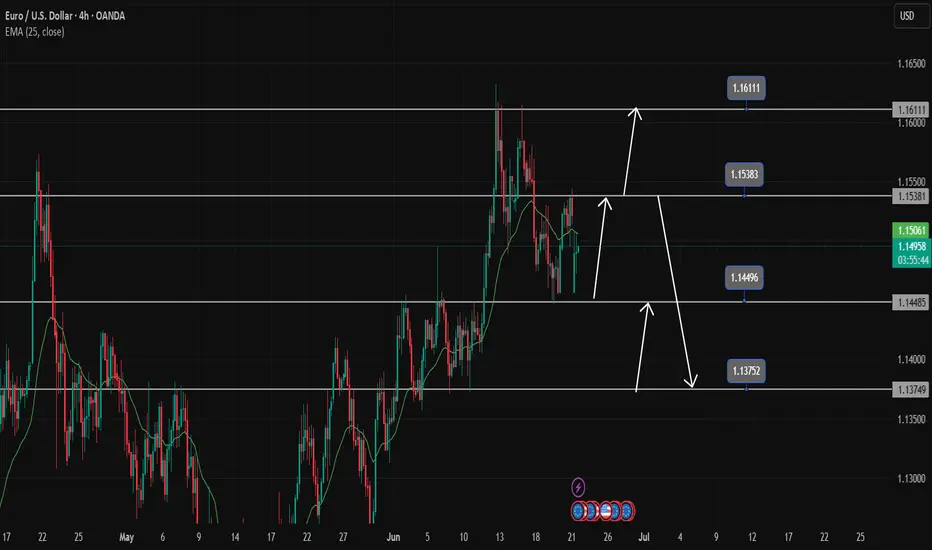
EURUSD – Rejected at 1.16100, bearish pressure re-emergingEURUSD has just completed a technical rebound toward the 1.16100 resistance zone, which has previously rejected price multiple times. The current structure suggests a mild reversal, with a potential pullback toward 1.15378. A break below this support could extend the decline toward 1.14600.
Recent upside momentum came mainly from temporary USD weakness, but the greenback remains supported by expectations that the Fed will keep interest rates elevated, while Eurozone PMI data continues to disappoint.
In summary, 1.16100 remains a key resistance level. If price shows clear rejection here, EURUSD may be poised for a deeper correction in the short term.
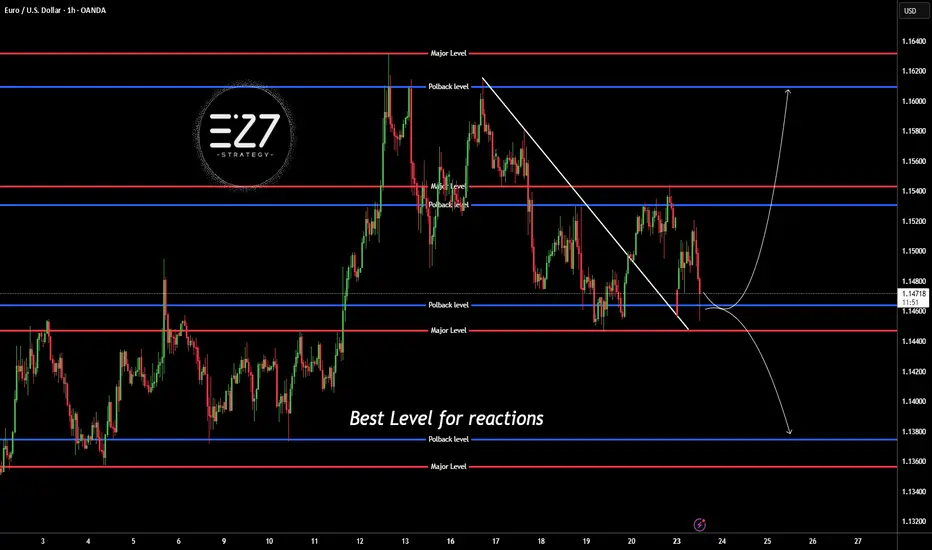
EURUSDThis levels is for reactions to support and resistace.
Price can now in Bull-trend if keep 1.145$ in sypport and breaked trendline.
⚠️Control risk management for positions.
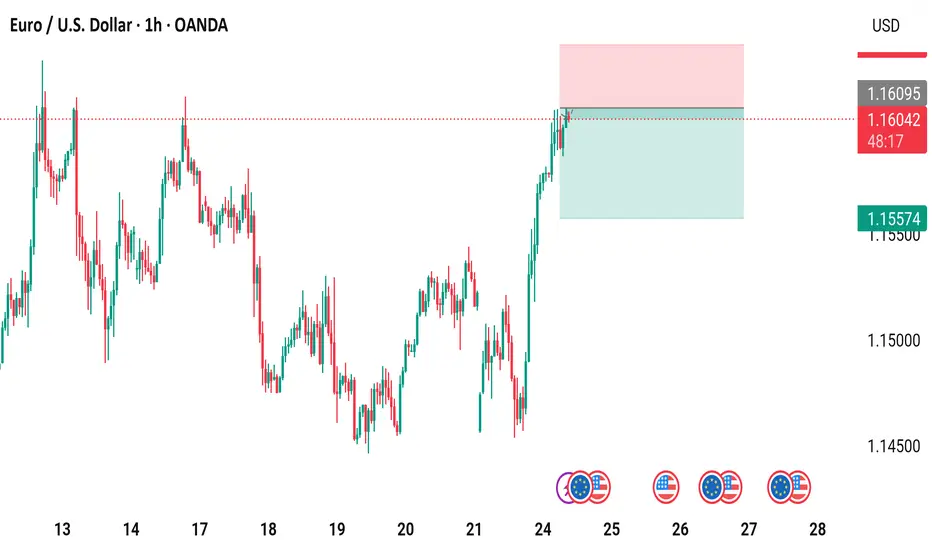
EUR/USD 1-Hour Chart - OANDA1-hour period, provided by OANDA. The current rate is 1.16038, reflecting a 0.22% increase (+0.00252). The chart shows recent price movements, with a notable upward trend and highlighted resistance (1.16095) and support (1.15574) levels. The time frame spans from 13:00 to 28:00, with candlestick patterns indicating market activity.
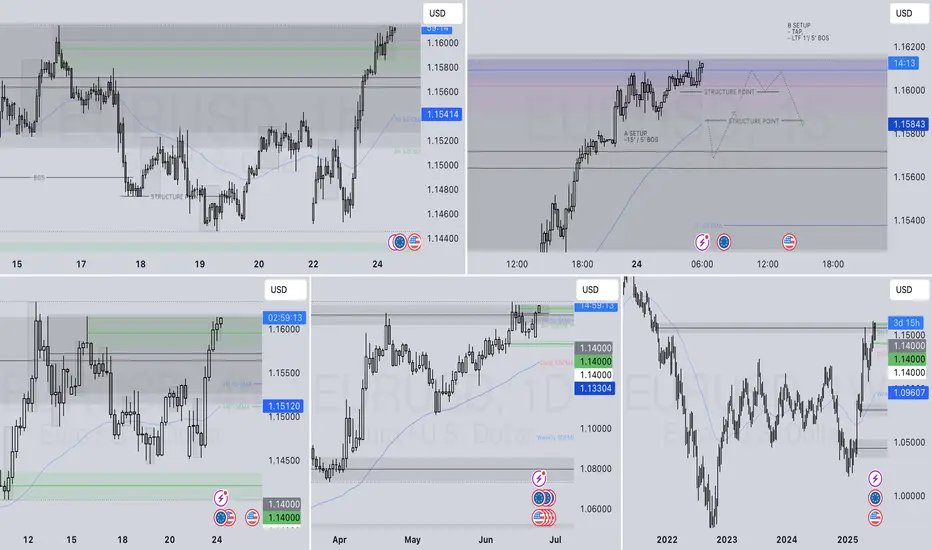
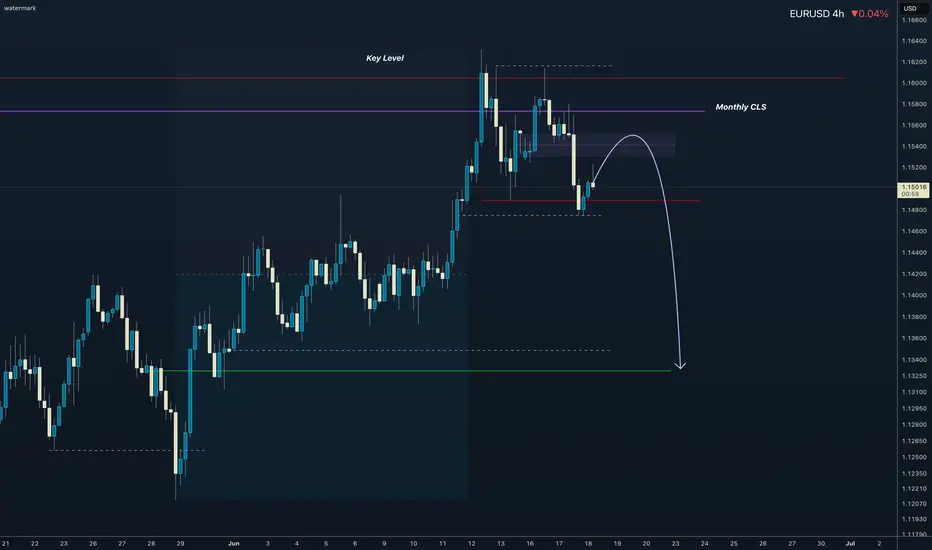
EURUSD I Monthly CLS I KL -MOB I Model 1Hey, Market Warriors, here is another outlook on this instrument
If you’ve been following me, you already know every setup you see is built around a CLS Footprint, a Key Level, Liquidity and a specific execution model.
If you haven't followed me yet, start now.
My trading system is completely mechanical — designed to remove emotions, opinions, and impulsive decisions. No messy diagonal lines. No random drawings. Just clarity, structure, and execution.
🧩 What is CLS?
CLS is real smart money — the combined power of major investment banks and central banks moving over 6.5 trillion dollars a day. Understanding their operations is key to markets.
✅ Understanding the behavior of CLS allows you to position yourself with the giants during the market manipulations — leading to buying lows and selling highs - cleaner entries, clearer exits, and consistent profits.
📍 Model 1
is right after the manipulation of the CLS candle when CIOD occurs, and we are targeting 50% of the CLS range. H4 CLS ranges supported by HTF go straight to the opposing range.
"Adapt what is useful, reject what is useless, and add what is specifically your own."
— David Perk aka Dave FX Hunter ⚔️
👍 Hit like if you find this analysis helpful, and don't hesitate to comment with your opinions, charts or any questions.
EURUSD Trading Strategy for the WeekEURUSD is reacting at the support zone of 1.14500. This is an important support zone that helps EURUSD continue to maintain its upward momentum. The uptrend in the h4 time frame is still strong and heading towards the peak of 1.161.
Below the support of 1.145 will be the 1.138 zone. When this 1.138 zone is broken, it confirms that a Downtrend is established. The possibility of breaking this zone is not high, so it is still possible to set BUY signals around these support zones. On the other hand, 1.153 is an important resistance zone in the near future where the pair will have a price reaction before finding the peak of last week.
Support: 1.13800
Resistance: 1.16000
Break out: 1.14600-1.15300
Recommended good trading strategy:
Trade when price confirms in Break out zone.
BUY 1.13800-1.13600 Stoploss 1.13300
SELL 1.16000-1.16200 Stoploss 1.16500
EURUSD Dancing to my tune like i said in my previous post ..if price breaks that resistance level ..it is going to the -61.8 fib extension ......now price is on -61.8 and we can comfirm the reversals with the spike in volume
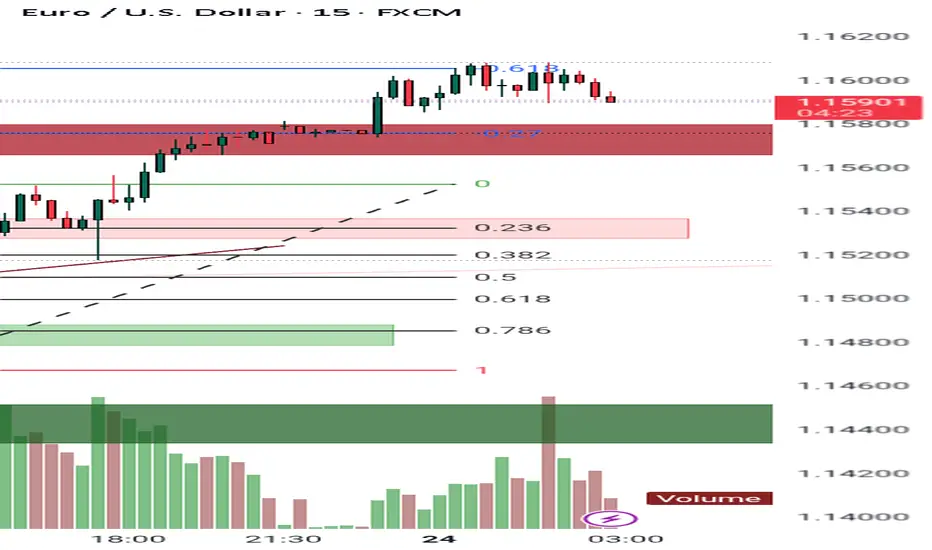
EURUSD Trade Plan: Retracement Into Key Fibo Zone POI.I’m currently watching EURUSD closely 👀. On the daily timeframe, it’s clearly broken structure and is now in a bullish trend 📈. Dropping down to the lower timeframes 🕒, price appears overextended and is now trading into a previous resistance level 🚧.
I’m anticipating a retracement into equilibrium — specifically the 50% level of the current swing, and ideally into the 50–61.8% Fibonacci retracement zone 🔁. If price pulls back into that range, I’ll be watching for a bullish market structure shift 🔄. I don’t want to see it push below the bullish imbalance 📉—I want that zone to hold as support so price can continue north 🔼.
If this plays out, my ideal entry would be around the imbalance and the 50% Fib level, with a stop loss just below the imbalance, and targets set at the current swing high and previous swing high, as detailed in the video 🎯.
⚠️ Disclaimer
This is not financial advice. Trading involves risk and you should only trade with capital you can afford to lose. Please do your own analysis or consult a licensed financial advisor.

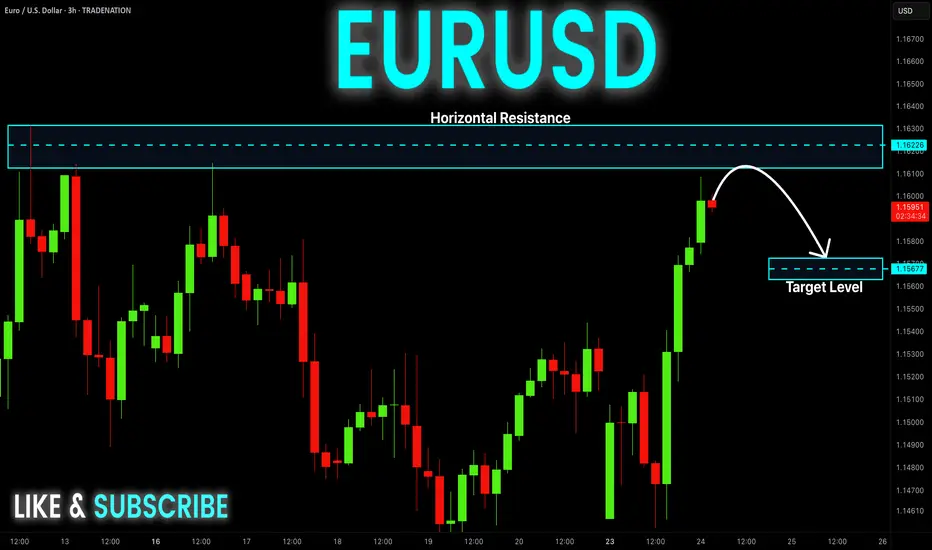
EUR-USD Risky Short! Sell!
Hello,Traders!
EUR-USD made a nice bullish
Move up and has almost reached
A horizontal resistance level
Of 1.1631 and the pair is locally
Overbought so after the retest
A local bearish correction
Is to be expected
Sell!
Comment and subscribe to help us grow!
Check out other forecasts below too!
Disclosure: I am part of Trade Nation's Influencer program and receive a monthly fee for using their TradingView charts in my analysis.
EURUSD Potential UpsidesHey Traders, in the coming week we are monitoring EURUSD for a buying opportunity around 1.14500 zone, EURUSD is trading in an uptrend and currently is in a correction phase in which it is approaching the trend at 1.14500 support and resistance area.
Trade safe, Joe.
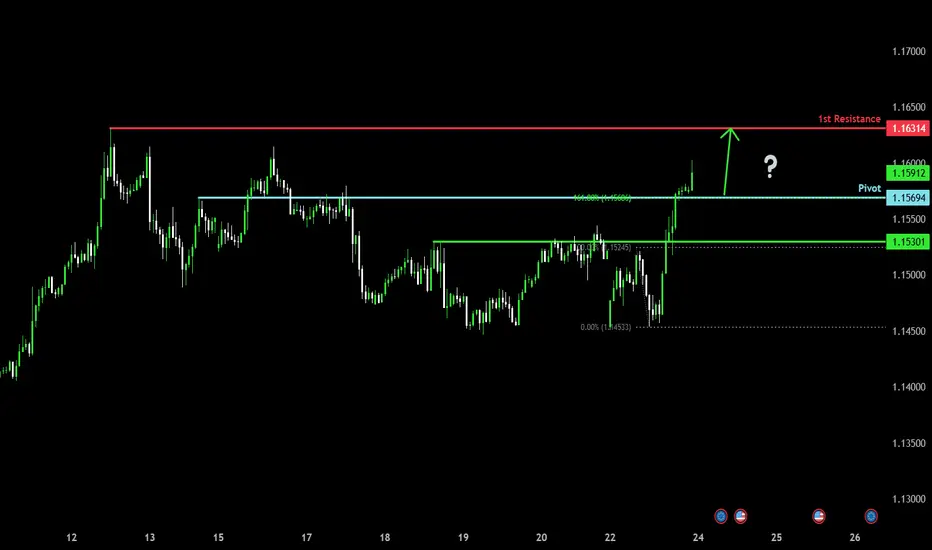
Bullish rise?The Fiber (EUR/USD) has broken out of the pivot and could rise to the 1st resistance.
Pivot: 1.1569
1st Support: 1.1530
1st Resistance: 1.1631
Risk Warning:
Trading Forex and CFDs carries a high level of risk to your capital and you should only trade with money you can afford to lose. Trading Forex and CFDs may not be suitable for all investors, so please ensure that you fully understand the risks involved and seek independent advice if necessary.
Disclaimer:
The above opinions given constitute general market commentary, and do not constitute the opinion or advice of IC Markets or any form of personal or investment advice.
Any opinions, news, research, analyses, prices, other information, or links to third-party sites contained on this website are provided on an "as-is" basis, are intended only to be informative, is not an advice nor a recommendation, nor research, or a record of our trading prices, or an offer of, or solicitation for a transaction in any financial instrument and thus should not be treated as such. The information provided does not involve any specific investment objectives, financial situation and needs of any specific person who may receive it. Please be aware, that past performance is not a reliable indicator of future performance and/or results. Past Performance or Forward-looking scenarios based upon the reasonable beliefs of the third-party provider are not a guarantee of future performance. Actual results may differ materially from those anticipated in forward-looking or past performance statements. IC Markets makes no representation or warranty and assumes no liability as to the accuracy or completeness of the information provided, nor any loss arising from any investment based on a recommendation, forecast or any information supplied by any third-party.
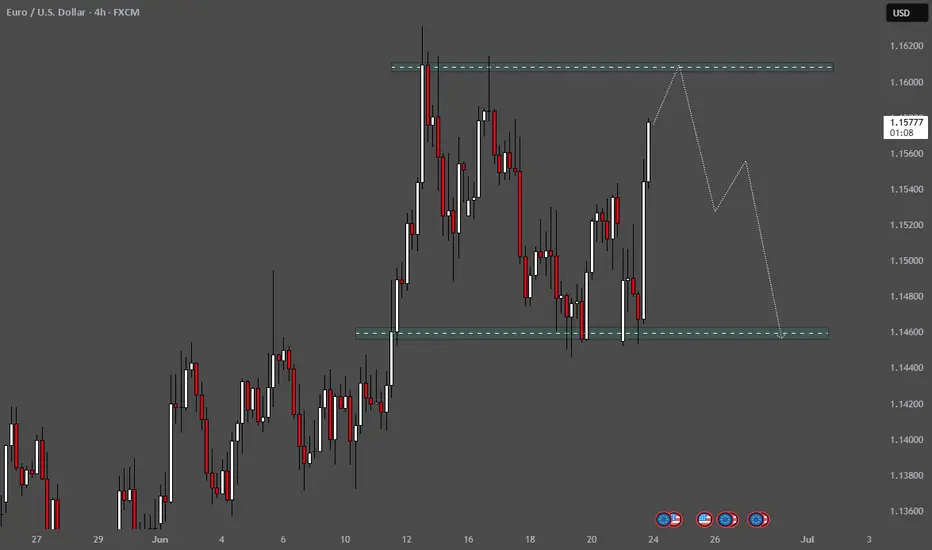
Support and Resistance Zones
Resistance zone is marked near 1.16000.
Support zone is marked around 1.14500.
Price Action:
Price is currently near 1.15776, heading towards the resistance.
There’s a strong white candle indicating bullish momentum.
Projected Price Path:
A white projection line suggests a move upwards to test the resistance zone.
Then, a grey projection line suggests a potential reversal from the resistance, falling back to test the support level.
Interpretation:
This is likely a range-trading or false breakout trap analysis:
The trader is possibly expecting a fake breakout above the resistance before a drop back down toward the support area.
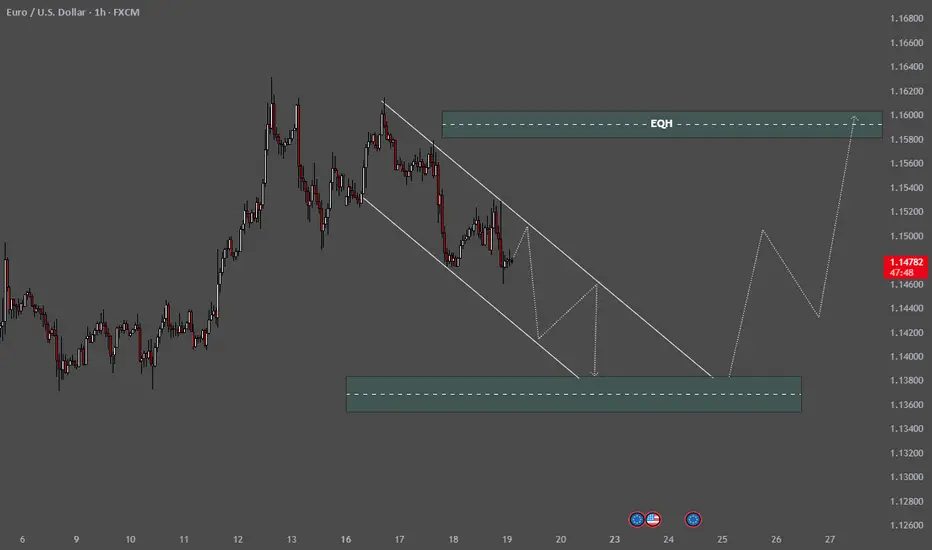
A bullish breakout from the descending channel is anticipated.Chart Breakdown
🔻 Price Action & Structure:
The market is currently trending downward within a descending channel, marked by two parallel white trendlines.
The current price is around 1.14797, with visible lower highs and lower lows, indicating a short-term bearish trend.
🔄 Projected Move:
A bullish breakout from the descending channel is anticipated.
The white projected path shows:
A dip toward the demand zone (highlighted in teal-green) around 1.13400–1.13800.
A reversal from that zone, forming higher highs and higher lows.
A move toward the upper liquidity zone, labeled EQH (Equal Highs) around 1.16000, suggesting a target for buy-side liquidity.
🧠
EQH = Equal High Liquidity
:
The EQH zone marks an area where previous highs are equal or nearly equal — a common target for price manipulation or stop-hunting.
It’s expected that the market will sweep this area for liquidity before possibly reversing or continuing.
💡 Interpretation:
The setup reflects a liquidity-based strategy using smart money concepts.
Bearish short-term → bullish medium-term outlook.
Potential trade idea: Wait for price to tap the lower demand zone, then look for entry confirmation (e.g., bullish engulfing or Ch0CH) to ride toward EQH.
EUR USD LONG RESULT Price fell inside a closing wedge pattern towards the end of the last trading week and broke out of the wedge pattern with the major resistance Trendline laying above for test.
I look the long setup from the support zone in Confluence with the support Trendline of the falling wedge, and price held and moved better than expected hitting our TP.
We'll see if price would dump again from the current resistance zone and major bearish Trendline or break above and probably create new highs, we'll see.
_THE_KLASSIC_TRADER_.
EURUSD is in a Downside DirectionHello Traders
In This Chart EURUSD HOURLY Forex Forecast By FOREX PLANET
today EURUSD analysis 👆
🟢This Chart includes_ (EURUSD market update)
🟢What is The Next Opportunity on EURUSD Market
🟢how to Enter to the Valid Entry With Assurance Profit
This CHART is For Trader's that Want to Improve Their Technical Analysis Skills and Their Trading By Understanding How To Analyze The Market Using Multiple Timeframes and Understanding The Bigger Picture on the Charts
EURUSD: TRADE WHAT YOU SEEThis current price has a history... that's why i advice people to navigate the market like an elephant .... watch howmany times price fell from this level in the past and how many pacent it dropped ...use a line ..do your analysis based on history...if it breacks that level ..its going straight to -61.8 or straight to the monthly trendline ...