Anatomy of a Breakout: How to Spot It Before It Fakes You OutFew things in trading are as appealing as a breakout. The chart tightens, volume starts to stir, headlines align, your alerts start going off , and suddenly — boom! Price explodes above resistance. Your adrenaline spikes and you pop open that long.
But just as often, that breakout turns out to be nothing more than an expensive head fake. Price stalls. Sellers swoop in. Your stop gets clipped. And now you’re sitting there, blinking at your screen, “Welp… that was quick.”
Welcome to the bittersweet world of breakouts — where opportunity and deception dance like partners at a high-stakes poker table.
📢 What Is a Breakout, Really?
Let’s get the basics out of the way: A breakout happens when price pushes beyond a key support or resistance level that’s been holding for a while.
That level could be a previous high, a consolidation range, a trendline, or a psychological number that traders obsess over because humans love round numbers (did someone say Bitcoin BITSTAMP:BTCUSD at $120,000 ?).
The logic is simple: Once price clears a well-watched level, trapped shorts have to cover, new longs pile in, and momentum feeds on itself. That’s the dream scenario.
But markets aren’t always that generous. For every clean breakout, there are a few fakeouts lurking — luring in overeager traders with the promise of easy money before slamming the door shut.
⚠️ Why Breakouts May Fail
If breakouts were easy, we’d all be rich. The problem is that breakouts attract a special kind of crowd: late-to-the-party momentum chasers, breakout algorithm bots, and retail traders who read one blog post about technical analysis.
The moment price nudges above resistance, FOMO kicks in. Volume surges. But if the move isn’t backed by genuine institutional buying (you need lots of billions to move the needle nowadays), it quickly becomes what seasoned traders call a “liquidity vacuum” — thin air where the only participants are you, a few equally optimistic Reddit threads, and market makers more than happy to take the other side.
Sometimes breakouts fail because:
The move lacked volume confirmation.
Macro headlines shifted mid-breakout.
A key level was front-run, and the real buyers have already taken profit.
It was a deliberate trap set by larger players to hunt stops before reversing.
Or — more often — the market just needed an excuse to shake out weak hands before resuming the actual move later.
🍸 Volume: The Truth Serum
Let’s be very clear: Breakouts without volume are like dating profiles without photos — you should be suspicious.
When real breakouts occur, you’ll usually see strong accompanying volume. That’s your proof that big players — funds, institutions, serious money — are committing to the move. No volume? Maybe the summer vibes are already here .
Smart traders wait for confirmation:
Is volume above average relative to recent sessions?
Is price holding above the breakout level after the initial pop?
Are follow-through candles printing convincingly?
Are we seeing continuation across related sectors or instruments?
Without these signs, that breakout candle may just be a cruel joke.
🤯 Breakout Psychology
Breakouts prey on two of the most dangerous emotions in trading: greed and urgency. The market whispers, “If you don’t get in now, you’ll miss it.”
This is where breakout psychology becomes more dangerous than the chart itself. Once a breakout happens, most traders are no longer analyzing — they’re reacting. They buy late, set tight stops below the breakout level, and become easy prey for stop-hunting algorithms.
✨ Types of Breakouts
Not all breakouts are created equal. Here’s the lineup you should be watching for:
Clean Breakouts:
The rarest and most beautiful. Strong move, high volume, sustained momentum. You’ll know it when you see it — or after you’ve hesitated and missed it.
Fakeouts (a.k.a. False Breakouts):
Price nudges just past resistance, triggers breakout orders, then swiftly reverses. Designed to shake out breakout traders before resuming the original trend.
Break-and-Retest Setups:
Often the highest-probability trades. Price breaks out, then pulls back to retest the former resistance (now support). If buyers defend this retest, you’ve got confirmation.
News-Driven Breakouts:
Triggered by earnings, economic data, or political events. Volatile, fast, and often unsustainable unless backed by real fundamental shifts.
📈 The “Pre-Breakout Tell”: Reading the Tape
Good breakout traders aren’t just watching levels — they’re watching how price behaves near those levels in advance.
Tight consolidation? Lower volatility into resistance? Declining volume as price grinds higher? That often signals an impending breakout as supply dries up.
Conversely, choppy action with large wicks and erratic volume often signals indecision — ripe conditions for failed breakouts and fakeouts.
Tape-reading matters. The cleaner the structure before the breakout, the better your odds.
💰 Breakout Traders Need Thick Skin
Even with perfect analysis, breakout trading requires accepting that many will fail. That’s the game. Your job isn’t to nail every breakout — it’s to size your positions properly , keep losses small when faked out, and let the clean breakouts run when you catch one.
Stop-loss discipline is everything. Breakouts are binary events: you’re either right quickly, or you’re cutting the trade quickly. There’s no room for “maybe it’ll come back.”
The most painful breakouts are the ones that fake out, stop you, then continue in your original direction. Every breakout trader has lived that nightmare. Accept it. Build it into your risk plan.
👉 Takeaway: Prepare the Setup, Anticipate the Fakeout
Breakouts will always be part of every trader’s playbook. But they require discipline, experience, and an iron stomach. The market loves to tempt you with early signals — your job is to separate signal from noise.
Pro tip: Start your day by checking the Economic calendar and browsing the latest news — staying informed (and witty) helps you build better context for smarter decisions.
So before you chase that next breakout candle, ask yourself:
Is volume there?
Is the broader market supportive?
Have I managed my risk before clicking buy?
Because in trading, the only thing worse than missing a breakout… is getting faked out and blowing up your account chasing it.
Now over to you : Are you a breakout trader or a fakeout victim? Share your best (or worst) breakout stories — we’ve all been there.
EURUSD trade ideas
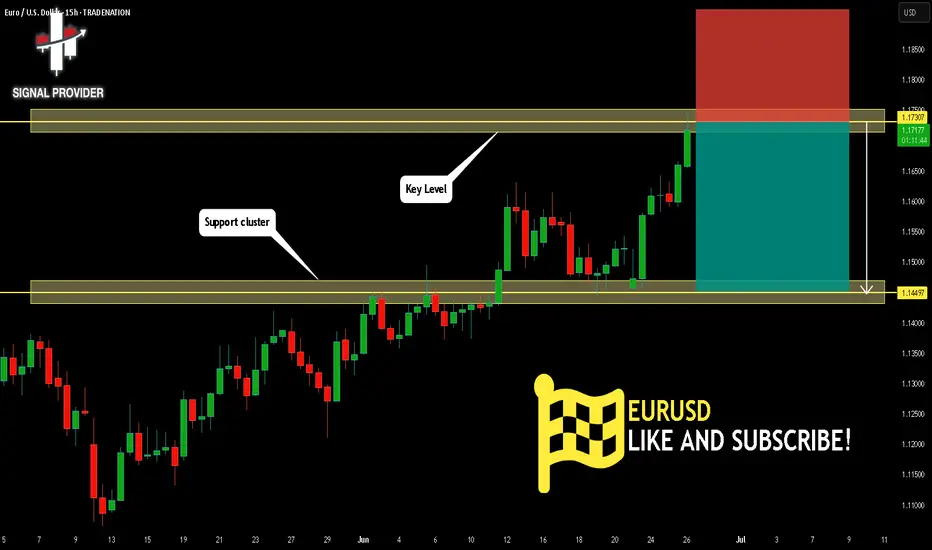
EURUSD Will Move Lower! Short!
Please, check our technical outlook for EURUSD.
Time Frame: 15h
Current Trend: Bearish
Sentiment: Overbought (based on 7-period RSI)
Forecast: Bearish
The price is testing a key resistance 1.173.
Taking into consideration the current market trend & overbought RSI, chances will be high to see a bearish movement to the downside at least to 1.144 level.
P.S
Overbought describes a period of time where there has been a significant and consistent upward move in price over a period of time without much pullback.
Disclosure: I am part of Trade Nation's Influencer program and receive a monthly fee for using their TradingView charts in my analysis.
Like and subscribe and comment my ideas if you enjoy them!
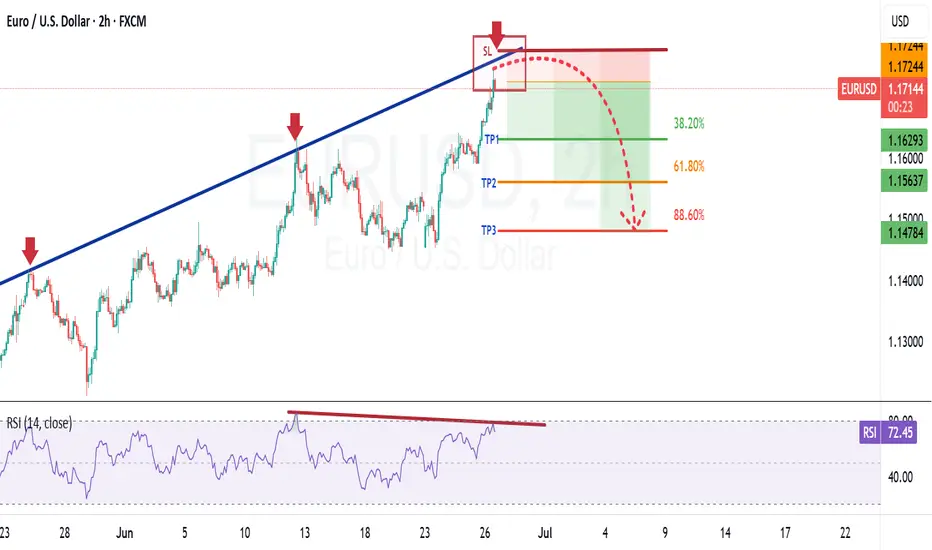
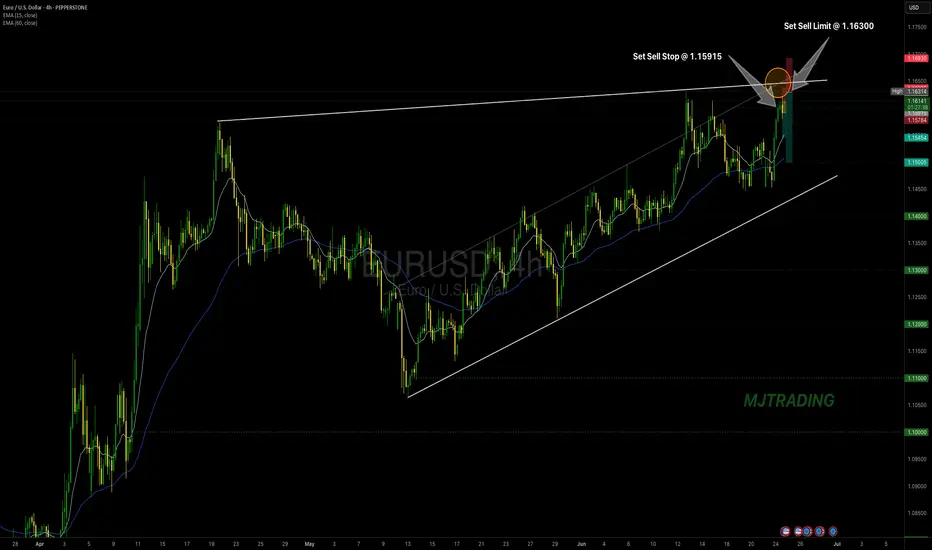
EURUSD Sell SetupBy: MJTrading:
EUR/USD has rallied into a significant resistance zone, approaching the upper boundary of a rising wedge/channel pattern. The price is now hovering around a key confluence zone, where trendline resistance and horizontal supply intersect ( 1.16300 —1.16500 )
There are to possible scenarios:
1) If the price Rejects directly from previous High
🔹 Position 1: Sell Stop @ 1.15915
🛑 Stop Loss: 1.6375
🎯 Take Profit: 1.5454
R/R:1
isk Level: Medium
2) If price tries to reach the boundary of the wedge or make a Fake breakout:
🔹🔹 Position 2: Sell Limit @ 1.16300
🛑 Stop Loss: 1.6930
🎯 Take Profit: 1.5000
R/R:2
Risk Level: Low
📌 This zone offers a high-probability reversal setup
📉 Why it Matters:
Price action shows signs of exhaustion after a parabolic move.
EMA structure is stretched, hinting at a potential pullback.
Lets ZOOM OUT:
Daily Chart:
ZOOM IN:
Stay disciplined, let price come to you, and manage risk.
—
#EURUSD #ForexSetup #TradingStrategy #TechnicalAnalysis #ChartPattern #FXTrading #ShortTrade #MJTrading #BearishReversal #PriceAction #SwingTrade #ForexIdeas #Trendlines #BreakoutOrFakeout #RiskReward
Euro's Surge on USD Weakness – Is 1.20 the Next Stop?EURUSD: Euro's Surge on USD Weakness – Is 1.20 the Next Stop?
Hello TradingView Community!
The EURUSD pair is currently commanding significant attention with its strong upward momentum.
🌍 Fundamental Highlights: Euro's Tailwinds & USD's Headwinds
The Euro has demonstrated notable strength, recently breaching the 1.17 mark to hit its highest level in over 3.5 years. According to ING, if this momentum holds, the next target could be 1.20, contingent on continued USD weakness.
The US Dollar faces considerable pressure following news that President Trump intends to name a successor to Fed Chair Powell soon, sparking concerns about the Fed's independence. Such speculation often leads to expectations of a more 'dovish' monetary policy, weakening the USD.
Adding to the Euro's support are the NATO agreement to increase defense spending targets to 5% and President Trump's seemingly "less aggressive" stance towards the EU.
In summary: Should USD depreciation persist, not only the Euro but other asset classes might also attract capital inflows, particularly given the ongoing uncertainties surrounding inflation risks and monetary policy.
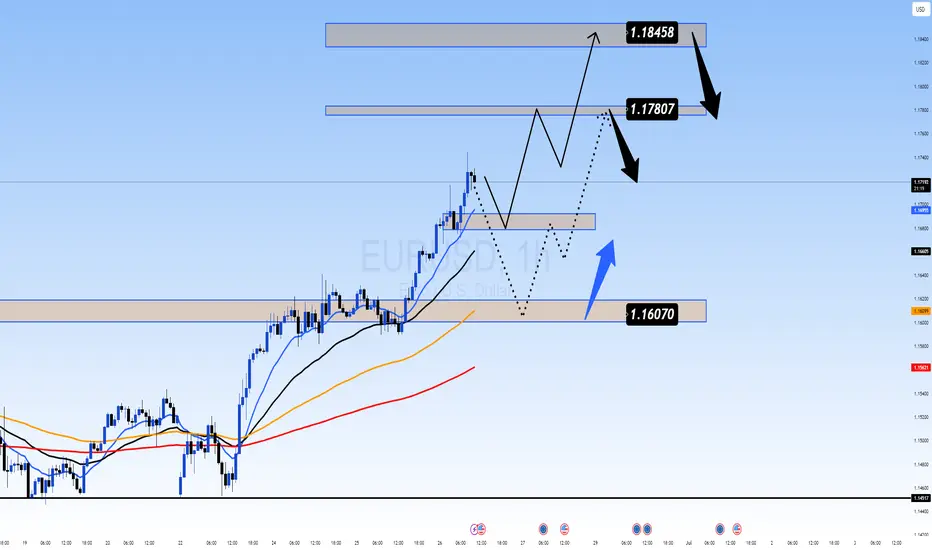
📊 EURUSD Technical Outlook (H4/M30 Chart):
Our technical analysis of the EURUSD chart (image_b73298.png) confirms a clear and robust uptrend, characterized by successive higher highs and higher lows. The EMAs are in a bullish alignment, reinforcing this upward trajectory.
Upside Targets (Potential BUY Zones):
1.17807: The initial potential target if the bullish momentum continues.
1.18458: A higher target representing the next potential resistance zone.
Key Support Levels (Potential BUY Zones for pullbacks):
1.16070: A strong support level where demand could emerge after a correction.
An implied intermediate support around 1.166xx (visually suggested by price action between current levels and 1.16070) could also offer buying opportunities after minor pullbacks.
🎯 EURUSD Trading Plan:
BUY Zone 1 (Intermediate Pullback):
Entry: 1.16600 - 1.16700
SL: 1.16450
TP: 1.16800 - 1.17000 - 1.17200 - 1.17500 - 1.17807 - 1.18000 - 1.18300 - 1.18458
BUY Zone 2 (Strong Support):
Entry: 1.16070
SL: 1.15900
TP: 1.16200 - 1.16400 - 1.16600 - 1.16800 - 1.17000 - 1.17300 - 1.17600 - 1.17807 - 1.18458
SELL Zone (Consider only at upside targets with clear reversal signals):
Entry: 1.18458 (This is an upside target, but also a potential resistance for selling if strong reversal signals appear).
SL: 1.18600
TP: 1.18300 - 1.18000 - 1.17807 - 1.17500 - 1.17200 - 1.17000 - 1.16800
⚠️ Key Factors to Monitor:
Fed Leadership News: Any official announcements regarding the Fed Chair succession will trigger significant USD volatility.
Eurozone Economic Data: Upcoming inflation, GDP, and employment reports.
ECB Statements: The European Central Bank's stance on monetary policy.
Geopolitical Developments: Major tensions or agreements can influence market sentiment.
Trade smart and always manage your risk effectively! Wishing everyone a profitable trading day!
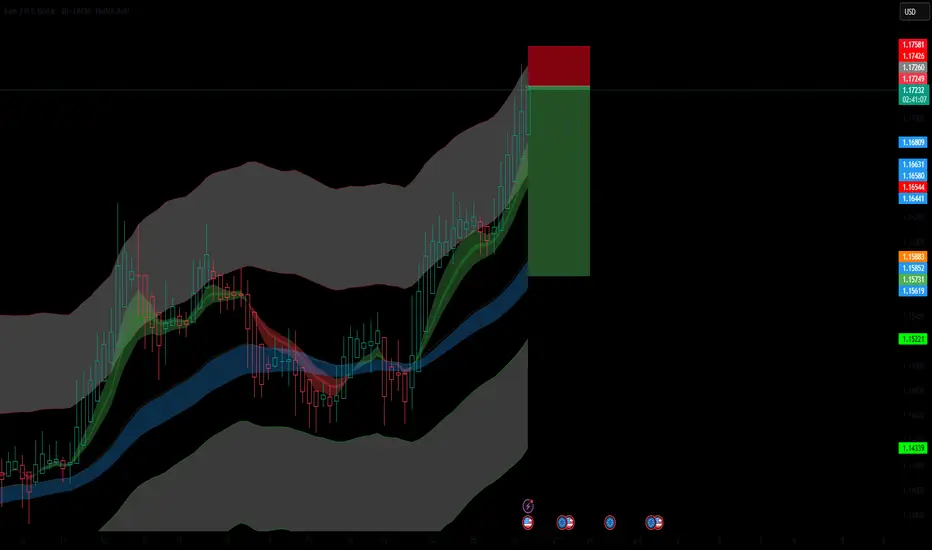
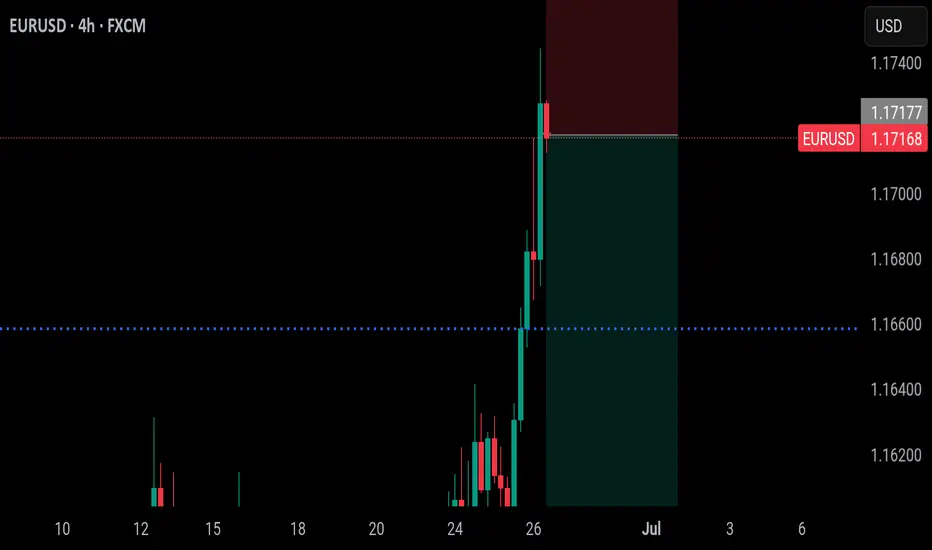
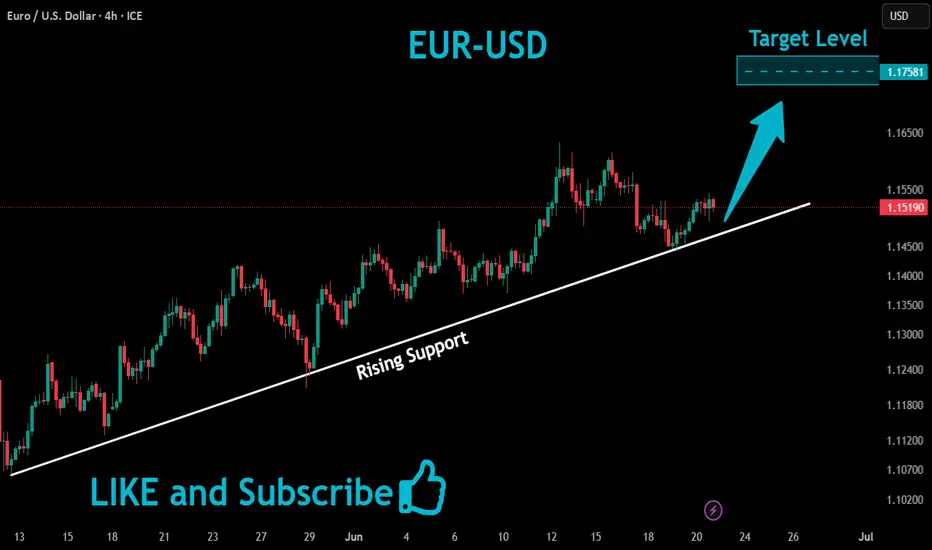
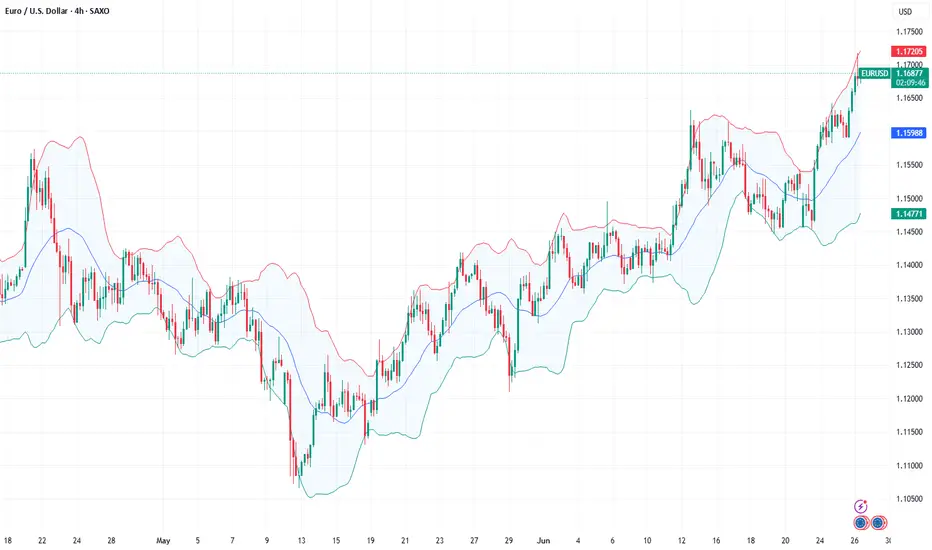
Overextended Rally into Resistance ZoneEUR/USD has pushed into the upper boundary of the Keltner Channel on the 4H timeframe, indicating a potential exhaustion of bullish momentum. Price is showing signs of overextension with Heikin Ashi candles losing strength near a key resistance zone.
📉 Short Position Setup:
Entry: 1.17220 (near upper Keltner resistance)
SL: 1.17581 (above recent highs and volatility buffer)
TP: 1.15220 (targeting mid-channel and previous structure support)
🔻 Bearish Confluence:
Price rejecting upper Keltner band
Potential for mean reversion after strong rally
Weakening bullish momentum in candle structure
Confirmation with further bearish price action or divergence signals would strengthen the case for downside continuation.
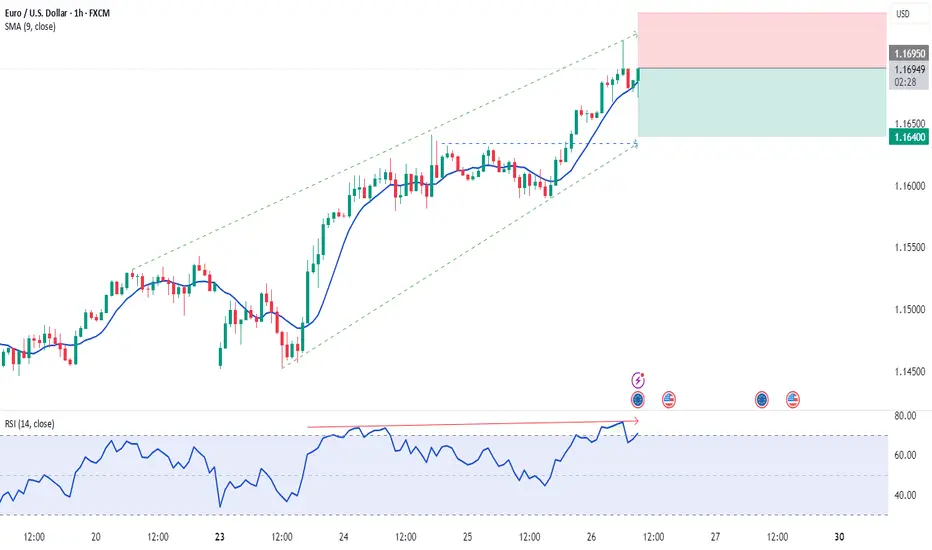
Shorting Optimism: EUR/USD Rally vs RealityAfter the spike to 1.1640 driven by temporary ceasefire news and USD weakness, I’ve taken a short position on EUR/USD. The market priced in too much optimism too fast, and I see limited upside beyond this zone in the current macro landscape. I’m positioned for a controlled retracement back toward the 1.1460–1.1520 region.
The play? Fade the overextension, follow structure, and manage from strength.
Technicals:
• The pair ran into a strong supply zone near 1.1640, which aligns with a previous liquidity sweep.
• Momentum has slowed visibly on lower timeframes, with candles rejecting highs and wicks printing upper tails.
• Daily and 4H SMAs are overstretched. The 20 SMA on H4 is accelerating upward, but RSI is near overbought and flattening.
• My short entry was taken with a stop above 1.1745 and first target at 1.1540, second at 1.1500.
• A potential retest of the 1.1660 zone could offer additional entries if invalidation remains intact.
Fundamentals:
• ECB vs Fed Divergence: The Fed holds firm on rates amid sticky inflation, while the ECB is under pressure to ease further due to weak growth.
• EU Struggles: PMI data remains in contraction territory; HICP cooling to 1.7% YoY suggests little reason for tightening.
• Political Instability: Germany and France both facing internal political crises — risk premia rising.
• Ceasefire Priced In: EUR rally on Middle East headlines lacks depth — conflict paused, not resolved.
• USD Resilience: Weak recent data aside, the USD remains a safe haven. Fed’s Powell reiterated that cuts aren’t imminent.
⚠️ Bias: Bearish as long as price trades below 1.1640. Watching how the market reacts to Fed testimony and ECB rhetoric this week.
🧠 Reminder: Don’t get emotional after vertical rallies. When everyone gets excited, I look for exhaustion. That’s where trades begin.
Note: Please remember to adjust this trade idea according to your individual trading conditions, including position size, broker-specific price variations, and any relevant external factors. Every trader’s situation is unique, so it’s crucial to tailor your approach to your own risk tolerance and market environment.
EURUSD reaches a fresh multi-year highEURUSD keeps on pushing higher as Trump is pushing Powell to leave. See the video how traders left behind might buy a dip.

EURUSD Jun 26 The information and publications are not meant to be, and do not constitute, financial, investment, trading, or other types of advice or recommendations.
Have a nice day ahead.
EURUSD Eyes Higher HighsHi there,
The EUR/USD is showing a bullish setup on the 30-minute chart, with two key price targets in focus and an upside bias toward 1.16867.
I’ve seen a completed ABC corrective pattern, followed by a significant low at point D. This suggests that the recent correction may be over. If momentum continues, the pair could rally from current levels, potentially breaking above the previous swing high at point C to form a new higher high.
Immediate resistance levels to watch are 1.16016 and 1.16311, with the main bullish target at the 0.618 Fibonacci extension near 1.16867. If price holds above the recent low and maintains upward momentum, we can anticipate that these targets remain in play.
Happy Trading,
K.
Not trading advice.

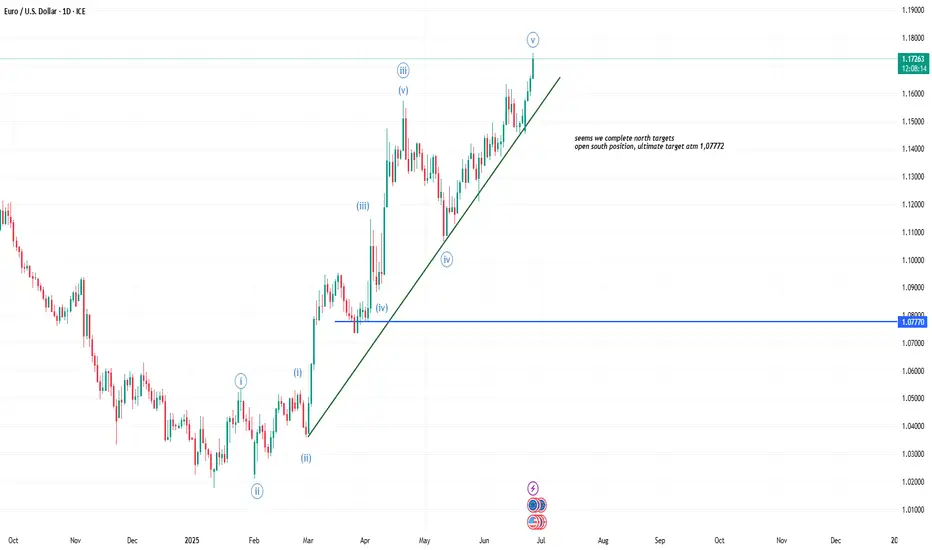
I'm selling EURUSD, TOP is in!EURUSD is bearish now. Yes the trend is bullish, I know but I'm entering base on 15 mins BOS.
If you can gamble, this is a beautiful trade. When we see confirmation on a 4hrs timeframe, we enter more
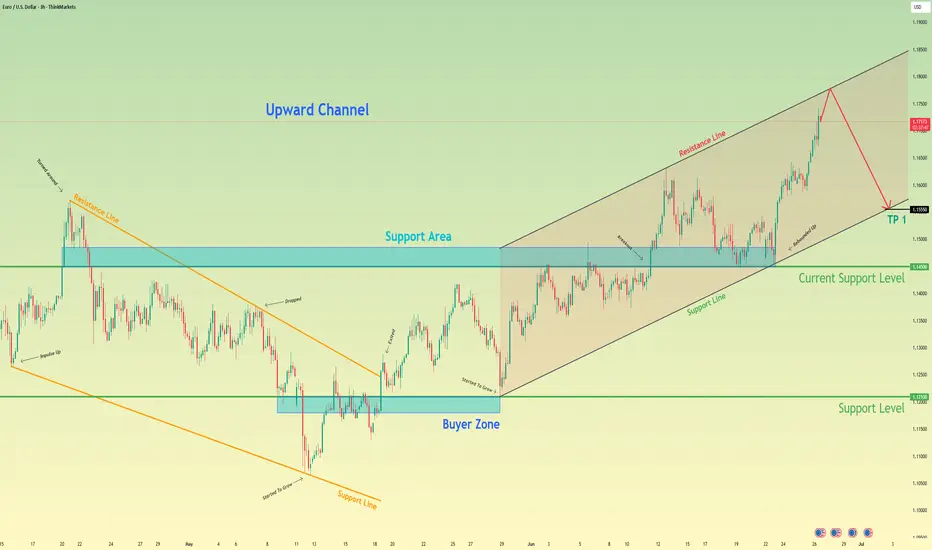
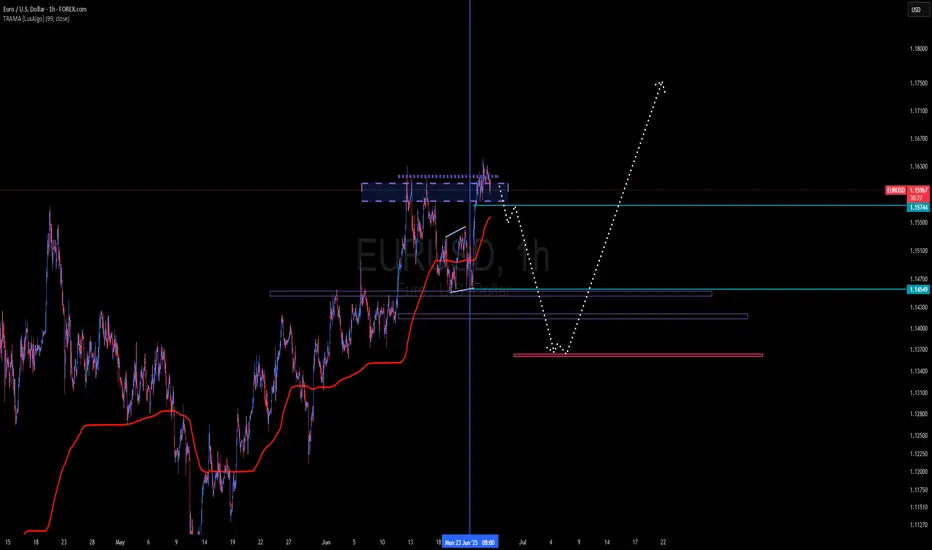
Euro may start to decline to support line of upward channelHello traders, I want share with you my opinion about Euro. Earlier, the price was trading inside a downward wedge, gradually making lower highs and lower lows. After reaching the bottom of the wedge near the buyer zone (1.1210 - 1.1180), we saw a strong bullish impulse that broke through both the resistance line of the wedge and the support area near 1.1450 - 1.1485. This breakout signaled the beginning of a new phase - a transition into an Upward Channel. Since then, the price has been forming higher highs and higher lows, respecting both the upper and lower boundaries of this new structure. Along the way, it has rebounded from the support line multiple times and recently made a strong move up toward the resistance line of the channel. Currently, the price is approaching that resistance line, which may act as a potential reversal area. Given the previous price behavior and the clearly defined channel, I expect the price to reach the top boundary and then start to decline toward the lower support line. That’s why I’ve set my TP 1 at 1.1555 points, which aligns perfectly with the support line of the upward channel. Based on the recent breakout, the structure of the trend, and the reaction from key zones, I remain short-biased for the upcoming sessions. Please share this idea with your friends and click Boost 🚀
Disclaimer: As part of ThinkMarkets’ Influencer Program, I am sponsored to share and publish their charts in my analysis.
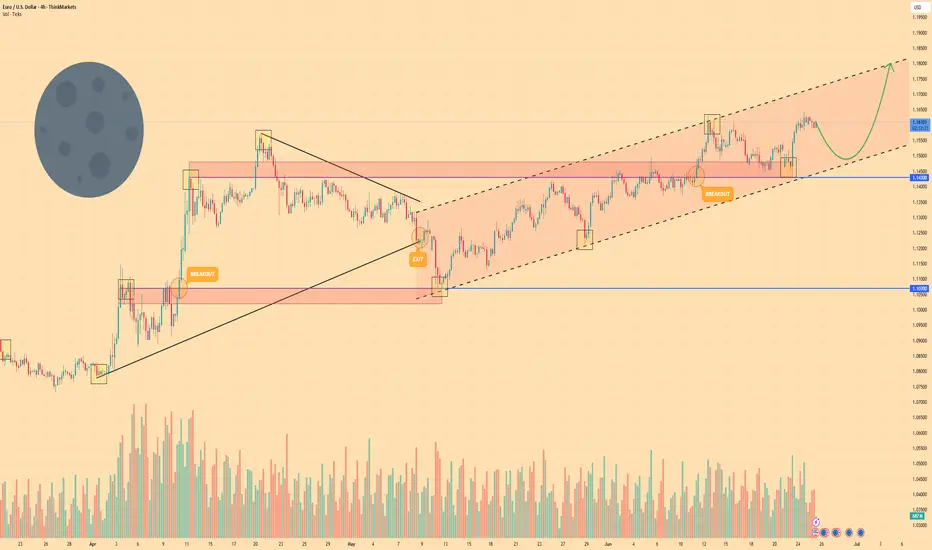
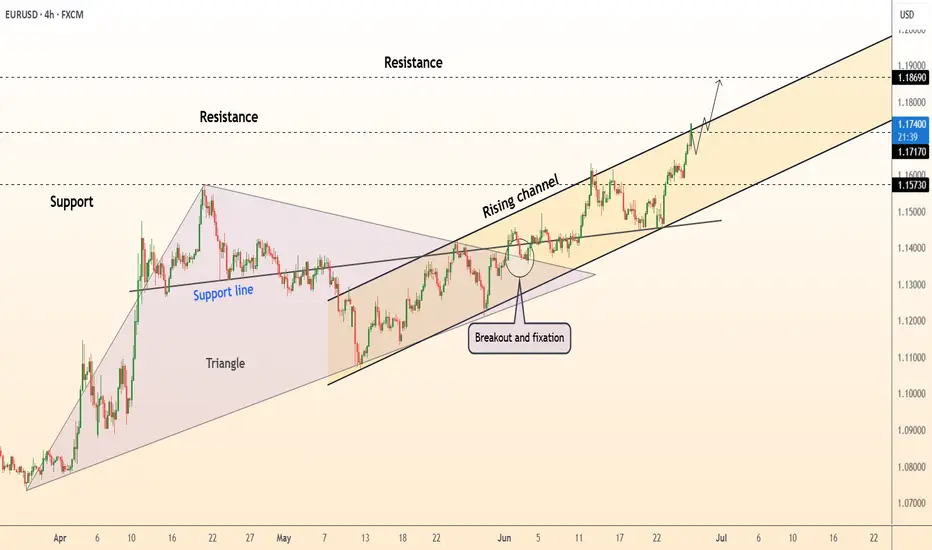
EURO - Price can correct and then continue move up in channelHi guys, this is my overview for EURUSD, feel free to check it and write your feedback in comments👊
Recently, price entered to triangle, where it at once made an upward impulse from support line to resistance line.
Price broke $1.1070 with $1.1430 levels, after which turned around and started to decline, breaking $1.1430 level again.
Next, price exited from triangle and started to grow inside rising channel, where it rose near support line long time.
Later it reached $1.1430 level one more time and soon broke it again, after which made retest and continued to grow.
But when it reached resistance line of channel, it made correction movement to support area and then bounced up.
Now, I think that Euro can fall to support line and then continue to move up inside rising channel to $1.1800
If this post is useful to you, you can support me with like/boost and advice in comments❤️
Disclaimer: As part of ThinkMarkets’ Influencer Program, I am sponsored to share and publish their charts in my analysis.
EURUSD Will Keep Growing!
HI,Traders !
#EURUSD is trading in an
Uptrend along the rising
Support and the pair will
Soon retest the support
From where we will be
Expecting a bullish rebound
And a bullish continuation !
Comment and subscribe to help us grow !
DeGRAM | EURUSD will continue to grow rapidly📊 Technical Analysis
● Euro keeps hugging the upper rail of the 3-month rising channel after re-testing the broken April triangle top as support, confirming fresh trend acceleration.
● Momentum is unbroken – every 4 h pullback since 17 Jun has held above the inner trend-line (now 1.1717); measured channel height points to the next fib / horizontal cluster at 1.1869.
💡 Fundamental Analysis
● Softer US durable-goods orders and slowing housing data cooled 2-yr yields, while ECB speakers signalled no rush to ease again; the short-rate gap narrowed for a third session, underpinning EUR strength.
✨ Summary
Buy dips ≥1.1717; upside targets 1.1800 then 1.1869. Bull view void on a 4 h close below 1.1600.
-------------------
Share your opinion in the comments and support the idea with a like. Thanks for your support
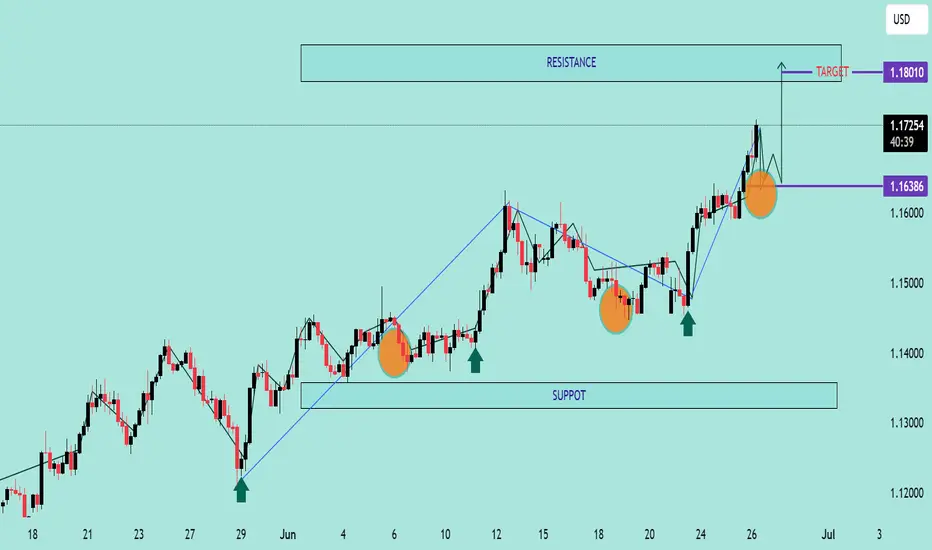
EUR/USD Bullish Continuation Analysis EUR/USD Bullish Continuation Analysis 🚀💶
📊 Chart Summary:
The EUR/USD pair is demonstrating a strong bullish structure with consistent higher highs and higher lows. Recent price action shows a breakout above the 1.16386 resistance level, now acting as support 🛡️. The market is currently retracing and might retest this new support zone before continuing its upward move toward the target.
🔍 Key Observations:
🔸 Bullish Structure:
Multiple bullish impulses have formed a clean staircase pattern (🔼⬆️), indicating sustained buying momentum.
🔸 Support Zone 🟦 (1.13200 - 1.14000):
This zone has been tested multiple times, confirming its strength and the base of this bullish rally.
🔸 Breakout & Retest 🟠:
Price broke above the 1.16386 resistance level, pulled back slightly (highlighted by the orange circle), and now looks ready for a potential continuation to the upside.
🔸 Target 🎯: 1.18010
A clear target has been set based on measured move or resistance projection. If the price respects the current structure, we may see a continuation toward this level.
✅ Trade Outlook:
Bias: Bullish 📈
Entry Zone: Around 1.16386 (upon bullish confirmation)
Target 🎯: 1.18010
Invalidation ❌: Break below 1.1600 with bearish momentum
🧠 Technical Tip:
Always wait for confirmation on the retest before entering. Wick rejections or bullish engulfing candles at the support zone can provide additional entry confidence. 🔍✅
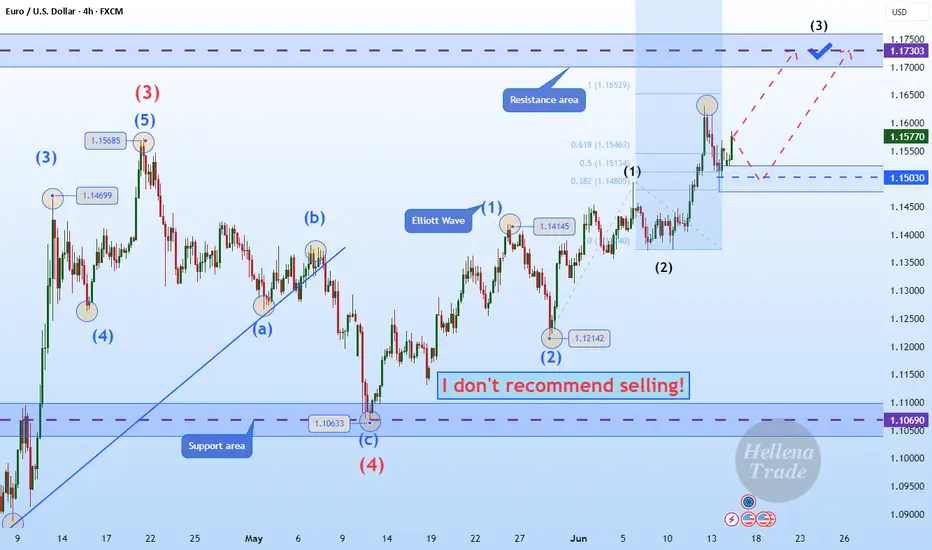
Hellena | EUR/USD (4H): LONG to the resistance area 1.17300.Colleagues, I believe that the upward five-wave impulse is not over yet. At the moment, I see the formation of wave “3” of the lower order and wave “3” of the middle order, which means that the upward movement will continue at least to the resistance area of 1.17300. This area is located between two levels (1.16529-1.18252) of Fibonacci extension.
A correction is possible — be careful.
Manage your capital correctly and competently! Only enter trades based on reliable patterns!
Eurusd 4hr Chart Analaysis EUR/USD is entering a mild bearish correction or pullback phase, which may continue until it reaches the key support levels around 1.14272 – 1.13693. From this zone, there is a strong possibility that the pair could resume its bullish trend. Good luck!
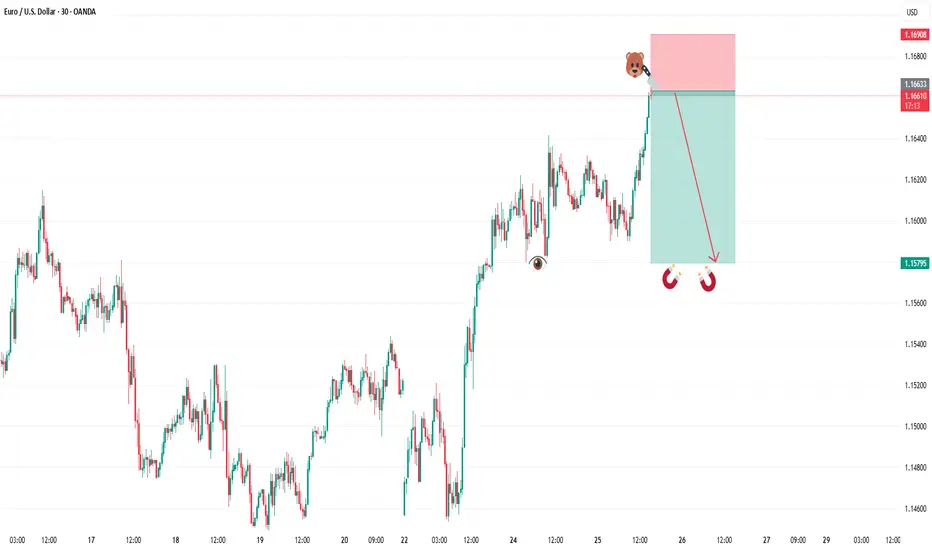
SELL EURUSDIn todays session we are actively monitoring EURUSD for selling opportunity. Our entry is at the current high price of 1.16600 our target is below 1.15800 and stops above 1.16900 (to be adjusted accordingly). Use proper risk management and cheers to you all.
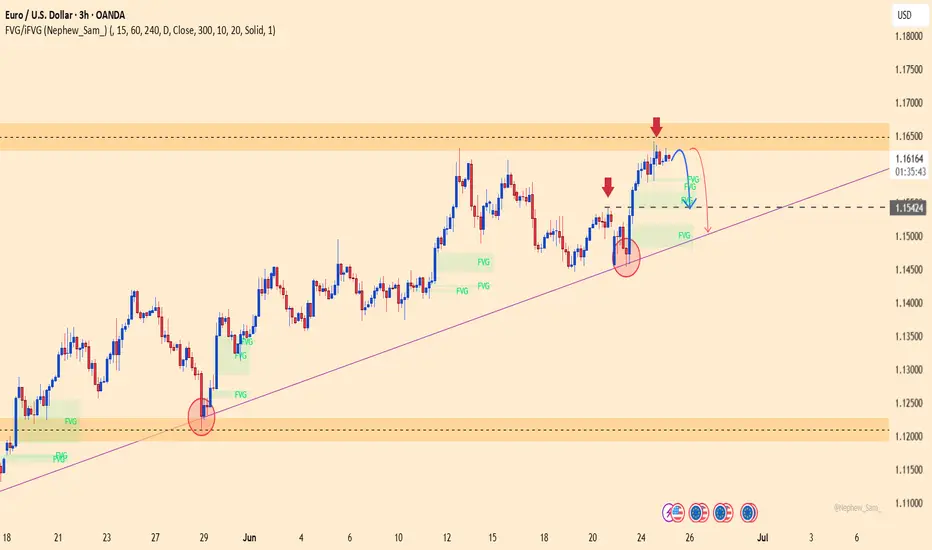
EURUSD – Signs of Weakness, Risk of Trendline BreakEURUSD is showing signs of weakness after a strong rejection at the 1.16300 resistance zone — a level that previously acted as a distribution area. Despite a brief rebound driven by mixed PMI data, the Euro failed to maintain its momentum and is now turning lower.
If price breaks below the support zone around 1.15400 — which aligns with both the trendline and an old FVG — a deeper decline toward the 1.15000 level could be triggered. Continued failure to surpass the 1.16300 resistance would further strengthen the corrective pressure.
On the fundamental side, expectations for the ECB to hold rates steady and weaker-than-expected Eurozone data are dampening the Euro’s outlook. Meanwhile, the US Dollar remains firm on safe-haven demand, with upcoming US GDP and Core PCE data likely to drive short-term direction.
Fundamental Market Analysis for June 26, 2025 EURUSDThe EUR/USD pair continues to rise to 1.16800 during Thursday's Asian session. The US dollar (USD) is weakening against the euro (EUR) as investors worry about the future independence of the US Federal Reserve (Fed). Final data on US GDP growth for the first quarter will be in focus later on Thursday.
US President Donald Trump said on Wednesday that he is considering three or four potential candidates to replace Fed Chairman Jerome Powell. According to the Wall Street Journal, Trump may consider former Fed Governor Kevin Warsh, National Economic Council Director Kevin Hassett, and Treasury Secretary Scott Bessent. Other candidates include former World Bank President David Malpass and Fed Governor Christopher Waller.
This raises questions about a potential weakening of the Fed's independence and a possible decline in its authority, which undermines the dollar and creates favorable conditions for the major currency pair.
Across the Atlantic, European Central Bank (ECB) policymakers are concerned about the economic outlook due to Trump's tariff policy and geopolitical risks. Earlier this week, ECB policymaker François Villeroy de Galhau said that despite current conditions, further rate cuts are still possible. Statements by ECB policymakers may put pressure on the single currency in the near term.
Trading recommendation: BUY 1.16750, SL 1.16300, TP 1.17500
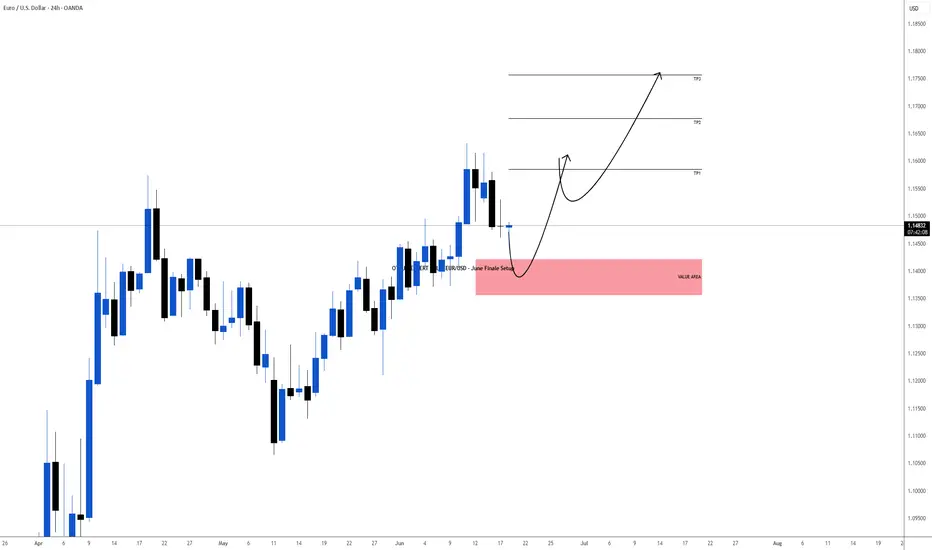
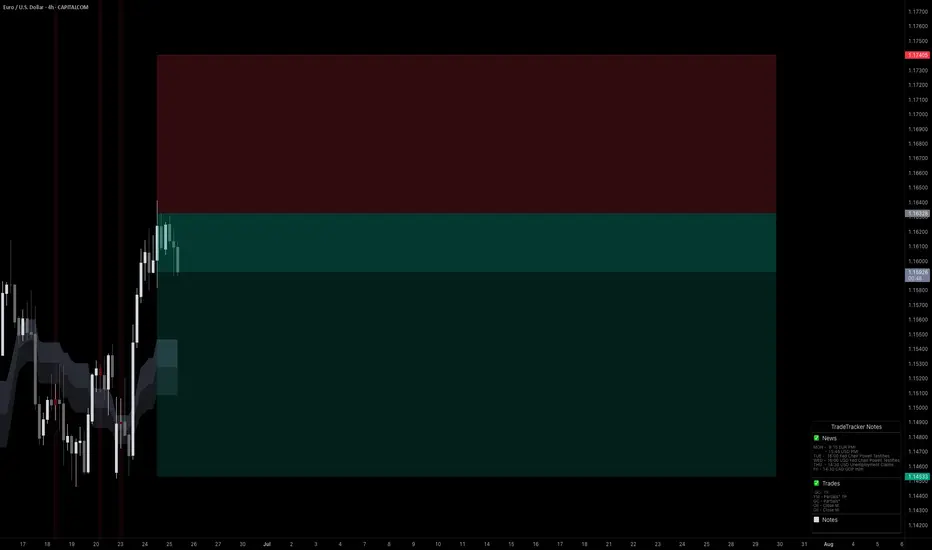
OTEUM EXPERT CALL: EUR/USD – June Finale Setup We’re eyeing the last intramonth swing of June, expected to bleed into early July. Our playbook: let the market cough up one final risk-off spike on the Iran headlines 🌪️📰, then scoop up positions in the value zone (red box) for the next bullish leg 🚀.
Patience first, trigger later 🕰️🎯—wait for price to hit the sweet spot, load up, and ride the firework into summer. Stay nimble; geo-shock headlines can move the board fast ⚠️.