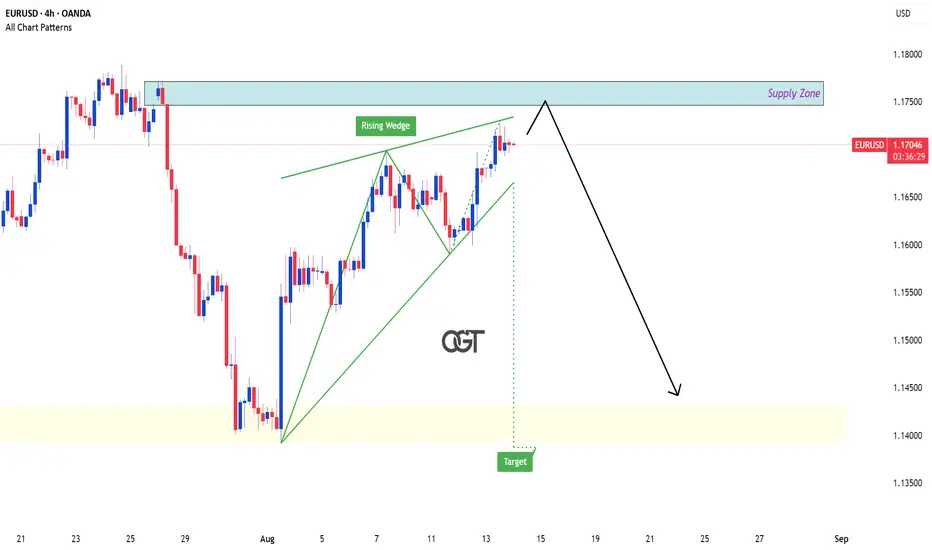
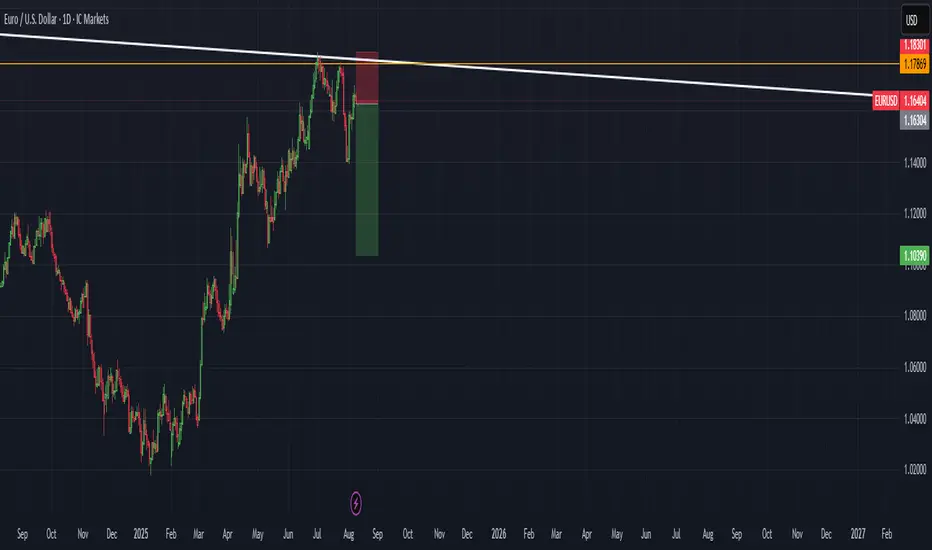
Technical Analysis: EUR/USD Swing Sell Setup📉 OANDA:EURUSD Technical Analysis: EUR/USD Sell Setup
The EUR/USD pair presents a compelling sell setup as we observe a rising wedge pattern, which typically indicates a potential trend reversal. Here’s the breakdown:
### Chart Observations:
- Current Price: 1.16416
- Resistance Levels: Notable resistance is observed at the 1.172/1.178 area. This range has shown strong rejection previously, suggesting it could be a key zone to watch for potential reversals.
- Trend Analysis: The rising wedge pattern signifies a weakening bullish momentum, with increasing bearish activity evident in the market.
- Volume Analysis: The volume indicators highlight increased selling pressure, supporting the bearish outlook.
### Trade Setup:
- Positioning: A swing sell position is recommended around the current price with targets set for potential downside movement.
### Take Profit Levels:
- TP 1: 1.156
- TP 2: 1.143
- TP 3: 1.126
### Risk Management:
- Stop Loss: A crucial component of this setup is to manage risk effectively. A stop loss should be placed above the invalidation level at 1.18298, protecting against unexpected bullish movements.
### Conclusion:
With the rising wedge pattern, clear resistance levels, and strong bear activity, this setup presents an excellent opportunity for traders looking to capitalize on potential downward movement in the EUR/USD pair. Manage your risk and trade wisely! Good luck, traders! 📊💼
EURUSD trade ideas

EUR/USD: Can the Uptrend Continue?Hello everyone, it's great to be back with you today!
In our previous discussion, we talked about the short-term uptrend in FX:EURUSD , and it seems that things are still going smoothly.
Recently, the weakening of the USD, with expectations that the Fed will cut interest rates three times this year, has undermined the USD and supported EUR. The DXY chart clearly reflects the weakness of the USD.
In the short term, EUR/USD may continue to fluctuate within a narrow range, with support at 1.163 and resistance at 1.1750. If U.S. inflation data remains weak and the Fed continues to cut rates, the EUR could appreciate.
However, in the long term, attention should be given to the 1.1750 resistance level, as it is a strong barrier and also the upper limit of the price channel.
What do you think, will EURUSD be able to maintain its uptrend?
EURUSD – High-Probability Reversal ZoneWelcome back! Let me know your thoughts in the comments!
** EURUSD Analysis !
We recommend that you keep this pair on your watchlist and enter when the entry criteria of your strategy is met.
Please support this idea with a LIKE and COMMENT if you find it useful and Click "Follow" on our profile if you'd like these trade ideas delivered straight to your email in the future.
Thanks for your continued support! Welcome back! Let me know your thoughts in the comments!
Short EURUSDFast down to retest and grab liquidities then up again to fill the gap
Everything is on the chart
Take profit from 1.1628-1.160
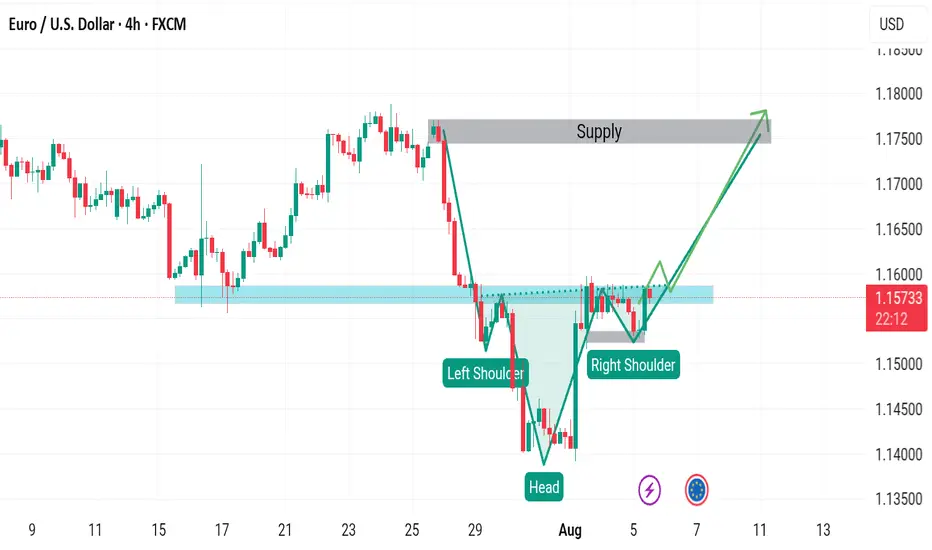
EURUSD BUY SETUPThe price will form a head and shoulders pattern because the candle in the second shoulder is very strong, which indicates that it will break the neck of the pattern. We also have a stronger bounce from below, so I expect an uptrend.
Bearish reversal for the Fiber?The price is rising towards the pivot and could reverse to the 1st support which is an overlap support.
Pivot: 1.1691
1st Support: 1.1591
1st Resistance: 1.1807
Risk Warning:
Trading Forex and CFDs carries a high level of risk to your capital and you should only trade with money you can afford to lose. Trading Forex and CFDs may not be suitable for all investors, so please ensure that you fully understand the risks involved and seek independent advice if necessary.
Disclaimer:
The above opinions given constitute general market commentary, and do not constitute the opinion or advice of IC Markets or any form of personal or investment advice.
Any opinions, news, research, analyses, prices, other information, or links to third-party sites contained on this website are provided on an "as-is" basis, are intended only to be informative, is not an advice nor a recommendation, nor research, or a record of our trading prices, or an offer of, or solicitation for a transaction in any financial instrument and thus should not be treated as such. The information provided does not involve any specific investment objectives, financial situation and needs of any specific person who may receive it. Please be aware, that past performance is not a reliable indicator of future performance and/or results. Past Performance or Forward-looking scenarios based upon the reasonable beliefs of the third-party provider are not a guarantee of future performance. Actual results may differ materially from those anticipated in forward-looking or past performance statements. IC Markets makes no representation or warranty and assumes no liability as to the accuracy or completeness of the information provided, nor any loss arising from any investment based on a recommendation, forecast or any information supplied by any third-party.

Sell eurusdWeekly still overbought
Monthly sell structure
Weekly buying channel and now respected the upper resistance of buying channel
Ready for the bearish correction now
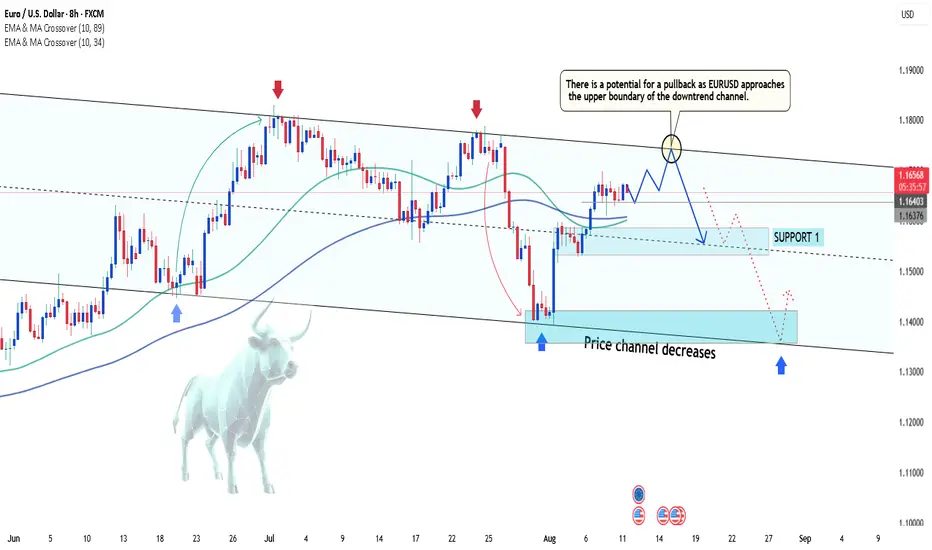
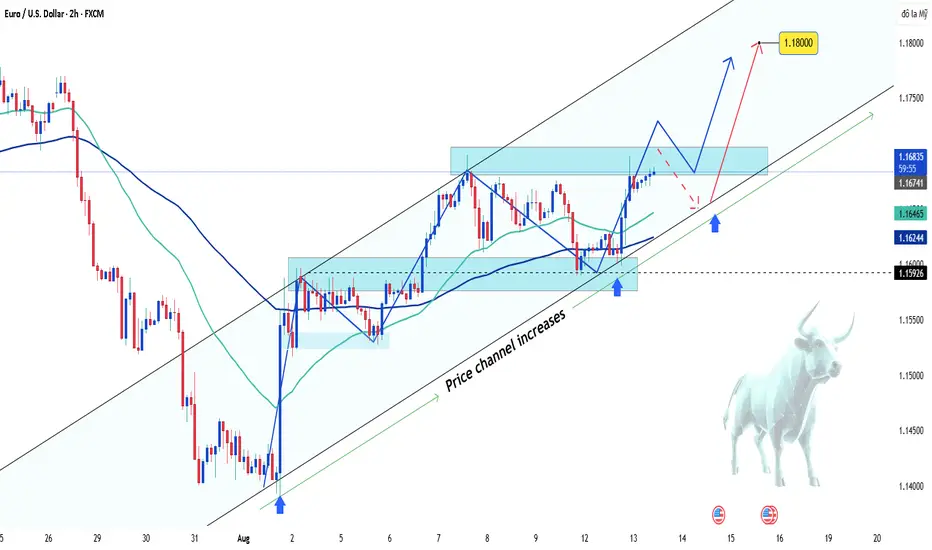
EURUSD short-term bullish outlookHello traders, what are your thoughts on the FX:EURUSD trend?
EURUSD is currently holding its uptrend within a rising channel, with key support around 1.1600 and a potential upside target near 1.1800.
The rising channel structure and stable 34 and 89 EMAs suggest that buying pressure could push the market beyond the current resistance area near 1.1700. However, a short-term pullback to retest support before resuming the climb is also a likely scenario.
Overall, the technical setup continues to favor a bullish outlook. Keep a close eye on the channel boundaries and resistance zones to refine your trade decisions.
In this analysis, I expect short-term upside momentum — what’s your view on this pair?
EURUSD Bulls Defend 1.16 – Break Above 1.17 Could Ignite RallyOn Monday, I mentioned that EURUSD could extend its ascent thanks to a short-term pennant formation.
For this reason, I bought into dips and, fortunately, my stop loss was well placed — the pair reversed only 5 pips above it.
Now, the trade is sitting comfortably with a 40-pip profit, and in my view, the upside potential isn’t over yet.
Technical view:
• On Monday, EURUSD dipped to test the 1.1600 support zone.
• The bounce from there resumed the uptrend that started after this month’s NFP release.
• The pair is now challenging the horizontal resistance around 1.1700.
A clean break above 1.1700 would likely open the door to the 1.1800 area.
Bias: EURUSD remains bullish as long as 1.1600 holds. 🚀
Disclosure: I am part of TradeNation's Influencer program and receive a monthly fee for using their TradingView charts in my analyses and educational articles.

SELLExpecting EURUSD to go down starting from next week. so far has respected resistance levels on multiple timeframes
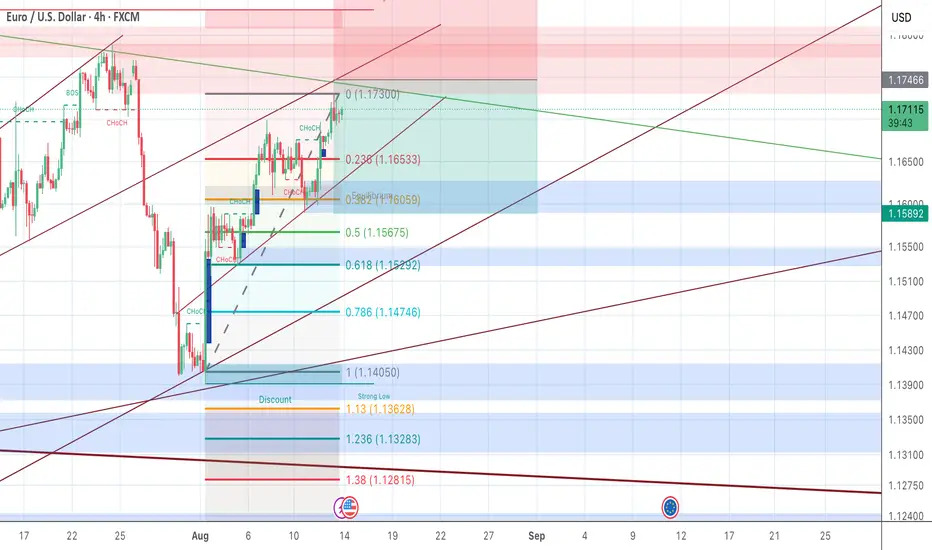
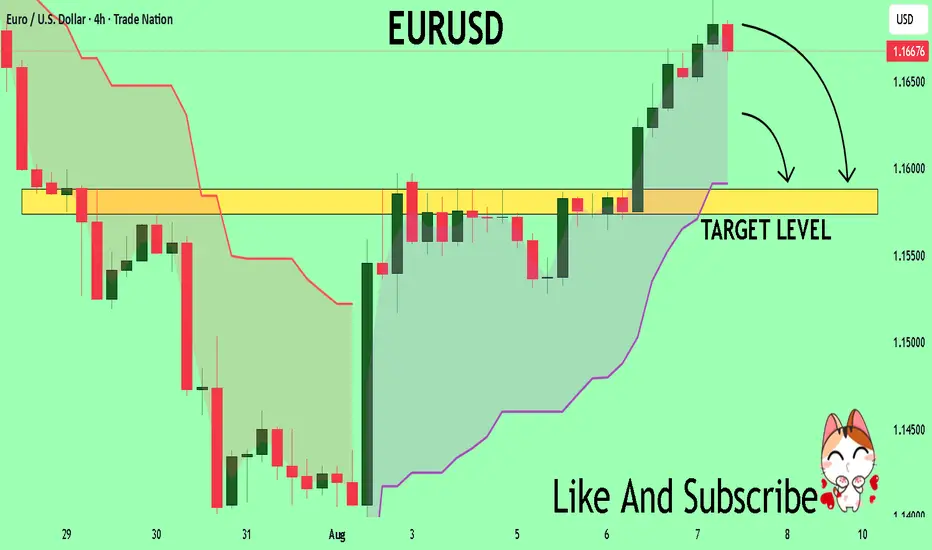
EUR/USD Analysis – August 10, 2025
EUR followed our previous scenario to the letter.
After hitting our take-profit level, price retraced right into our anticipated zone.
With the current sideways price action and compression,
I expect high volatility in the coming week.
Bias remains bearish – I anticipate another break to the downside,
with a likely move back to the previous swing low.

EUR/USD 4-Hour Candlestick Chart - OANDA4-hour candlestick pattern for the Euro/U.S. Dollar (EUR/USD) currency pair on the OANDA platform, showing a recent price of 1.16068 with a 0.00348 (-0.30%) decrease. Key levels include a sell signal at 1.16059 and a buy signal at 1.16076, with a highlighted resistance zone around 1.16697-1.16797 and support around 1.15453. The chart indicates a downward trend following a peak, with price action tracked from August 11 to September 11, 2025.

EURUSD Short (Update)EURUSD is still net short during the northern hemisphere summer.
There is lower volume causing a lack of conviction and direction.
Which way will it go?

EUR/USD bullish short- termThe US dollar (USD) is under pressure as markets anticipate a possible rate cut from the Federal Reserve, which could weaken the currency.
Meanwhile, the eurozone remains stable, supporting the euro’s position.
On the chart, price is currently testing a key support level reinforced by an ascending trendline and a strategic Fibonacci level. As long as this support holds, the bullish scenario remains favored, with a potential target around 1.1698.
💡 Strategy: Monitor price action at this support, especially ahead of any Fed announcements that could confirm or deny the expected rate cut.
EURUSD Buyers In Panic! SELL!
My dear subscribers,
EURUSD looks like it will make a good move, and here are the details:
The market is trading on 1.1704 pivot level.
Bias - Bearish
Technical Indicators: Both Super Trend & Pivot HL indicate a highly probable Bearish continuation.
Target - 1.1654
About Used Indicators:
The average true range (ATR) plays an important role in 'Supertrend' as the indicator uses ATR to calculate its value. The ATR indicator signals the degree of price volatility.
Disclosure: I am part of Trade Nation's Influencer program and receive a monthly fee for using their TradingView charts in my analysis.
———————————
WISH YOU ALL LUCK
EUR/USD short: Can King USD survive King DJT?Hello traders.
The market has been to kind to me since Friday's NFP print.
I closed my long EUR/USD, EUR/CAD and GBP/USD positions this morning.
The charts tell the story.
The reaction to the NFP print was dramatic but despite all the negative factors(tariffs, inflation, uncertainty, NATIONAL DEBT!) influencing the USD, I still believe that the greenback is the cleanest shirt in the laundry hamper.
For now, the technical picture point to a correction after the Euro Zone tariff announcement 10 days ago. If it really comes down to a contest, the USA will prevail in the tariff war.
Which brings me to my caption. I was watching President Trump announcing Apple's increased investment in the USA(another $100B in addition to the existing $500B commitment) and the best part of the announcement was that he did not call Mr. Cook, Tim Apple again.
While I am certainly supportive of Apple increasing production in certain sectors like their own M chips, recycling rare earths and so on, it still does not solve the problem of a us living on a planet with economic and trade practices that benefit everyone, especially the most needy on our planet of abundance.
And there lies the conundrum in my mind. President Trump wants to be the kid in the playpen that grabs all the toys and do not share. "Mine, mine, mine". Well, if all the toys are yours, it will lead to a stronger USD, increased inflation and therefore no rate cuts from the FOMC other than the projected 25bps in September. So, increased yields on USD 10Y treasuries and a deeper debt hole for future American generations but for now, I think the USD will prevail. Cleanest shirt, folks because as long as we have Don Donald in the Oval Office strong arming and black mailing everyone, King USD will reign. But woe the day that is is no longer true.
I am certain King USD will outfox King DJT. Why? As I have indicated in my profile, I live by the mantra that markets are sometimes irrational, but mostly right.
DXY is still holding above an uptrend line dating back to May 2011.
As for GBP/USD, rate decision later tonight.
Please share your thoughts.
TRADING RECAP ON AUDJPY AND EURUSDHey, my people, I have made a quick video on the trades I took from last week, and I hope that I have shared some lessons that would be useful for you all to take on board and I hope that by the end of this video, you will have clarity on what the trade probability would look like.

EURUSD bullish outlookDaily candle closed with bullish strength.
I'm expecting another bullish move today.
calculate your risk & reward.
Good Luck
EUROUSD NEW OUTLOOKAccording to M15 analysis EUROUSD Market is running in side wave from last few hours now market will be go down RESISTANCE LEVEL So if you are intersted then Go sell from RESISTANCE LEVEL TRADE AT YOUR OWN RISK

EURUSD : Status @ 8/8Just a weekly update.
There is no change since status @ 1/8. Buyer still in control. Looking into the future, it seems buying interest is still strong.
No sign of the SELL signal yet. Will keep exercising patience and wait.
Good luck.
EURUSD My Opinion! SELL!
My dear subscribers,
My technical analysis for EURUSD is below:
The price is coiling around a solid key level - 1.1668
Bias - Bearish
Technical Indicators: Pivot Points Low anticipates a potential price reversal.
Super trend shows a clear sell, giving a perfect indicators' convergence.
Goal - 1.1588
About Used Indicators:
By the very nature of the supertrend indicator, it offers firm support and resistance levels for traders to enter and exit trades. Additionally, it also provides signals for setting stop losses
Disclosure: I am part of Trade Nation's Influencer program and receive a monthly fee for using their TradingView charts in my analysis.
———————————
WISH YOU ALL LUCK
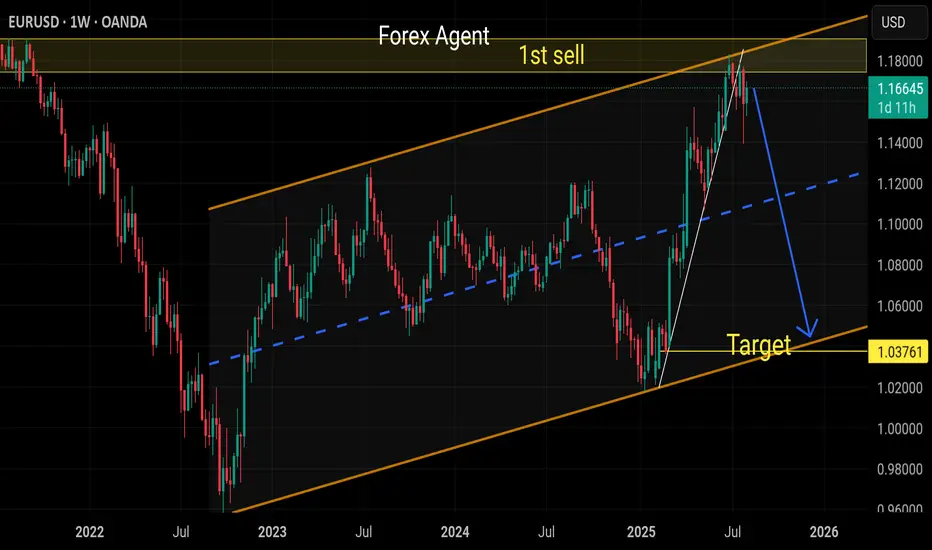
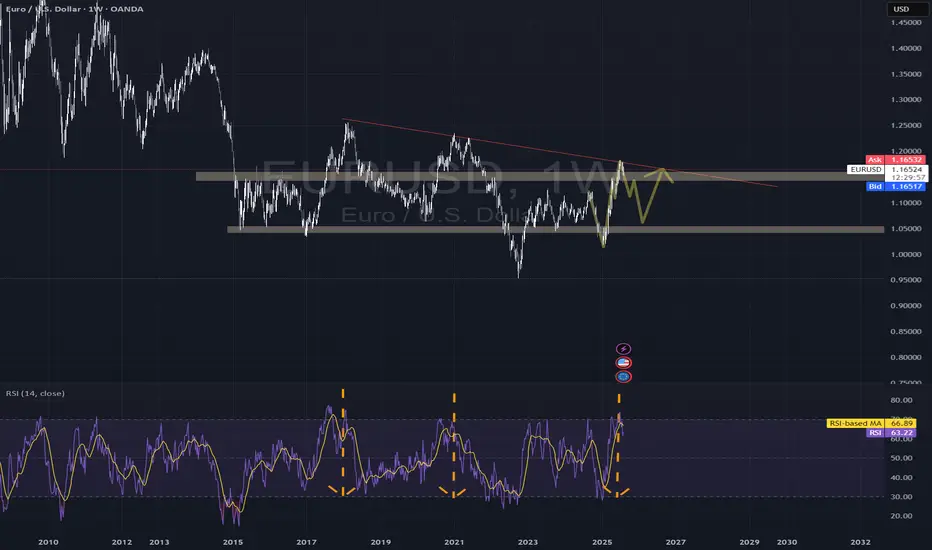
EUR/USD at Major Resistance Confluence – Rejection Ahead?EUR/USD – Key Decision Zone
The price is testing a major confluence between horizontal resistance (1.16–1.20) and a long-term descending trendline. The weekly RSI shows overbought conditions, similar to 2017, 2018, and 2021 — all followed by corrections. Likely scenario: a possible false breakout above resistance followed by rejection and consolidation. Price action in this zone will be crucial.
Technical Analysis Process: EUR/USD (Weekly Chart)
1. Descending Red Line (Trendline)
This line represents a long-term dynamic resistance.
It has been respected multiple times in the past, which increases its relevance.
The current price action is approaching this trendline again, suggesting a potential bearish reaction from sellers.
2. Static Resistance Zone (Upper Brown Rectangle)
Ranges approximately between 1.16 – 1.20.
Historically acted as both support and resistance, marking it as a strong horizontal level of confluence.
Now overlaps with the descending trendline, increasing its technical significance.
3. Major Support Zone (Lower Brown Rectangle)
Located around 1.03 – 1.05.
This is the area from which the price previously launched a strong upward movement, potentially marking a cyclical bottom.
Projected Scenario (Yellow Arrow)
Indicates a possible false breakout above the resistance area and trendline.
Suggests a structure of consolidation or distribution, where price may spike above key resistance but quickly retreat.
This could lead to a retracement back toward lower support, or act as a base before a real breakout develops.
RSI Indicator (Relative Strength Index)
Weekly RSI is currently in the overbought zone, near the 70 level.
The vertical dotted orange line aligns with previous RSI peaks (2017, 2018, 2021), each followed by major tops and corrections.
This pattern suggests that the market could again experience a local top and a retracement after this overbought signal.
Overall Interpretation
EUR/USD is currently at a critical technical zone, where:
A long-term trendline and a horizontal resistance intersect.
RSI signals a potential reversal point.
The most probable outcome (as indicated by the yellow arrow):
A short-lived breakout above resistance, followed by a bearish rejection and consolidation.
Alternatively, price could consolidate here before attempting a stronger breakout.
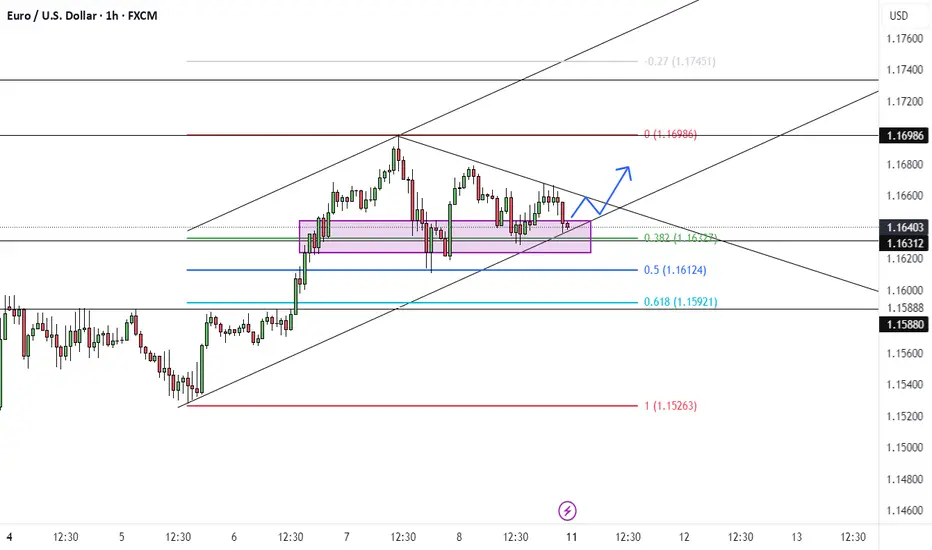
EURUSD: Local Bullish Bias! Long!
My dear friends,
Today we will analyse EURUSD together☺️
The price is near a wide key level
and the pair is approaching a significant decision level of 1.16045 Therefore, a strong bullish reaction here could determine the next move up.We will watch for a confirmation candle, and then target the next key level of 1.16229.Recommend Stop-loss is beyond the current level.
❤️Sending you lots of Love and Hugs❤️
