Fed speak - Not broken, not cutting “Don’t fix what isn’t broken” seems to be the Fed’s current stance. Two Fed officials made that clear over the last 24 hours.
Vice Chair for Supervision Michael Barr warned that tariffs could fuel inflation by lifting short-term expectations, triggering second-round effects, and making inflation more persistent.
New York Fed President John Williams echoed that view, noting that tariff-driven inflation is “likely to get stronger in the months ahead.” He also called policy “well positioned” and said the Fed needs more data before making any move.
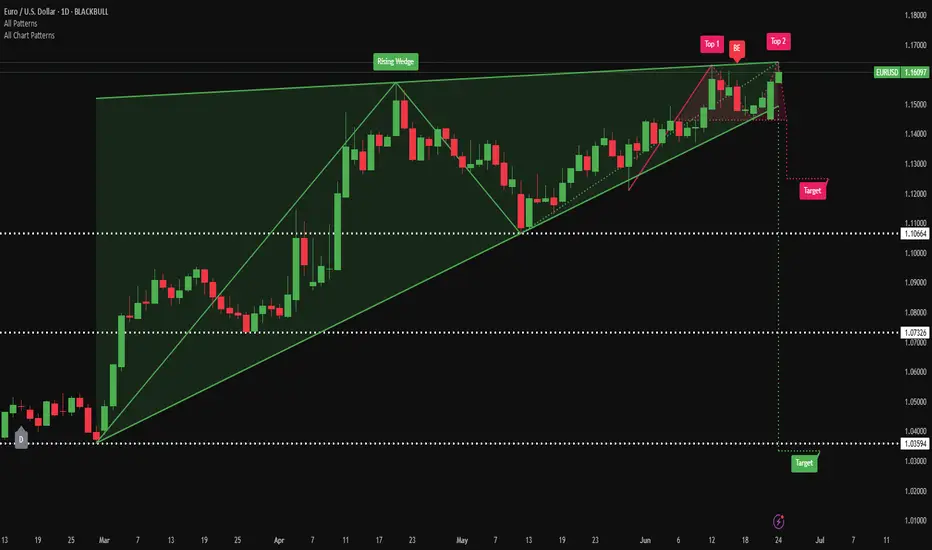
EUR/USD has formed a rising wedge pattern on the daily chart—typically a bearish structure that warns of a potential reversal. Price action has narrowed, building two clear tops. The downside target from the wedge could potentially be 1.1066 initially, and possibly down to 1.0732 if bearish momentum accelerates.
EURUSD trade ideas
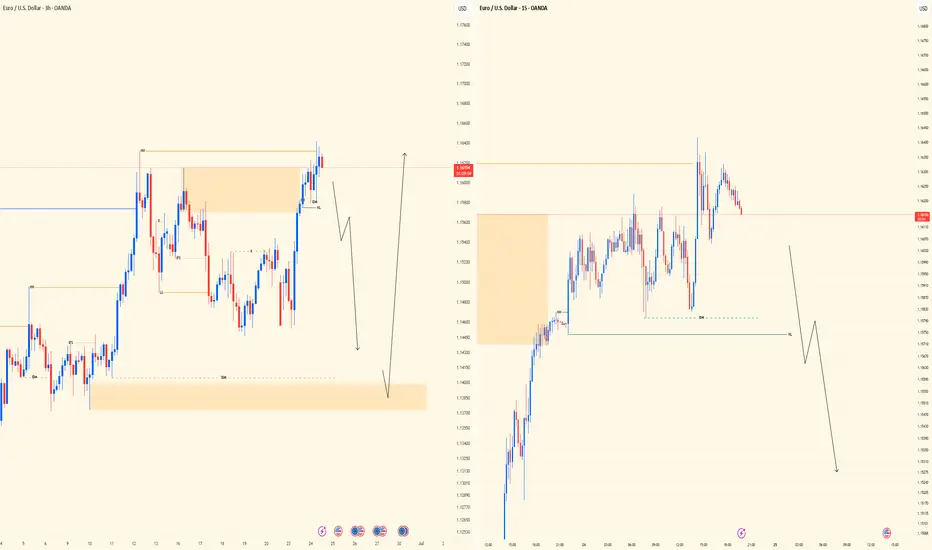
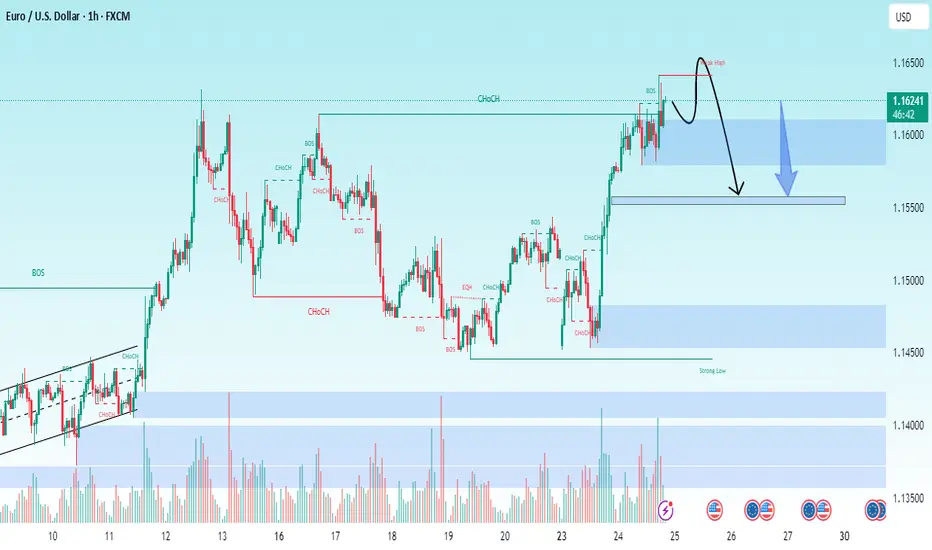
EURUSD Midweek Outlook | 3H - 15M Dual ViewLeft side chart shows the 3H Bird’s Eye structure — price swept the recent highs but failed to follow through, signaling external bull weakness. That shift in narrative tells me price may be prepping to drop, potentially targeting the SSL below before gathering fuel to attack major highs.
Right side zooms in on the 15M — I’m patiently watching for a clean lower high to break (CHoCH) followed by a pullback to confirm a sell entry. Until I get that proper LTF trigger, I stay on the sidelines. Execution always follows alignment.
Bias: Short
HTF Structure: 3H sweep of highs, showing weakness
LTF View: Waiting for 15M confirmation (break + retest)
Target: SSL below
Mindset Note: Trade what’s shown, not what’s felt. Stay sharp, stay patient.
Bless Trading!
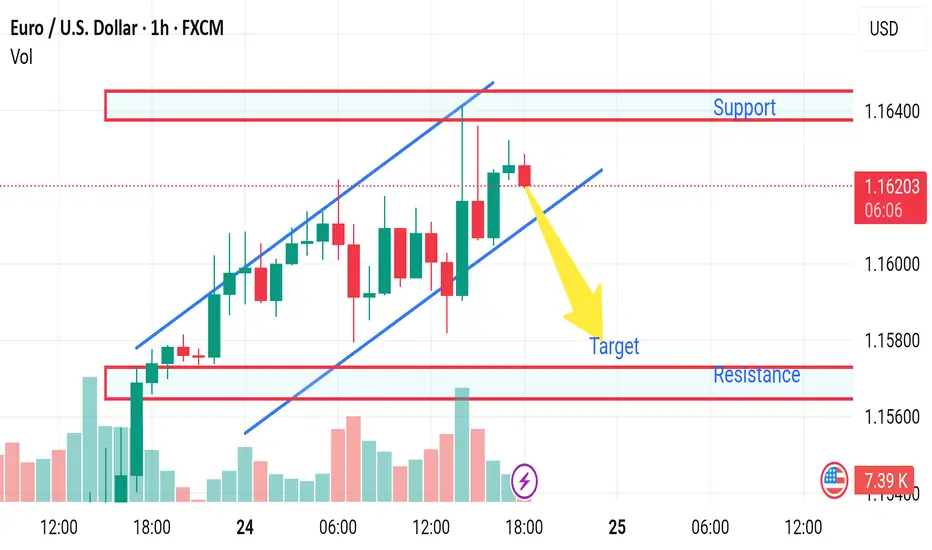
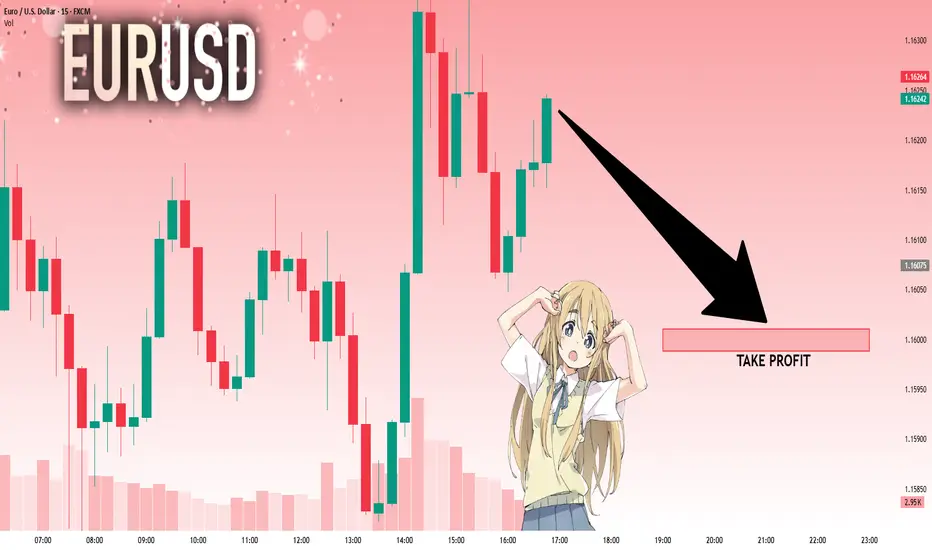
Market next target 🔁 Disrupted Analysis (Bullish Scenario Instead of Bearish)
1. Price in an Upward Channel:
The price remains within a clear ascending channel, respecting both upper and lower bounds.
The bearish arrow prematurely predicts a breakdown while no support break has occurred.
2. Strong Bullish Momentum:
Price is making higher highs and higher lows, a textbook bullish structure.
The recent dip respected the lower trendline and was followed by strong green candles.
3. Volume Confirmation:
Notice the increasing bullish volume on the recent push higher.
That suggests buyers are still in control, contradicting the bearish prediction.
4. Invalidation of Bearish Breakdown:
Until the lower blue trendline is clearly broken with volume, the bearish target is speculative.
Support is holding at 1.1610–1.1600 zone, which may become a launchpad for further gains.
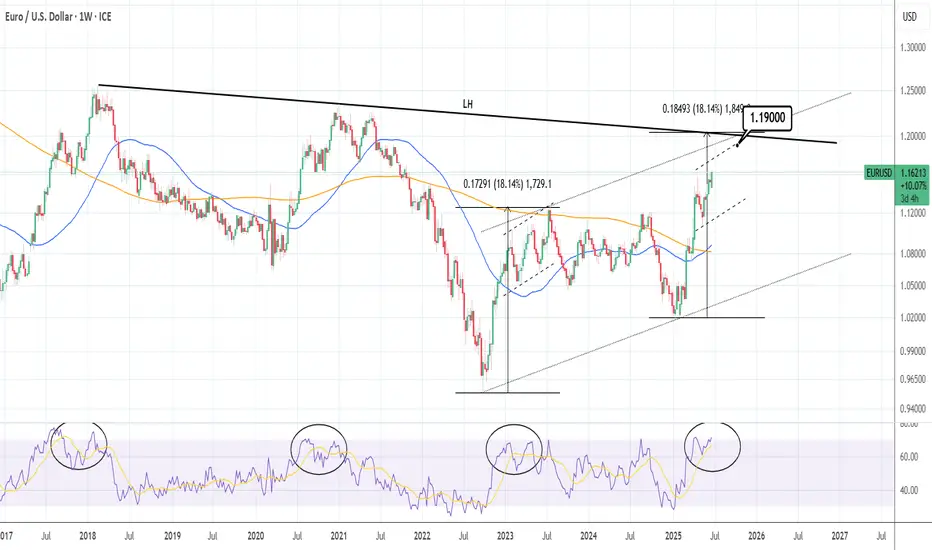
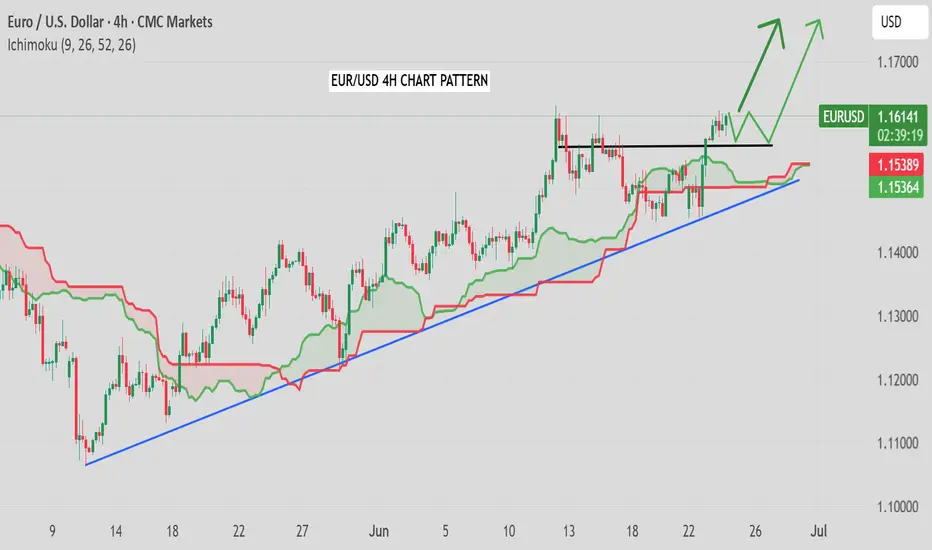
EURUSD: Can it reach 1.1900?EURUSD is bullish on its 1D technical outlook (RSI = 65.234, MACD = 0.006, ADX = 20.419) and is going for a 3 week high. This is technically a long term bullish wave (since the January 13th 2025 low) on the 3 year Channel Up. We anticipate that this wave will go for the pattern's high by the end of the year, and being limited by the 7 year LH trendline, we expect to aim for at least 1.1900. The 1W RSI has started to post a sequence that resembles the last 3 major ones.
## If you like our free content follow our profile to get more daily ideas. ##
## Comments and likes are greatly appreciated. ##
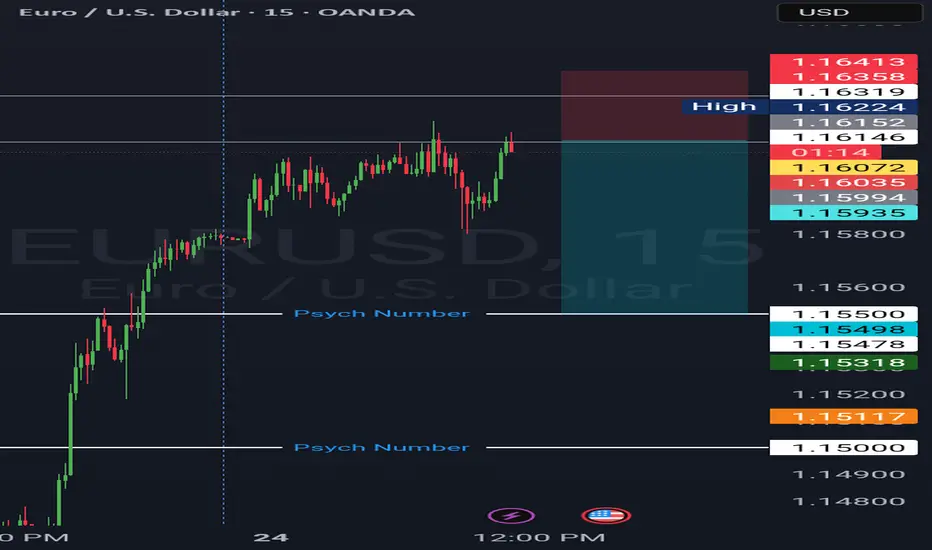
Euro Prices Falling TodayThe EURUSD has broken to a new high for the month and the year.
The price extended above highs from June between 1.1614 to 1.16297. The high price extended to 1.1641 so far. That represents the highest levels going back to October 2021. With the break, the next key target area comes between 1.1663 and 1.16916. That area corresponds with swing lows and swing highs going back to April 2021 through November 2021 before the pair started a trend-like move to the lows reached in September 2022.
EURUSD: Bears Are Winning! Short!
My dear friends,
Today we will analyse EURUSD together☺️
The in-trend continuation seems likely as the current long-term trend appears to be strong, and price is holding below a key level of 1.16242 So a bearish continuation seems plausible, targeting the next low. We should enter on confirmation, and place a stop-loss beyond the recent swing level.
❤️Sending you lots of Love and Hugs❤️
EUR/USD Ready to Explode or Collapse? All Eyes on June 26 🔺 Gann Trend Analysis
The red upward sloping line is a long-term Gann trendline connecting major swing lows since late May.
According to Gann principles, trendlines from major pivots are often tested again before a major reversal.
The annotation “a trend should be tested again” aligns with the Gann philosophy: after price rallies away, it often returns to test the base trendline.
The cluster of vertical blue time cycle lines (June 26) implies an important Gann time window, potentially a reversal point.
📐 Channel & Price Structure
A small ascending wedge/channel is drawn in red, signaling rising but weakening momentum.
Price is now approaching key resistance zones marked in yellow and green (1.1640, 1.1650, 1.1660, 1.1683).
These resistance zones suggest potential exhaustion, making the upper boundary of the channel a sell zone.
🔻 Bearish Scenario & Projections
Blue arrows indicate the expected bearish path after hitting resistance.
The reversal target is the Gann trendline retest zone around 1.1500–1.1520.
A break below this Gann trendline could trigger deeper drops in alignment with time-based cycles.
⚠️ Conclusion
This setup implies:
Bearish divergence between price action and time cycles.
Resistance clusters = likely reversal point.
Retest of the long-term Gann trendline is highly probable.

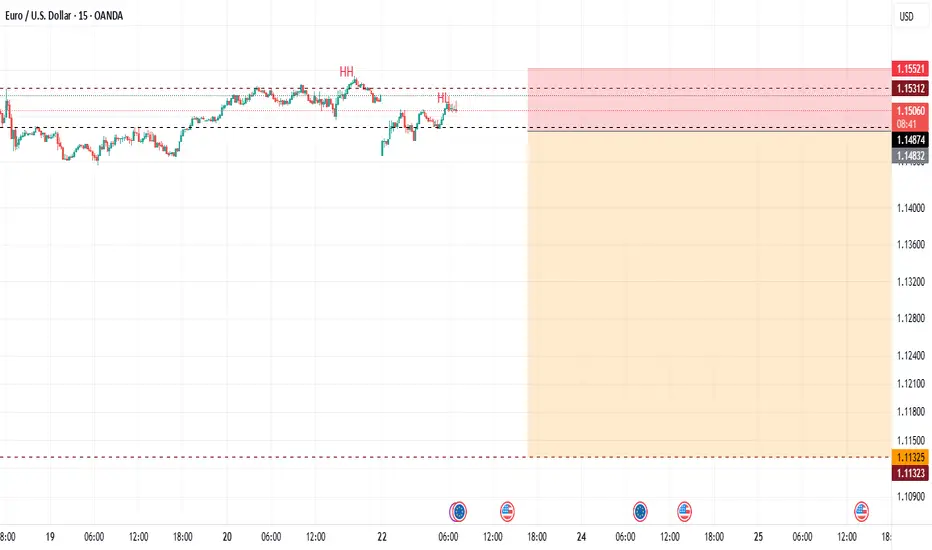
EURUSD 15M READY FOR CRASH TO 1.113???At the moment the price action show BEARISH SIGN (MAKING HH/HL) and trade below SUPPORT turn RESISTANCE @ around 1.1542
Market open with the GAP DOWN today, which as you can see we already fill it
One can go in @ the GAP (AGGRESIVE ENTRY)
Or wait till 1.4874 SUPPORT taken away (MUCH SAFER ENTRY)
All and all im very BEARISH WITH EURUSD THIS WEEK
All the best trader
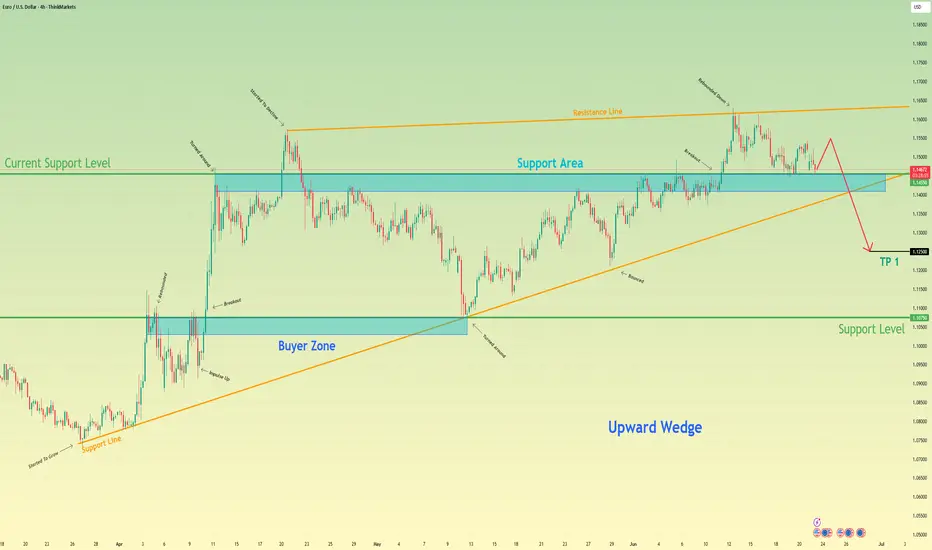
Euro can drop from wedge, breaking support levelHello traders, I want share with you my opinion about Euro. The price previously started a confident upward movement, breaking out from the buyer zone around 1.1075 and forming an upward wedge pattern. As the trend continued, EUR pushed through the support area and traded inside the wedge, showing multiple bounces from the support line. Eventually, the pair reached the resistance line at the top of the wedge and then reversed. After a short correction, it tried to rebound again but failed to create a new high. The market then pulled back into the support area 1.1455 - 1.1410 and is now testing that level once more. Currently, the Euro is trading just above the support area, and we may see a short-term rebound from here. However, given the overall structure, I expect the price to break the support level and exit the wedge pattern to the downside. In my opinion, this breakout will initiate a strong bearish wave, targeting the 1.1250 points, which is where I’ve set my TP 1. Given the pattern structure, recent lower highs, and the weakening bullish momentum, I remain bearish and anticipate further decline once support is broken. Please share this idea with your friends and click Boost 🚀
Disclaimer: As part of ThinkMarkets’ Influencer Program, I am sponsored to share and publish their charts in my analysis.
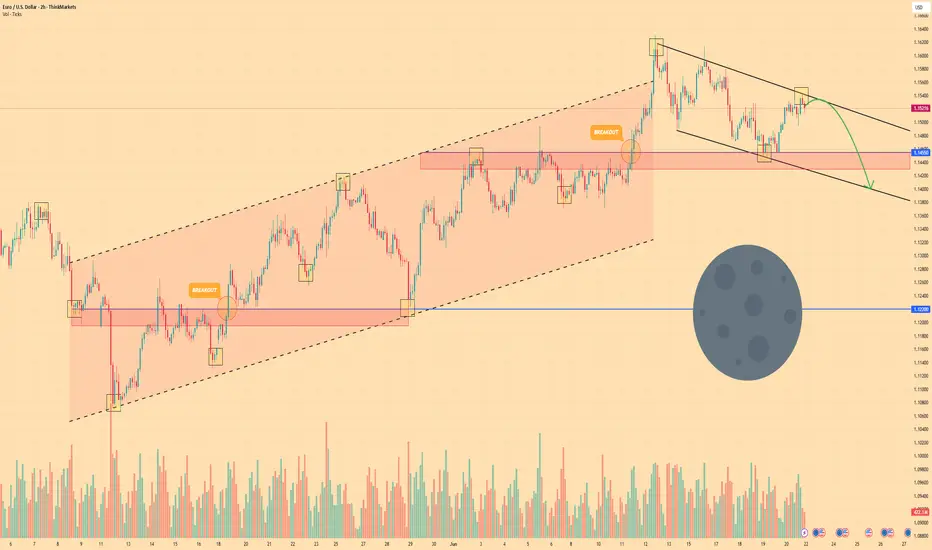
EURO - Price can continue to decline inside wedge patternHi guys, this is my overview for EURUSD, feel free to check it and write your feedback in comments👊
Some days ago, price tried to grow, but failed and dropped below $1.1220 support level, after which started to grow in channel.
In rising channel, price broke $1.1220 level one more time and then rose to resistance line and then corrected.
Next, Euro rose to $1.1455 level and some time traded inside this level, until it broke it and continued to move up.
Price exited from rising channel and later started to decline inside wedge pattern, where it declined to $1.1455 level.
Recently, price bounced from this level and in a short time rose to resistance line of wedge pattern.
In my mind, Euro can continue to decline to $1.1400 support line of wedge, breaking support level.
If this post is useful to you, you can support me with like/boost and advice in comments❤️
Disclaimer: As part of ThinkMarkets’ Influencer Program, I am sponsored to share and publish their charts in my analysis.
EUR/USD 4H CHART IDEA"EUR/USD is currently trading within a key price range, showing signs of consolidation after recent volatility. The pair is testing support near the 1.0700 level while facing resistance around 1.0800. A breakout from this zone could set the tone for the next directional move. Traders should monitor upcoming economic data from the Eurozone and the US, as it may trigger strong momentum either way. The trend remains neutral in the short term, awaiting a clear confirmation."
This is just an idea not financial advice.
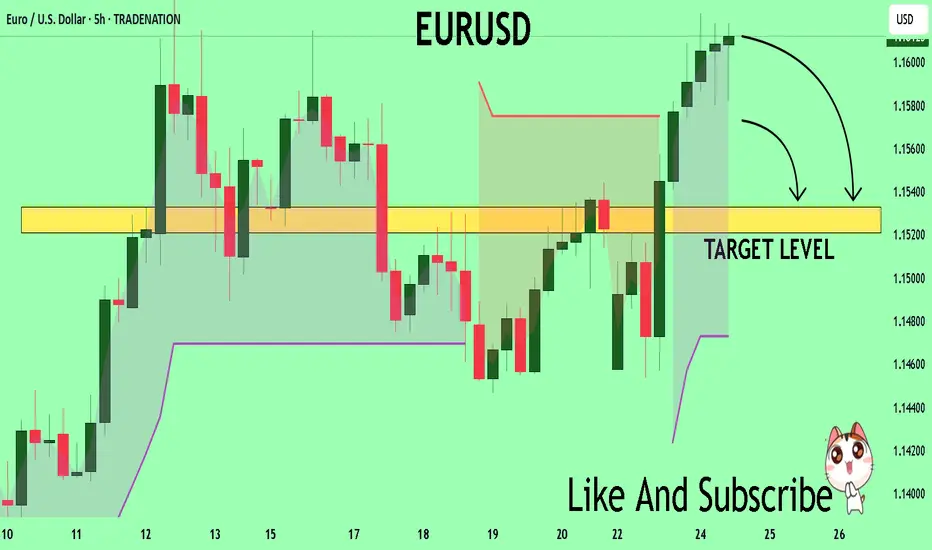
EURUSD A Fall Expected! SELL!
My dear friends,
Please, find my technical outlook for EURUSD below:
The price is coiling around a solid key level - 1.1609
Bias - Bearish
Technical Indicators: Pivot Points Low anticipates a potential price reversal.
Super trend shows a clear sell, giving a perfect indicators' convergence.
Goal - 1.1532
About Used Indicators:
The pivot point itself is simply the average of the high, low and closing prices from the previous trading day.
Disclosure: I am part of Trade Nation's Influencer program and receive a monthly fee for using their TradingView charts in my analysis.
———————————
WISH YOU ALL LUCK
EURUSD ShortLive Analysis – EURUSD
Market Structure: Price has tapped into the Daily Market Structure zone.
Price Action: Current structure and price action suggest a potential reversal is in play.
Strategy: This is a Structure-to-Structure trade setup.
Targets:
Lower liquidity pools beneath current price
Main Target: Weekly structured liquidity resting at the dotted line

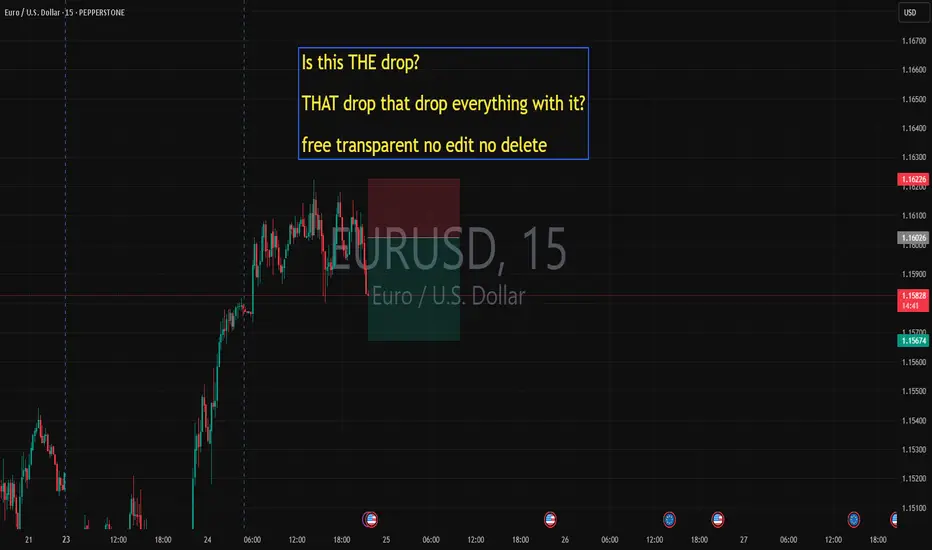
Is this THE drop? THAT drop that drop everything with it? Is this THE drop?
THAT drop that drop everything with it?
free transparent no edit no delete
the biggest yugest drop of the century????
let us know!
free transparent no edit no delete
🐉We value full transparency. All wins and fails fully publicized, zero edit, zero delete, zero fakes.🐉
🐉Check out our socials for some nice insights.🐉
information created and published doesn't constitute investment advice!
NOT financial advice
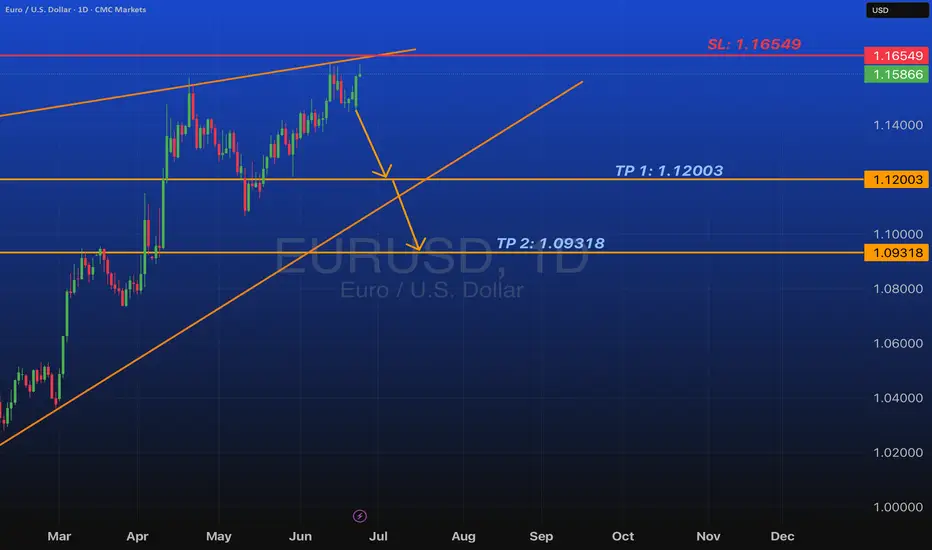
EURUSD Short Part IIEURUSD Analysis
On EURUSD daily chart from CMC Markets quota, indicates a bullish trend with a symmetrical triangle pattern forming. The price has recently broken above a key resistance level, suggesting potential for continued upward movement.
Key Price Levels
Current Price: 1.16932
Stop Loss (SL): 1.16549
Take Profit 1 (TP1): 1.12003
Take Profit 2 (TP2): 1.09318
Trend Analysis
EURUSD shows clear signs on an ascending trend supported by higher lows and higher highs since early 2025. Both orange trend-lines which I created form a symmetrical triangle, with the price nearing the apex, hinting at a potential breakout or reversal which I have been looking for a reversal bearish breakout.
The upward momentum is strong, but the proximity to the upper trend-line and set take-profit levels indicates preparation for a possible correction. I still believe in shorts on EURUSD.
Conclusion
Traders and investors should monitor the price action near the triangle apex for breakout confirmation. The set stop loss and take-profit levels provide a structured approach to managing the trade, balancing potential gains with risk mitigation. Stay tuned for more updates on the trade.
EURUSD Sell/ShortFundamental Analysis
EURUSD rates is being influenced by the current Eurozone's economic performance, driven by key economies like Germany and France, continues to be shaped by industrial output, consumer confidence, and inflation trends. The European Central Bank (ECB) has likely maintained a cautious monetary policy, with interest rates possibly held steady or adjusted slightly to combat inflation while supporting growth. On the U.S. side, the Federal Reserve's stance on interest rates, potentially in a tightening phase to address persistent inflation plays a critical role. Recent U.S. economic data, including GDP growth, employment figures, and consumer spending, may indicate a robust dollar, putting downward pressure on EURUSD. Additionally, geopolitical tensions, energy prices (affecting Eurozone energy imports), and trade balances between the U.S. and EU are likely contributing to volatility. Given the current date, recent ECB and Fed statements or data releases for June 2025 inflation reports.
Technical Analysis:
Based on the provided EURUSD 1D chart (covering mid-2024 to mid-2025), the following technical observations can be made:
Trend and Moving Averages:
For EURUSD it shows a descending trend from a peak around 1.48 in mid-2024, with a potential reversal or consolidation forming in mid-2025. The 50-day and 200-day moving averages (depicted as orange lines) are sloping downward, with the price recently testing these levels around 1.12-1.13. A break above the shorter-term moving average could signal bullish momentum, while a failure to hold might confirm a continuation of the downtrend. Looking for key support levels here are identified at 1.09318 (TP 2) and 1.08000, with the current price hovering near 1.12003 (TP 1). Resistance is notable at 1.15625 (SL) and the previous high near 1.4800. The price action suggests a potential bounce from the recent low, with the next target being the resistance zone around 1.15625 if bullish momentum persists. Candlesticks and volume patterns are showing a recent green candlesticks indicate buying pressure, potentially forming a reversal pattern near the 1.12 level. Volume analysis would confirm the strength of this move, with higher volume on upticks supporting a breakout.
Overall Bias:
The technical setup suggests a short-term bullish correction within a broader bearish trend, contingent on breaking and holding above 1.15625. A drop below 1.09318 would invalidate the bullish case and resume the downtrend toward 1.08000 or lower.
Sentiment Analysis
Market sentiment as of June 2025 likely reflects heightened interest in EUR/USD due to recent economic data and central bank policies. Traders and analysts are closely watching for signs of ECB rate cuts or Fed rate hikes, which could sway the pair. On social platforms and financial forums, there may be a mix of caution and optimism looking out for caution due to the Eurozone's economic challenges (energy costs, political uncertainty), and optimism if U.S. data softens, weakening the dollar. The chart's visibility on trading platforms suggests retail and institutional traders are actively monitoring this pair, with a focus on the 1.12-1.16 range as a critical decision point. Sentiment could shift rapidly based on upcoming economic releases or geopolitical developments.
Conclusion
The EUR/USD pair is at a pivotal juncture, with fundamentals pointing to a stronger USD due to Fed policy, while from a technical standpoint suggest a short-term bounce toward 1.15625 if support at 1.12003 holds. Sentiment indicates active trader interest, with eyes on central bank moves. A break above resistance could target 1.4800 (long-term), while a failure might see a decline to 1.08000. Monitor upcoming data for confirmation.

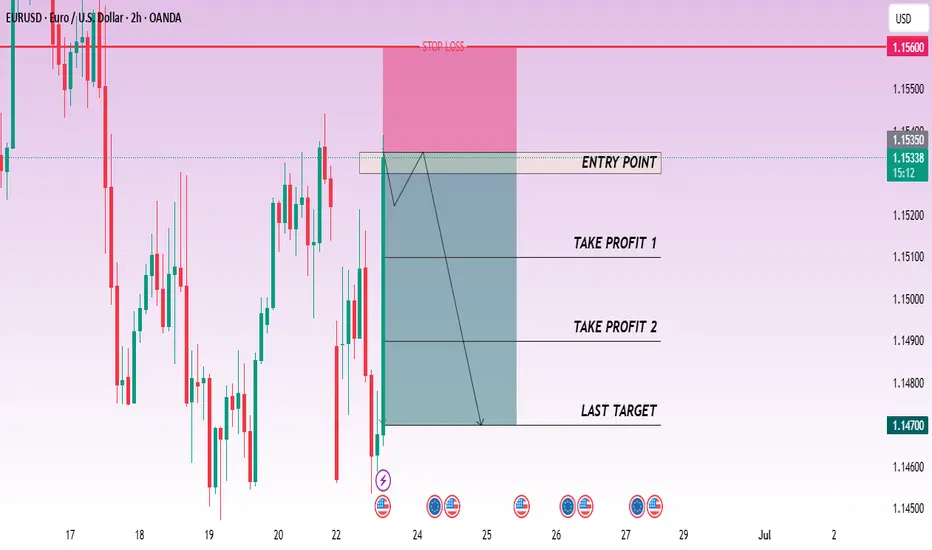
CHECK EURUSD SIGNAL READ CAPTAINeurusd sell now ✅
entry point (1.15350) (1.15300)
TAKE PROFIT 1: (1.15100)
TAKE PROFIT 2: (1.14900)
LAST TARGET(1.14700)
STOP LOSS (1.15600)
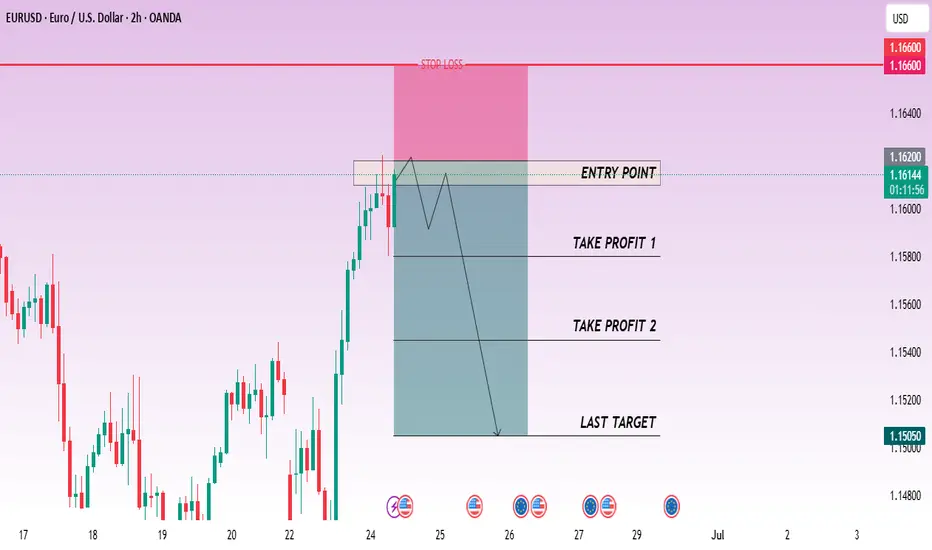
CHECK EURUSD SIGNAL READ CAPTAINeurusd sell now ✅
entry point (1.16200) (1.16100)
TAKE PROFIT 1: (1.15800)
TAKE PROFIT 2: (1.15450)
LAST TARGET(1.15050)
STOP LOSS (1.16600)
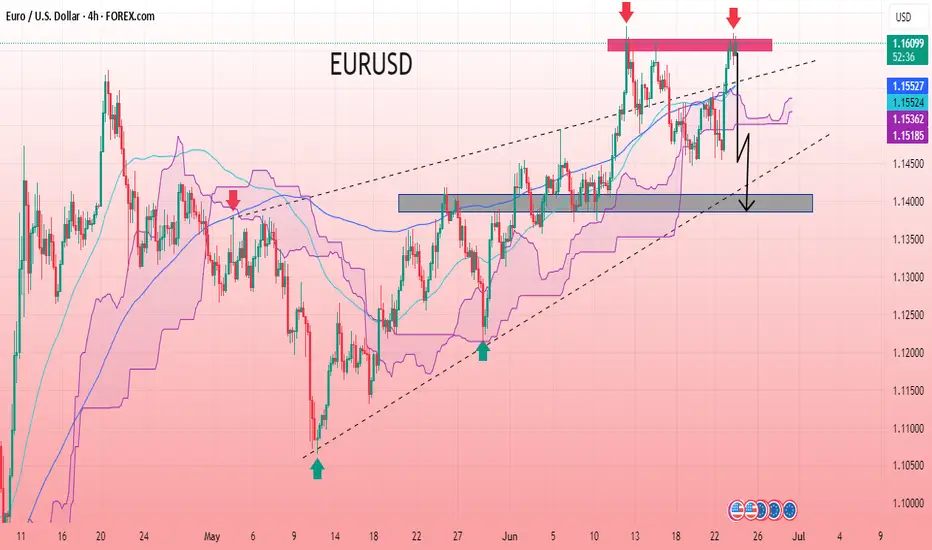
EUR/USD 4H CHART PATTERNThe EUR/USD 4-hour chart signals a bearish reversal after forming a double top near a strong resistance zone. Price was rejected twice from the same level, indicating exhaustion in bullish momentum. The chart also shows a potential breakdown from the rising channel, suggesting a trend shift. The Ichimoku cloud is starting to flatten, hinting at weakening upward pressure. A key support zone below is now in focus, and a break below that level could trigger further selling pressure. Overall, the structure favours a bearish outlook with clean downside targets if the current support fails to hold.
Entry Point: 1.16100
First Target Point: 1.14500
Second Target Point: 1.13880
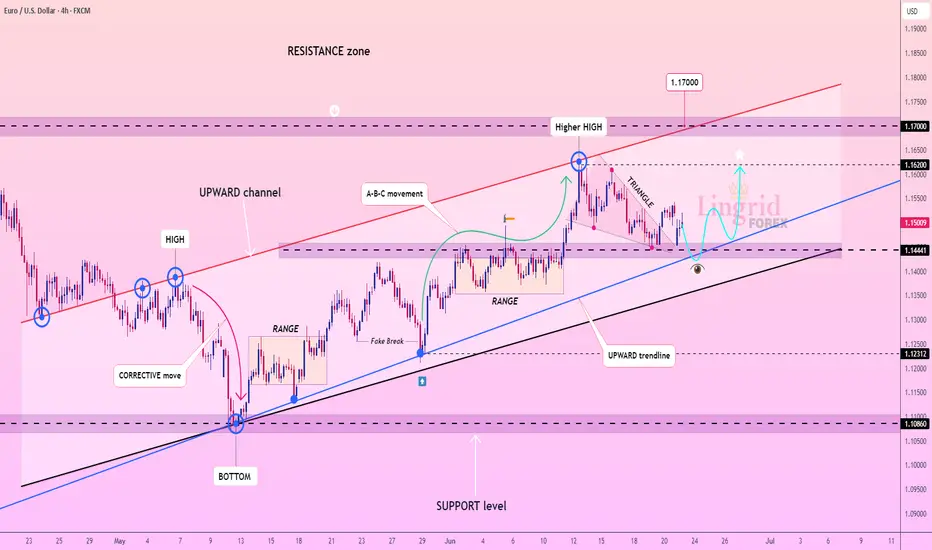
Lingrid | EURUSD Pullback - Awaiting Trend Continuation SignalFX:EURUSD is consolidating above the upward trendline after forming a triangle within the broader ascending channel. The recent pullback tested the 1.1444 support zone, with a rebound hinting at renewed bullish pressure. A push beyond 1.1620 could unlock upside toward the 1.1700 resistance mark.
📈 Key Levels
Buy zone: 1.1444–1.1470
Sell trigger: breakdown below 1.1444
Target: 1.16200
Buy trigger: breakout above 1.1523 resistance
💡 Risks
Triangle breakdown could shift the short-term bias bearish
Failure to reclaim 1.1620 may stall bullish momentum
A sharp drop below the black trendline would invalidate the structure
If this idea resonates with you or you have your own opinion, traders, hit the comments. I’m excited to read your thoughts!
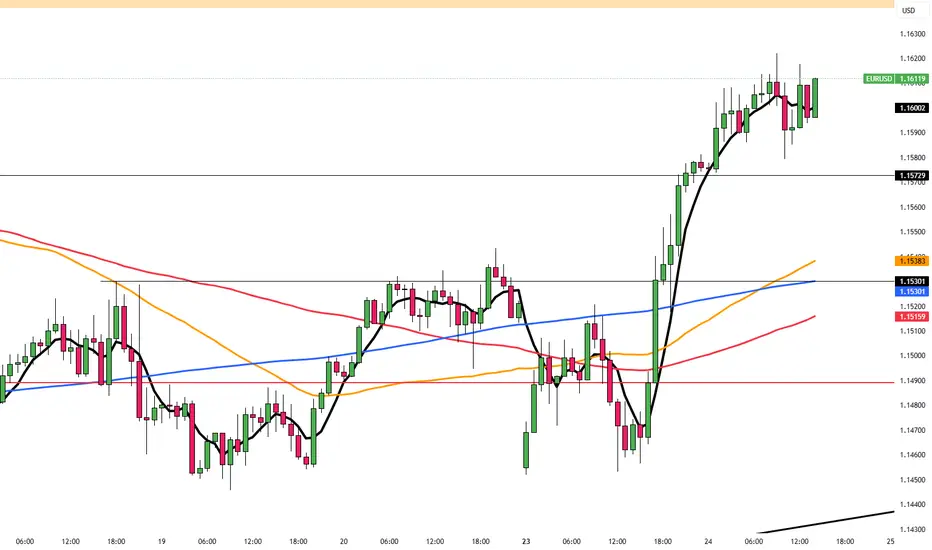
EUR/USD Hits Weekly High as Ceasefire Weakens DollarEUR/USD climbed to a fresh weekly high near 1.1610 during late Asian trading on Tuesday, boosted by a sharp sell-off in the US Dollar following the announcement of a ceasefire between Israel and Iran by President Donald Trump. The truce improved market risk appetite and dampened demand for traditional safe havens like the US Dollar. As a result, the US Dollar Index (DXY) dropped steeply from Monday’s two-week high of 99.42 to around 98.10.
The dollar also came under pressure from shifting expectations around Fed policy. On Monday, Fed Governor Michelle Bowman signaled support for a potential rate cut as early as the July meeting, citing rising concerns over the labor market. “We should put more weight on downside risks to the job market,” she stated, adding that it's time to consider adjusting the policy rate.
Her dovish tone nudged up expectations for a July rate cut, with CME FedWatch data showing the probability rising from 14.5% on Friday to 22.7%.
In the Eurozone, ECB officials expressed concerns over the region’s economic outlook, particularly considering new US tariff policies. President Christine Lagarde, in remarks to the European Parliament, warned that inflation staying near the 2% target is uncertain and noted that survey data points to “some weaker prospects for economic activity in the near term.” She added that risks to growth remain “tilted to the downside.”
Resistance is located at 1.1630, while support is seen at 1.1530.
EURUSD - Shifting from Bearish to Bullish Soon!Hello TradingView Family / Fellow Traders. This is Richard, also known as theSignalyst.
📈EURUSD has been overall bullish trading within the rising wedge marked in blue.
Moreover, the orange zone is a strong support!
🏹 Thus, the highlighted blue circle is a strong area to look for buy setups as it is the intersection of support and lower blue trendline acting as a non-horizontal support.
📚 As per my trading style:
As #EURUSD approaches the blue circle zone, I will be looking for bullish reversal setups (like a double bottom pattern, trendline break , and so on...)
📚 Always follow your trading plan regarding entry, risk management, and trade management.
Good luck!
All Strategies Are Good; If Managed Properly!
~Rich
Disclosure: I am part of Trade Nation's Influencer program and receive a monthly fee for using their TradingView charts in my analysis.

EURUSD SELL expectancy EURUSD approaching a resistance zone and order block which I expect it to sell from that zone to the downside