Major U.S. News Ahead—Will EURUSD Pivot?Good morning, my friends 👋
Here’s my EURUSD market analysis 📉
Currently, the pair is in a downtrend. I expect this downward move to end around 1.14899 or 1.14536, where a potential buying opportunity may emerge. I personally plan to enter a buy position once price reaches those zones 💼
Also, keep an eye on major U.S. economic reports being released today—they could trigger increased volatility 🔔
Every like you send is a huge source of motivation for me to keep sharing high-quality analysis 🙏 Thanks to everyone supporting the channel 💙
EURUSD trade ideas
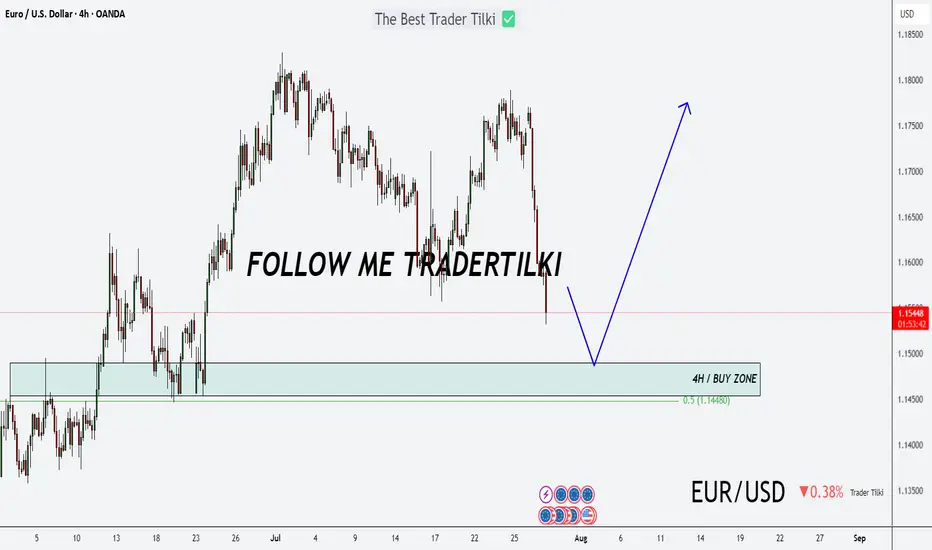
EURUSD trading range. Top-bottom trading strategy✏️ OANDA:EURUSD surged after Nonfarm data. Formed a wide trading range bounded by 2 trendlines. The market needs more momentum to break out of the range. If there is confirmation at the upper and lower bands, it is a top-bottom trading signal for this pair.
📉 Key Levels
SELL trigger: reject resistance 1.175
BUY trigger: reject support 1.145
Leave your comments on the idea. I am happy to read your views.

Going higherThis is creating a high-tight flag after a bounce on macro news. Going much higher. It won’t be a sudden jump, but with lack of red letter news for the next couple days around this pair, the trend should be consistent with the data. Go long this pair!!!!

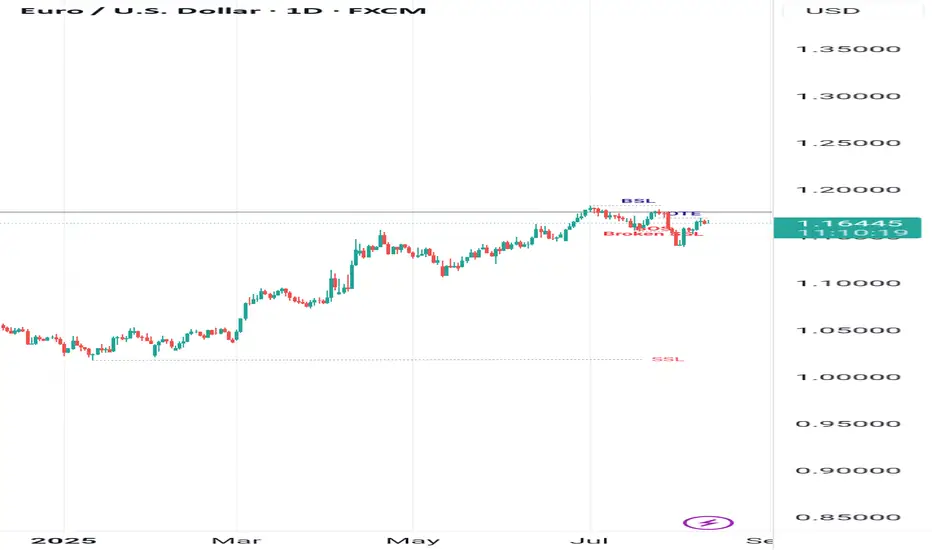
A sell on EURUSD #EURUSD has shown that the liquidity laws still works. While it may seem as a bullish market, it is actually a liquidity grab which serves as weekly FVG and bearish OB, also bearish OTE. Don't get trapped in buys.
ASX:EUR will sell this week.
@SAForexedu We learn to earn.
EURUSD... This is it ?Almost recovered large part of the fall. Is this the start of a down trend market ?
What does macro say ? This is blurry as EU Zone as US Zone is....
I guess that BCE will start dovish, and Fed hawkish...
Usando cuenta Real (journal)August 4, I already have a real account, but I haven't used it for fear of losing...
Yes, I have used the demo account, and so far, things are going well. Obviously, it's a demo account, so it's not that scary.
On July 21, I started using the demo account as a real one and applied the 5 or 3 rule: (5) win, 0 (3) lose, whichever comes first. And that's the trade of the day, no matter what.
I started with 10, raised it to 38, but now it's at 28.
Today I didn't enter, and yesterday I went from -3 and +3.
I'm using MA (EMA 50), MA (SMA 3) on the chart, and in addition, Stoch Oscillator (5, 3, 3), RSI (7).
And I always use EURUSD OTC in 1 minute, trading at $1 per trade to start.

EURUSD 1D MA100 bounce targets 1.8750 at least.The EURUSD pair has been trading within a 4-month Channel Up and recently priced its latest Higher Low (pattern's bottom).
That happened to take place just above the 1D MA100 (green trend-line), giving a strong medium-term buy signal. As long as it holds, we expect the emerging Bullish Leg to target at least 1.18750 (the 1.1 Fibonacci extension) and in continuation 1.19700 (+5.11% from the bottom), both based on the previous Bullish Leg.
Notice also that the 1D MACD is forming its first Bullish Cross since May 26, a very strong additional buy signal.
-------------------------------------------------------------------------------
** Please LIKE 👍, FOLLOW ✅, SHARE 🙌 and COMMENT ✍ if you enjoy this idea! Also share your ideas and charts in the comments section below! This is best way to keep it relevant, support us, keep the content here free and allow the idea to reach as many people as possible. **
-------------------------------------------------------------------------------
Disclosure: I am part of Trade Nation's Influencer program and receive a monthly fee for using their TradingView charts in my analysis.
💸💸💸💸💸💸
👇 👇 👇 👇 👇 👇

Forex Market Structure and Factors Affecting ItForex Market Structure and Factors Affecting It
The forex market, a vast and dynamic financial arena, operates uniquely as a decentralised over-the-counter network. This article delves into its intricate structure, exploring the roles of various participants and the influence of technology. Understanding these elements is essential for anyone looking to navigate and succeed in the world of forex trading.
Understanding Market Structure in Forex
The structure of the foreign exchange market, commonly known as the forex market, is uniquely decentralised and operates over-the-counter (OTC). Unlike traditional markets with a central exchange, forex is a vast network of dealers, brokers, and financial institutions globally. This setup allows for 24-hour trading five days a week, accommodating various time zones and providing constant access to market participants.
Each participant plays a pivotal role in shaping the basic market structure of forex, with banks and financial institutions primarily acting as market makers, providing liquidity and setting prices for retail traders and brokers. This complex web of interactions and the decentralised nature of the market ensure constant movement in currency values, offering numerous opportunities for trading and speculation.
Participants in the Forex Market
In the diverse landscape of forex trading, the structure is made up of a range of participants. Each group influences the market's dynamics in unique ways:
- Central Banks and Governments: They regulate monetary policies and currency supply, impacting prices. For example, the US Federal Reserve significantly influences the value of the US dollar.
- Commercial Banks: As intermediaries, they facilitate transactions and engage in speculative trading, contributing to liquidity.
- Multinational Corporations: Involved in cross-border transactions, these entities engage in trading to manage currency risks.
- Retail Traders: Individual traders speculate on currency movements using online platforms, forming a significant market portion.
- Institutional Traders: Entities like hedge funds and asset management firms, which trade with sophisticated strategies and considerable resources.
Market Tiers and Interactions
The forex market's structure is defined by distinct tiers and interactions among its participants. Each tier plays a unique role:
- Tier 1: Major Players - This top tier includes large banks, financial institutions, and central banks. They have the most significant impact on market dynamics, often setting trends and liquidity standards.
- Tier 2: Intermediaries - Comprising smaller banks and financial firms, they serve as intermediaries, facilitating transactions and linking Tier 1 entities with smaller participants.
- Tier 3: Retail Market - At this level are individual investors, small businesses, and retail traders. They interact with the market primarily through brokers and online platforms, influenced heavily by the actions of the upper tiers.
These tiers illustrate the varied types of market structure in forex, reflecting the complexity and diversity of trading interactions.
Central Bank's Role in Market Structure
Central banks play a pivotal role in shaping the advanced market structure in forex. They influence the market through several key mechanisms:
- Monetary Policy: Central banks determine monetary policy, which directly influences interest rates. This, in turn, affects the attractiveness of a country's currency, thereby impacting forex rates and market dynamics.
- Market Stabilisation: In times of volatility, central banks can intervene in currency markets to stabilise currencies. Interventions involve buying or selling their own currency to influence exchange rates, directly affecting market structure.
- Regulatory Oversight: Central banks often have a regulatory role, overseeing banking and financial systems. Their regulations can influence accessibility, liquidity, and transparency, which are critical for a well-functioning forex market.
- Economic Signalling: Central banks release economic data and policy decisions that serve as key indicators for traders. This information can lead to anticipatory moves in the markets, shaping prices based on perceived economic strength or weakness.
- Foreign Exchange Reserves Management: Central banks manage significant foreign exchange reserves. Their strategies in managing these reserves, including decisions on when and how much to buy or sell, have a substantial impact on forex liquidity.
Technology’s Impact on Market Structure
Technological advancements have significantly reshaped the market structure in forex, introducing new dynamics and efficiencies. Electronic trading platforms, like electronic communication networks (ECNs), have revolutionised access to the forex market. Before these platforms, trades were often executed via traditional methods like phone calls.
Algorithmic trading uses computer programs for automatic trade execution, enabling fast, consistent transactions. High-frequency trading (HFT), a subset of algorithmic trading, executes thousands of trades per second, enhancing liquidity and reducing transaction costs but also raising concerns about market stability.
Furthermore, big data and analytics allow traders to analyse large datasets for price trends, refining their strategies. Mobile trading has democratised access, enabling trading from virtually anywhere, which has increased competition among brokers and accessibility for retail traders. These technological developments have increased efficiency and accessibility, contributing to a more interconnected and dynamic market.
The Bottom Line
Understanding the forex market structure is crucial for successful trading. This decentralised OTC network thrives on the interactions among various participants, influenced by central banks' policies and technological advancements. As traders navigate this dynamic environment, the right tools and knowledge are key.
This article represents the opinion of the Companies operating under the FXOpen brand only. It is not to be construed as an offer, solicitation, or recommendation with respect to products and services provided by the Companies operating under the FXOpen brand, nor is it to be considered financial advice.

EUR/USD Rises 2.3% Since the Beginning of AugustEUR/USD Rises 2.3% Since the Beginning of August
As the EUR/USD chart shows today, the euro has strengthened against the US dollar, climbing above the 1.1670 level, compared to the 1.1400 area at the beginning of the month.
Why Is EUR/USD Rising?
According to Reuters, the US dollar's weakness is being driven by:
→ Expectations of a Federal Reserve rate cut, which intensified following last week's disappointing US labour market data.
→ Anticipation of the upcoming US inflation report, scheduled for release on 12 August at 15:30 GMT+3.
On the other hand, the euro is being supported by growing optimism around a possible resolution of the military conflict in Ukraine, as well as the potential meeting between Donald Trump and Vladimir Putin.
Technical Analysis of the EUR/USD Chart
On 30 July, we noted that after hitting its July low, EUR/USD could stage a recovery — which indeed materialised. But does the chart now look bullish?
A definitive bullish outlook is hindered by the sequence of lower highs and lower lows (A-B-C-D), which continues to form a bearish market structure.
At the same time, the descending channel on the EUR/USD chart has become more pronounced. After a brief period of consolidation near the channel’s median line (marked with a circle), the price moved up towards the upper boundary of the channel. It is worth noting that a sharp decline occurred recently from these same levels (highlighted with an arrow), breaking through the blue support line.
Given these factors, it is reasonable to assume that bearish activity may intensify around current levels, potentially slowing further EUR/USD growth.
This article represents the opinion of the Companies operating under the FXOpen brand only. It is not to be construed as an offer, solicitation, or recommendation with respect to products and services provided by the Companies operating under the FXOpen brand, nor is it to be considered financial advice.

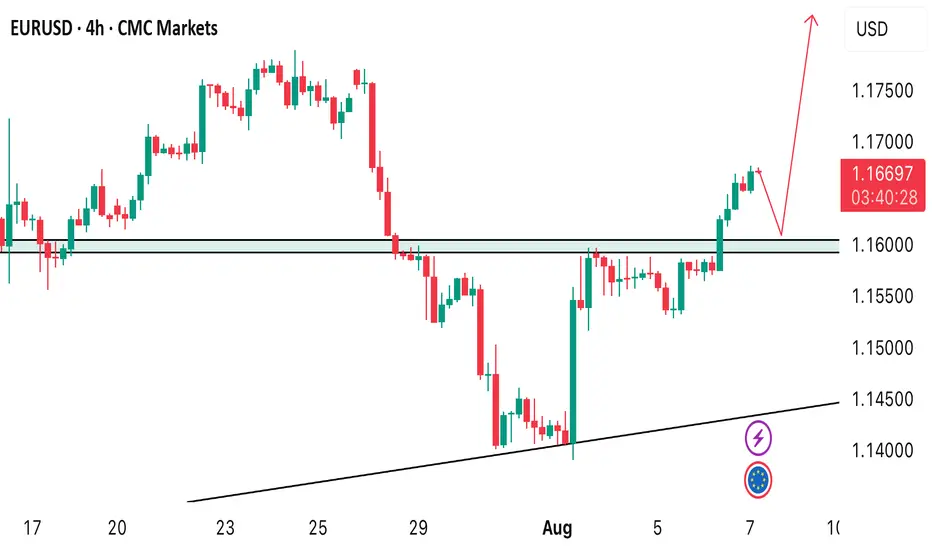
EURUSD SHIFTED TO INTRADAY BULLISH!Price has aligned with higher timeframe bias after breaking the major key level. From the intraday perspective, if I’d get a retrace to 1.16000 I’ll be looking forward to buying EURUSD
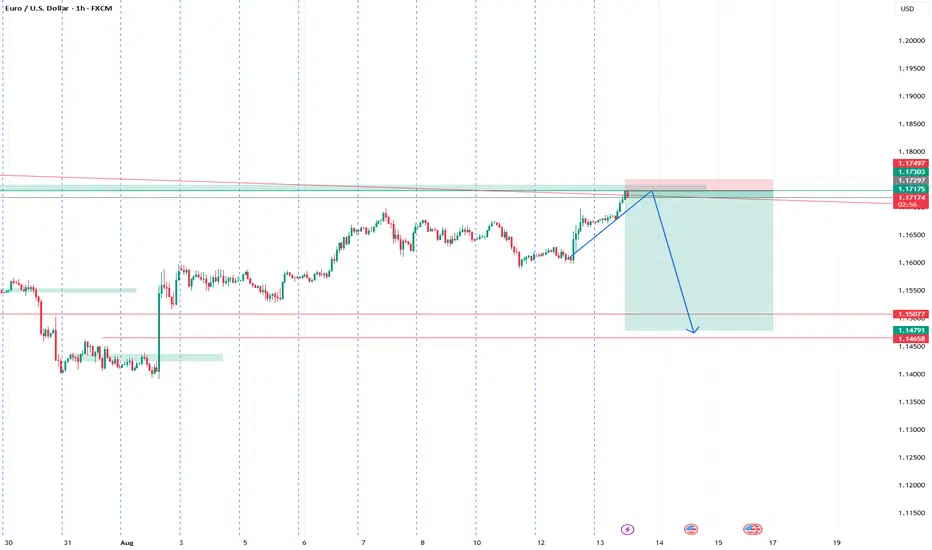
EURUSD analysis - 1H FVG and OB setupsOn the 1H timeframe, price has entered the green demand zone (1H FVG) around 1.1480 – 1.1520 after a strong bearish leg.
We're expecting a bullish retracement from this zone, aiming toward the upper red FVG/OB zone around 1.1690 – 1.1715.
📌 There are two key scenarios:
1️⃣ Scenario 1: Price starts moving up from the green FVG → reaches red FVG zone → short setup after lower timeframe confirmation
2️⃣ Scenario 2: Price makes an initial move to ~1.1620 → pulls back to the green zone → pushes back up into the red OB → short setup on confirmation
🎯 Final target for both scenarios: a break below the green FVG zone and continuation down
✅ Entry only after confirmation from lower timeframes (3M–15M)
❌ No trades without confirmation

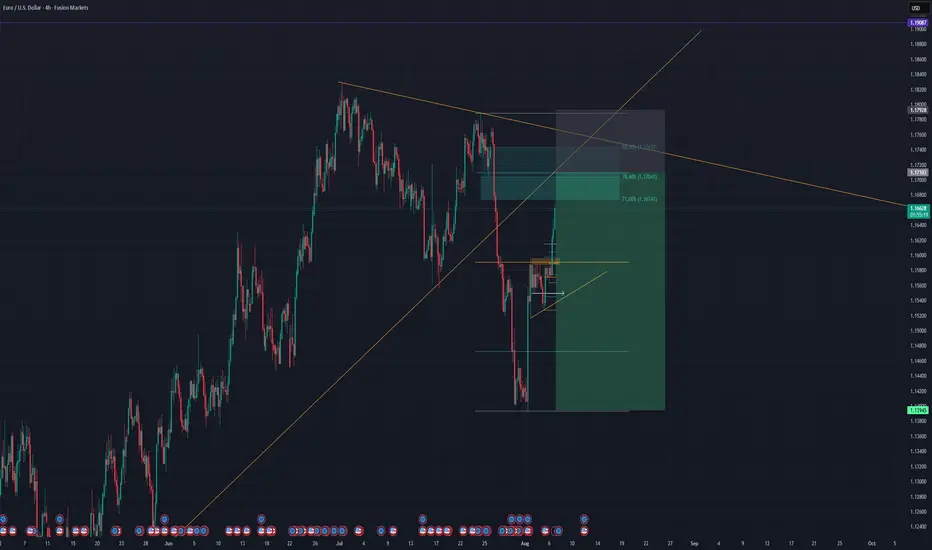
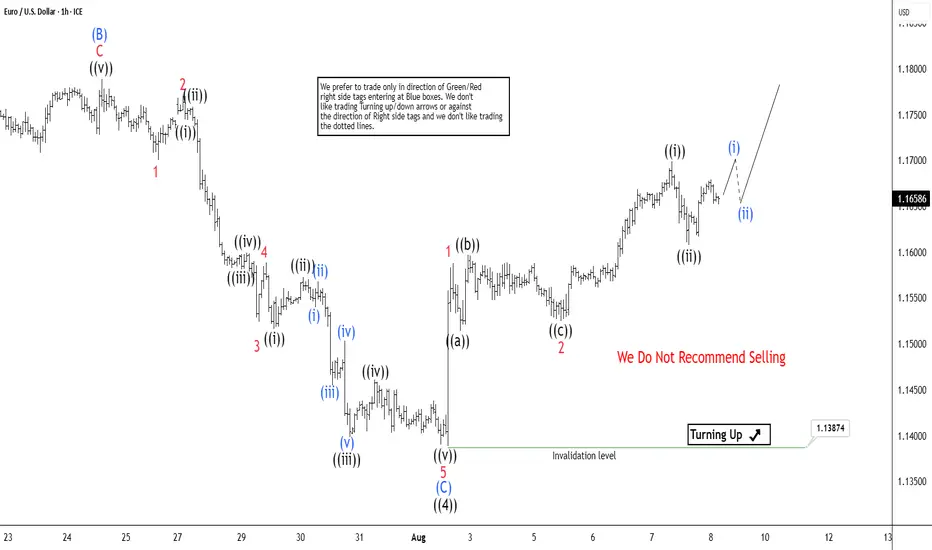
EURUSD Elliott Wave Update Aiming for 1.191 in Wave 5 ExtensionThe EURUSD pair exhibits an incomplete bullish sequence originating from the September 2022 low, targeting 1.191. The rally from this low unfolds as an impulse Elliott Wave structure. Wave ((1)) concluded at 1.1275, followed by a pullback in wave ((2)) that ended at 1.0177. The pair has since resumed its upward trajectory in wave ((3)), reaching 1.183. Subsequent pullback in wave ((4)) completed at 1.139, as illustrated in the 1-hour chart. The internal structure of wave ((4)) formed a zigzag pattern. From the peak of wave ((3)), wave (A) declined to 1.1554. Wave (B) rallied to 1.1788, and wave (C) descended to 1.1388, finalizing wave ((4)).
The pair has now turned higher in wave ((5)), but it must break above the wave ((3)) high at 1.183 to eliminate the possibility of a double correction. From the wave ((4)) low, wave 1 peaked at 1.1588, and wave 2 retraced to 1.1514. The pair is expected to extend once more to complete wave ((v)) of 3, followed by a wave 4 pullback, before advancing in wave 5 to conclude wave (1) of a higher degree. Subsequently, a wave 2 correction from the August 1 low is anticipated in a 3, 7, or 11 swing pattern before the uptrend resumes. As long as the pivot low at 1.1388 holds, dips should attract buyers in 3, 7, or 11 swing sequences, supporting further upside potential.
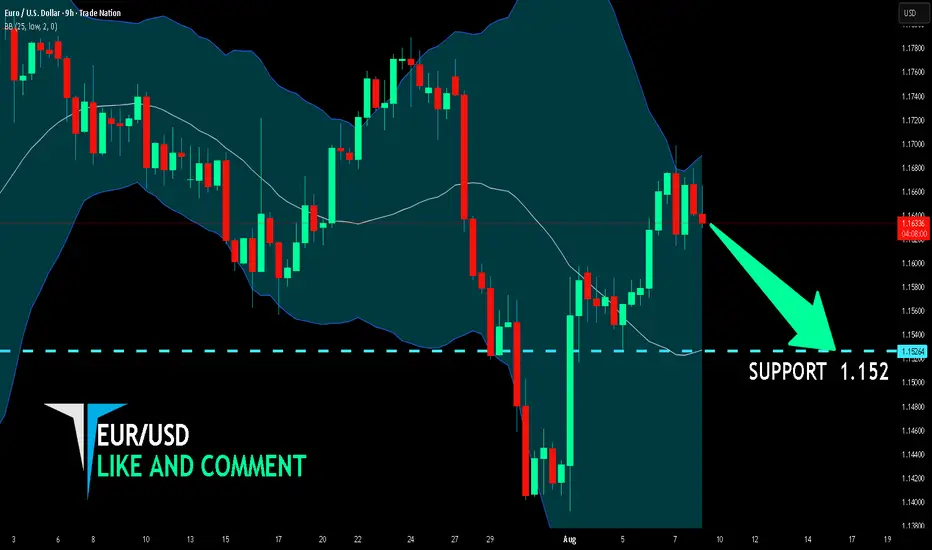
EUR/USD SELLERS WILL DOMINATE THE MARKET|SHORT
Hello, Friends!
Previous week’s green candle means that for us the EUR/USD pair is in the uptrend. And the current movement leg was also up but the resistance line will be hit soon and upper BB band proximity will signal an overbought condition so we will go for a counter-trend short trade with the target being at 1.152.
Disclosure: I am part of Trade Nation's Influencer program and receive a monthly fee for using their TradingView charts in my analysis.
✅LIKE AND COMMENT MY IDEAS✅
EUR/USD manipulation continuesWe don't care about your boring 200-300 pip manipulation. All traders know that bankers manipulate the market with fake data. During a historic recession in Europe, the price of the euro rises. This has never happened before. Europe will fall apart and the euro will collapse.

EURUSD - SERA - Market Structure EURUSD - SERA - Market Structure - use risk and trade managment for best result
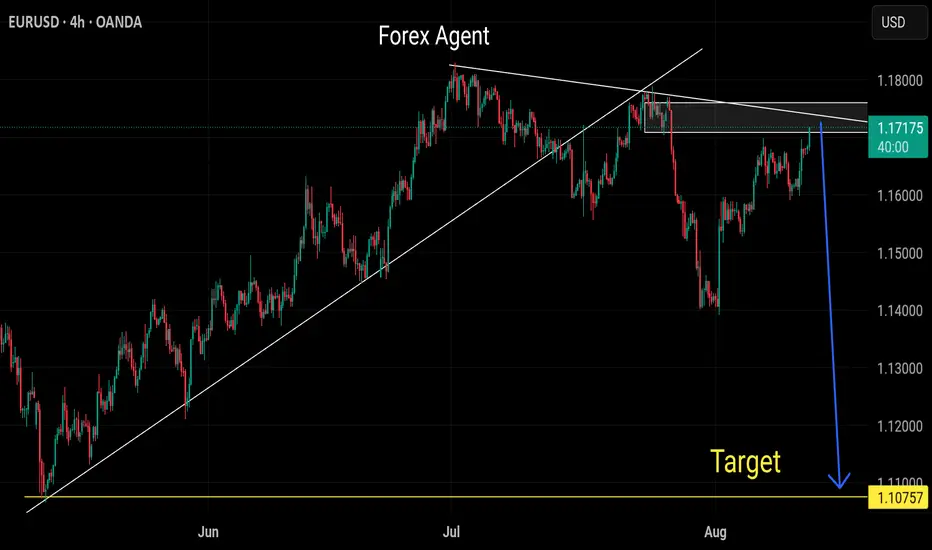
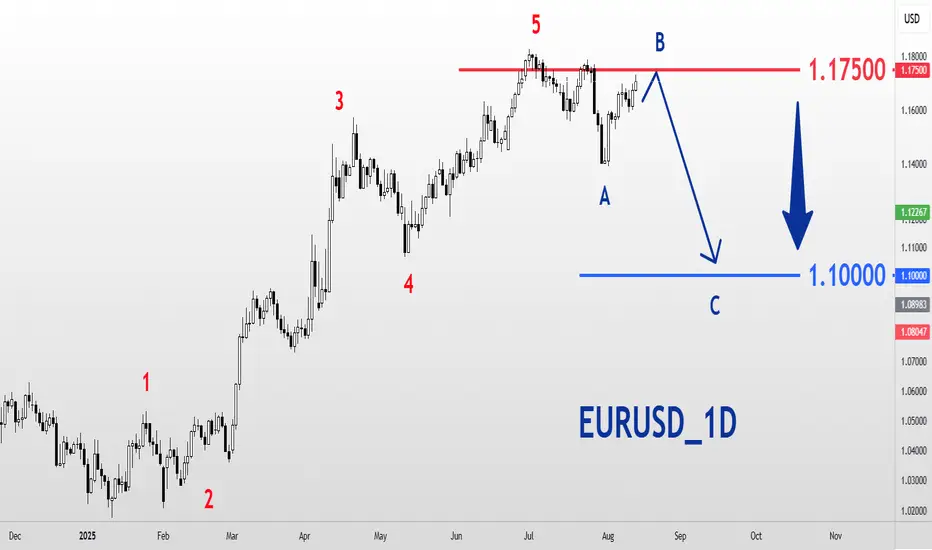
EURUSD_1D_SellEurodollar crash! According to Elliott waves, five waves of ascent have been completed and we are currently in wave B with the main resistance at 1.17500 The Euro is expected to enter a downtrend towards 1.10000.
EURUSD SELL SETUP SHOOOOOOOOORTWHAT'S YOUR OPINION ?
EURUSD formed ascending pattern on time frame Daily
and it break uptrend line and do retest on it
so we should research selling opportunities

EUR/USD – 1H | Bearish Setup Toward Rejection BlockPrice has broken structure (BOS) and confirmed a Market Structure Shift (MSS) after rejecting from the P1D High / Swing High zone.
Currently trading just above the P1D Low, and if the swing fails to hold, we could see a continuation toward the Equal Low / Strong Low area and ultimately into the Rejection Block for a potential reaction.
Bearish Roadmap:
1️⃣ BOS & MSS confirm downside bias.
2️⃣ Break of P1D Low → move toward Equal Low / Strong Low.
3️⃣ Final delivery into the Rejection Block.
Key Levels:
P1D High / Swing High: 1.16780
P1D Low: 1.16150
Equal Low / Strong Low: 1.15600
Rejection Block: 1.15350 – 1.15200
Order Block (OB) target: 1.14000 zone
🎯 Watching for short entries on pullbacks with targets at liquidity pools below.

EUR/USD - Weekly AMD Cycle! Coming to an end🔁 EUR/USD – Weekly AMD Cycle Repeating? 📉
Pair: EUR/USD
Timeframe: Weekly
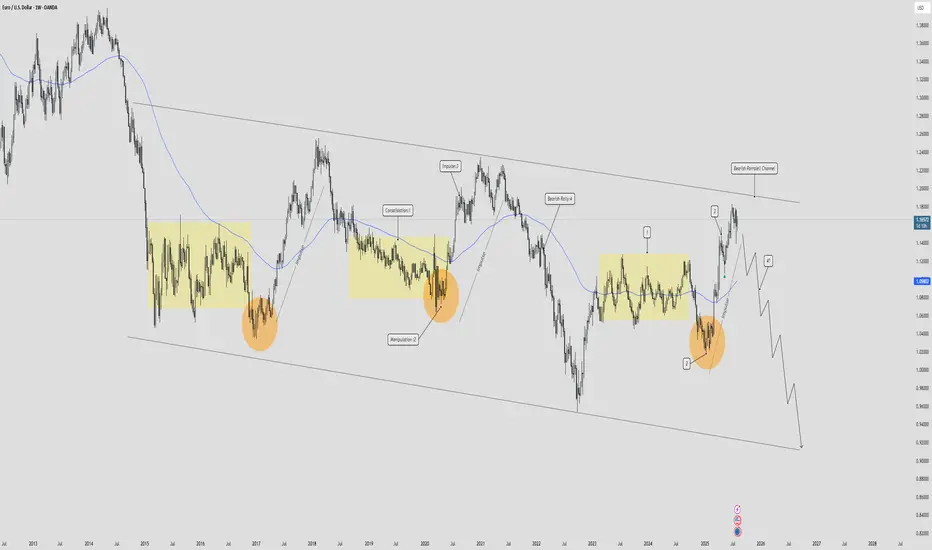
Bias: Bearish (Mid-Cycle Distribution)
🧠 What Is the AMD Cycle?
The AMD Cycle is a 3-phase smart money model used to describe how price moves through:
Accumulation – Smart money loads up on positions in discount zones.
Manipulation – Stop hunts / false breakouts to mislead retail.
Distribution – Price delivers to target efficiently, often with trend continuation.
This cycle repeats over and over across all timeframes – and right now, EUR/USD is showing a textbook repeat of this pattern on the weekly chart.
📊 EUR/USD Weekly – AMD Breakdown
✅ Phase 1: Accumulation (Late 2022 – Mid 2023)
Price bottomed out in the 0.95 - 1.00 zone, creating multiple equal lows, acting as liquidity.
Smart money accumulated orders here, absorbing sell pressure.
✅ Phase 2: Manipulation (Q3 2023 – Early 2024)
Price created a massive bullish rally, sweeping highs around 1.10 – 1.12, triggering breakout buyers.
This was liquidity engineering, not genuine bullish continuation.
We saw divergent volume, overextended price, and imbalance being left behind.
✅ Phase 3: Distribution (Mid 2024 – Now)
After sweeping the highs, price has shifted structure.
Multiple weekly BOS (Breaks of Structure) confirm a bearish reversal.
Price is now returning to retest premium zones near 1.09 – 1.10, likely to distribute further before sell-off.
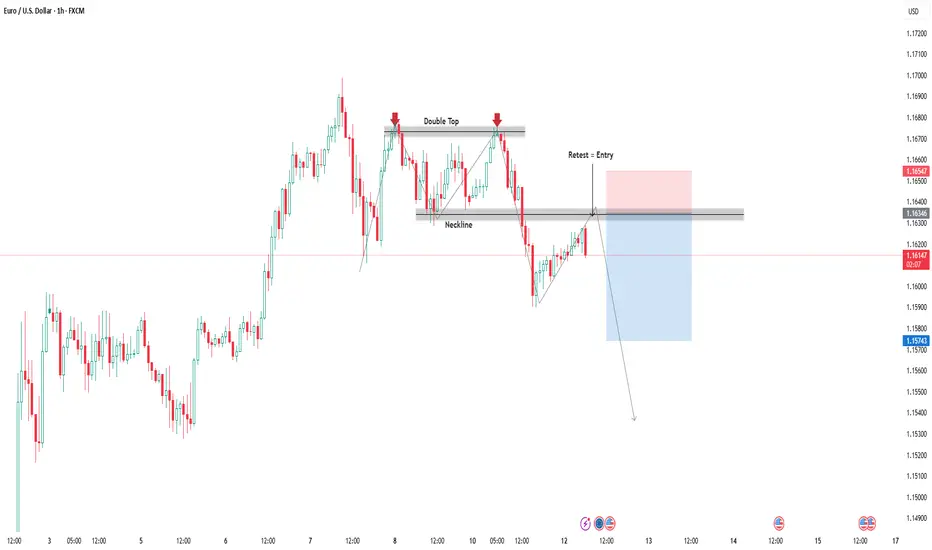
EUR USD Trade Setup 1 hour timeframe EUR USD has formed a Double Top Break and Retest on the 1 hour timeframe.
additionally, the retest level also align with the 0.618-0.50 Fib Retracement level.
Ensure to wait for entry confirmation on the retest level before selling....
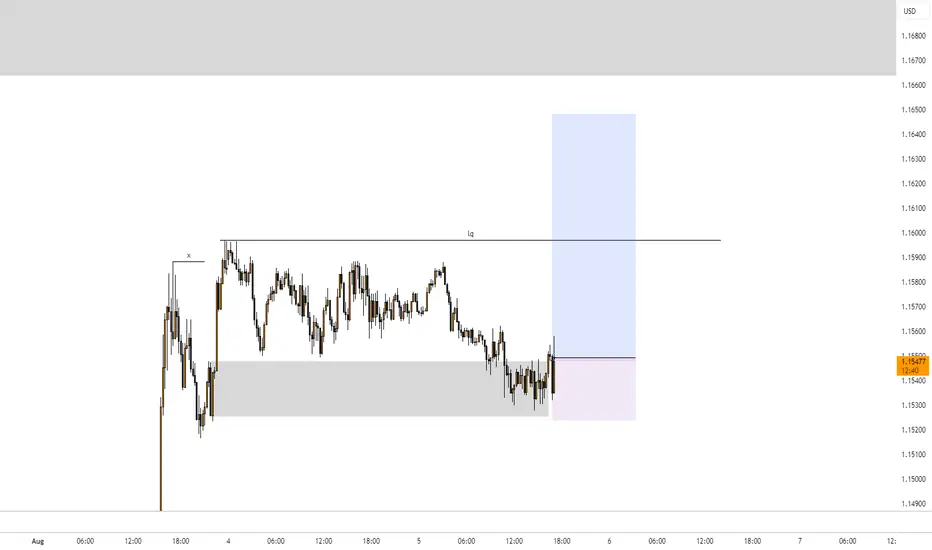
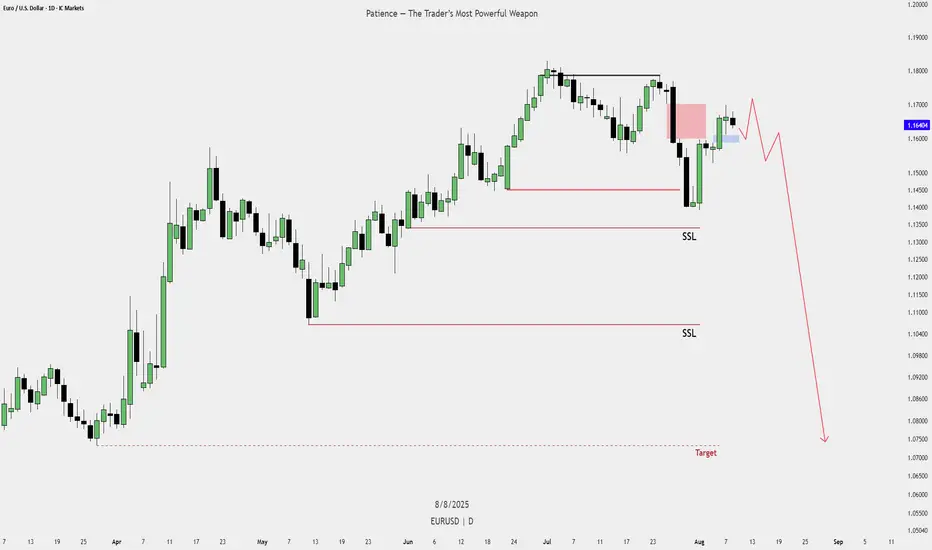
Sell Plan – EUR/USD (Bear Wakeup)Sell Plan – EUR/USD (Bear Wakeup)
Market Context: Price has retraced into a bearish zone after taking out previous buy-side liquidity.
Bearish Signal: Rejection from a key supply area (red zone) with potential shift back into bearish orderflow.
Entry Trigger: Wait for confirmation of lower timeframe breakdown after the retracement.
Targets: First SSL zone, followed by deeper liquidity levels as marked on the chart.
Rationale:
Multiple SSL levels below suggest liquidity draw to the downside.
Current structure favors continuation lower once retracement is complete.
eurusd selldxy has been weak , and as a result of the cpi data promting a rate cut
The Fed primarily looks at Core CPI y/y
Core CPI m/m (0.3% actual vs 0.3% forecast) → in line with expectations, shows underlying inflation is stable but still above the Fed’s 2% target when annualized.
CPI m/m (0.2% actual vs 0.2% forecast) → also in line, meaning no immediate inflation surprise.
CPI y/y (2.7% actual vs 2.8% forecast) → slightly softer than expected, which can be mildly USD bearish if the market thinks it gives the Fed room to cut rates sooner