EUR/USD Holds Steady Ahead of US DataHello everyone, what are your thoughts on FX:EURUSD ?
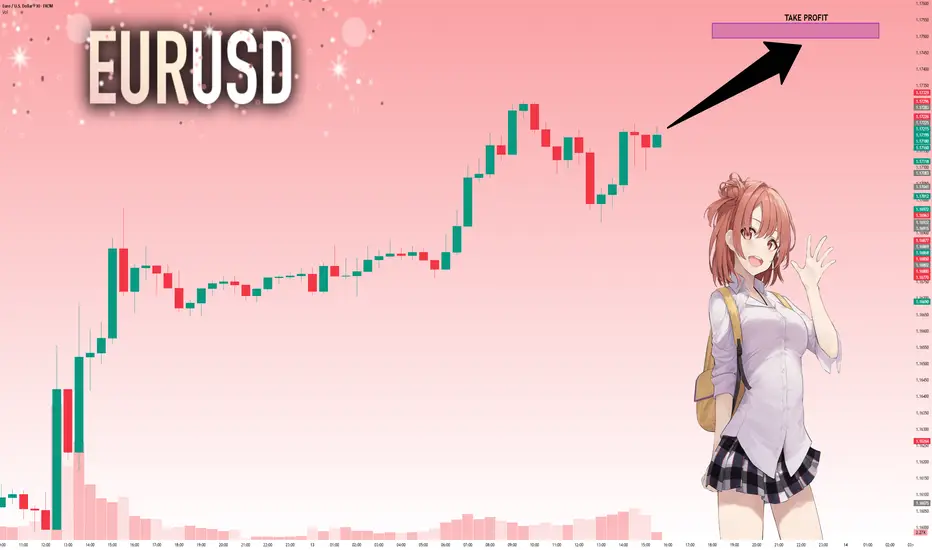
Today, the pair is trading in a narrow range around 1.1650 on Friday. While the US dollar is struggling to regain strength, a slight pullback in EUR/GBP following the Bank of England’s policy announcement has limited the upside for EUR/USD. The market now awaits upcoming US economic data.
From a technical perspective, EUR/USD remains anchored above newly established support levels. If these levels hold, this pullback could be an excellent accumulation phase before a breakout move.
What do you think? How will EUR/USD move by the end of the session and in the coming days?
EURUSD trade ideas
EURUSDWait for a clear trendline breakout followed by a retest. Enter long only if confirmation is present. Avoid rushing in — confirm it’s not a fake breakout by watching price action. If momentum shifts, we may look for short opportunities. Always make your own trading decisions; this is not financial advice, just my view.
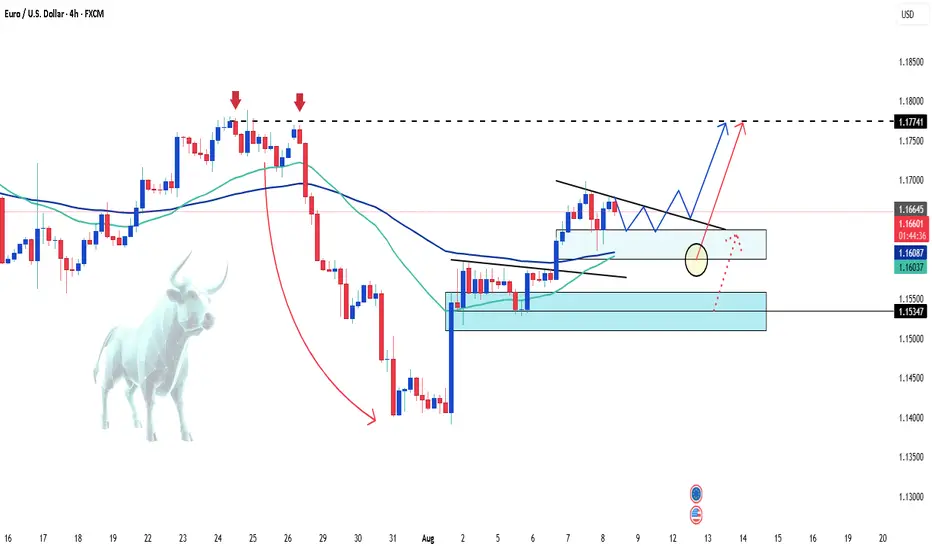
10-08-2025 _ Short Term Bullish Idea _ EURUSD H41- Bullish Divergence on H4.
2- Followed by series of HHs and HLs.
3- We are looking for correction followed by a move to the upside.

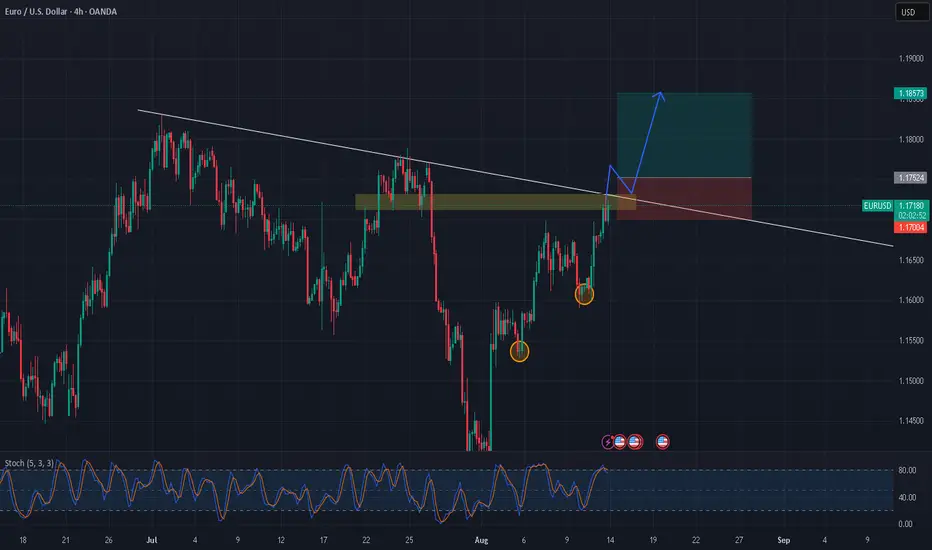
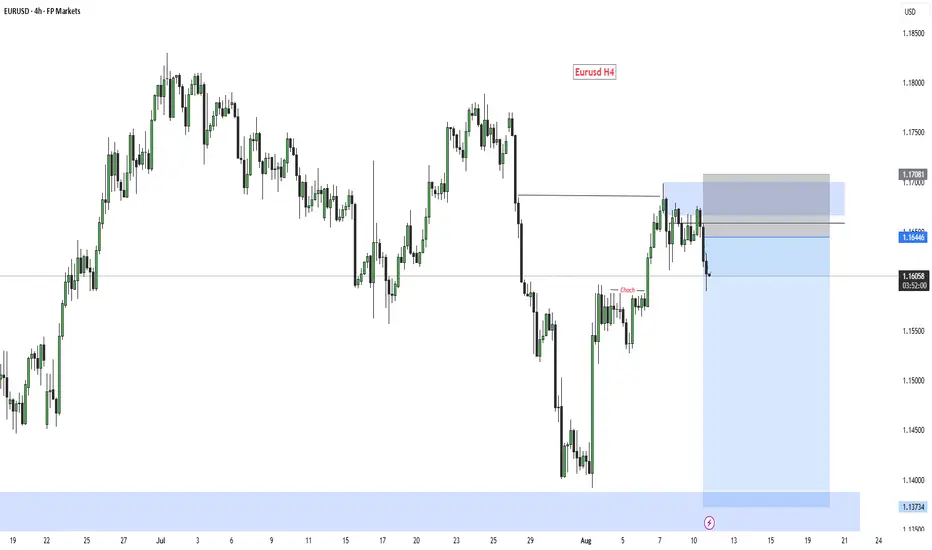
EUR/USD Analysis – Hunting a Buy Opportunity from a Key Zone💹 EUR/USD Analysis – Hunting a Buy Opportunity from a Key Zone 🇪🇺💵
After a correction and drop from the recent high, the Euro is approaching a major support area and the Buy Zone.
My scenario: If price reaches this area and confirms with price action, I expect a strong rebound towards higher targets.
📌 Key points:
Short-term bearish structure, but correction nearing completion
Support zone overlapping with Fibonacci confluence
Potential target above the previous high
⚠️ This is a personal view, not financial advice. Always apply risk management.
❓ What do you think? Could this correction be the start of a bullish rally, or will the drop continue?
------------------------------------------------------------------------------------------------------
🚀 Who am I?
I'm Mahdi, a prop firm trader with 7+ years of experience in technical analysis, mainly focusing on Smart Money Concepts and Elliott Wave theory.
I specialize in delivering high-quality trading signals, market insights, and educational content tailored for serious traders and investors.
📊 My Tools: SMC, Elliott Wave, Fibonacci, Liquidity Grabs, Order Blocks
💼 Prop Challenge Passed: Yes | Funded Account: In Progress
🔗 Follow for consistent updates and trading insights.
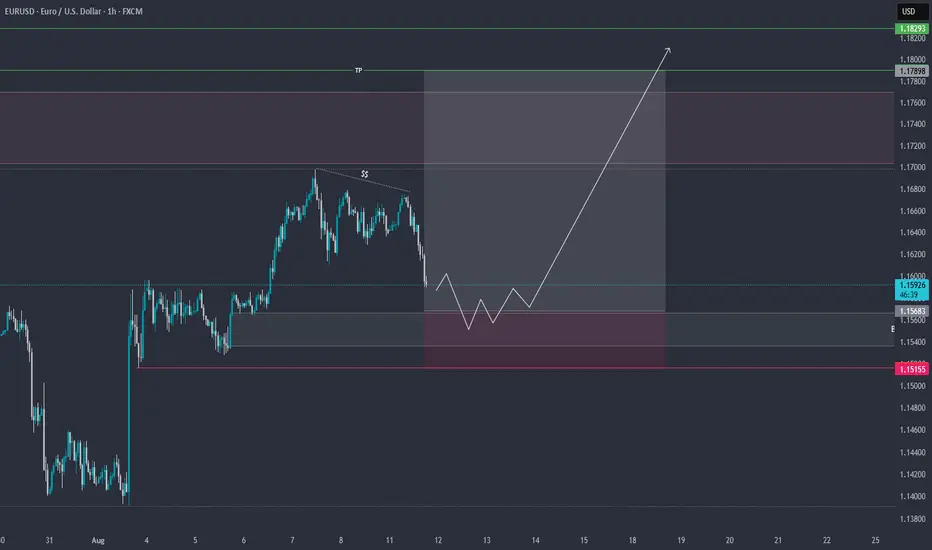
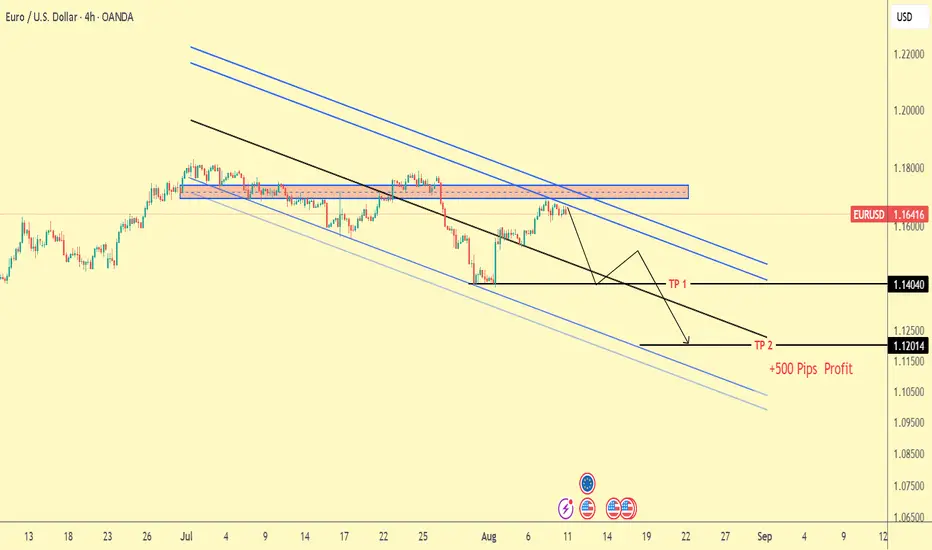
EURUSD Trade Plan 11/08/2023(+500 Pips!!!)Dear Trader,
Dear Trader ,
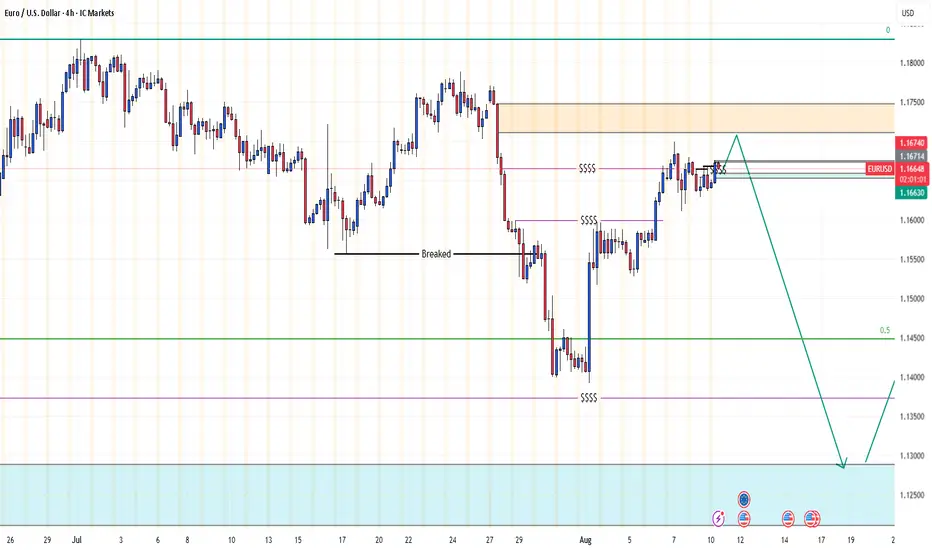
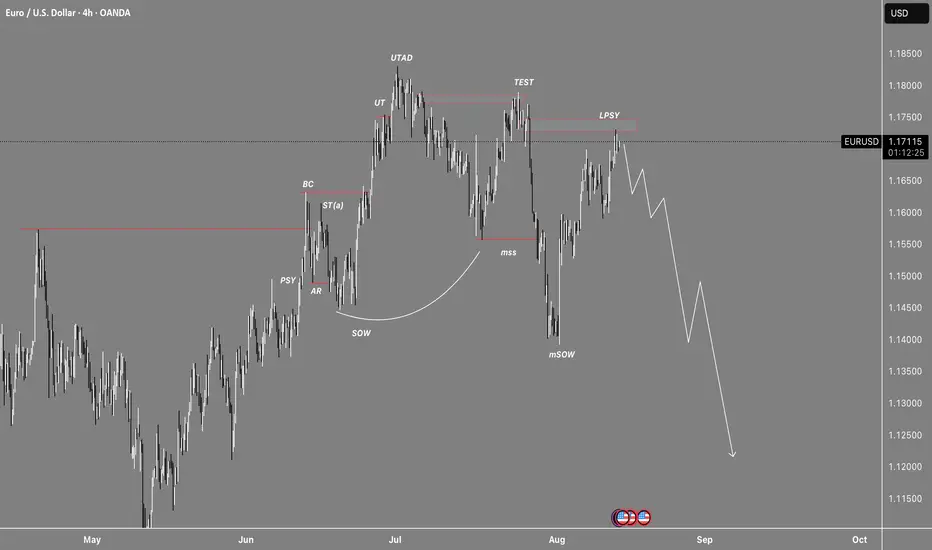
Price Almost Hit Top of Descending channel , and I expect the price to enter a corrective phase from the range of 1.16600-1.17200 towards targets of 1.14500, 1.13500, and 1.12000. A good selling opportunity will arise.
Sell Area : 1.16600-1.17200
TP : 1.1.14500
TP : 1.13500
TP : 1.1200
SL : Above 1.17500
regards,
Alireza!
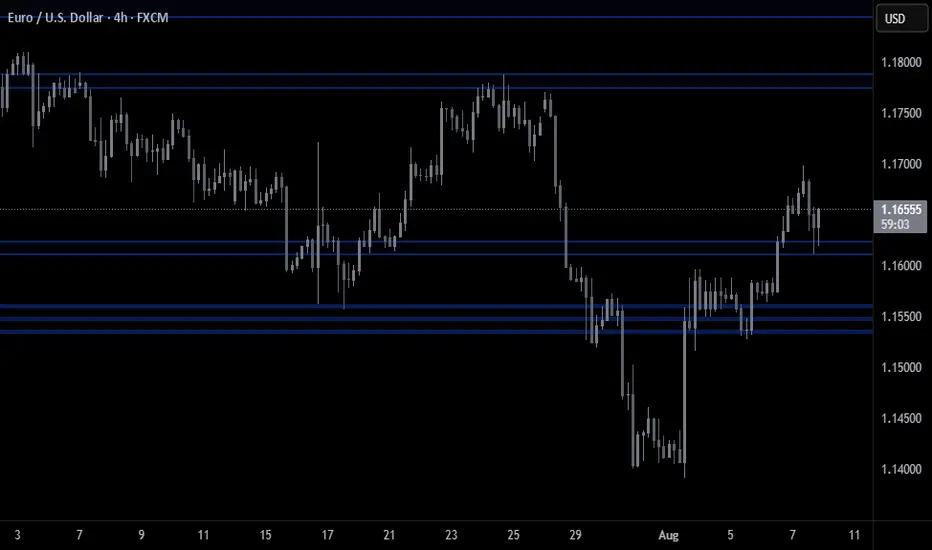
EURUSDPreferably suitable for scalping and accurate as long as you watch carefully the price action with the drawn areas.
With your likes and comments, you give me enough energy to provide the best analysis on an ongoing basis.
And if you needed any analysis that was not on the page, you can ask me with a comment or a personal message.
Enjoy Trading ;)
EURUSD: SELL OPPORTUNITYEUR/USD trading below a major resistance level and after pulling back to the broken trendline, we're seeing a scenario for short-term chop consolidation before potentially resuming the bearish move toward lower lows .
As long as price stays beneath the 1.1700 resistance level, the bearish bias remains intact.
Sell eurusd Strong selling wave coming
And we expecting the euro weakening among all cross pairs
Bearish correction just started now
Daily buy trend already breaks and changed the trend now
EURUSD: Will Go Up! Long!
My dear friends,
Today we will analyse EURUSD together☺️
The in-trend continuation seems likely as the current long-term trend appears to be strong, and price is holding above a key level of 1.17225 So a bullish continuation seems plausible, targeting the next high. We should enter on confirmation, and place a stop-loss beyond the recent swing level.
❤️Sending you lots of Love and Hugs❤️
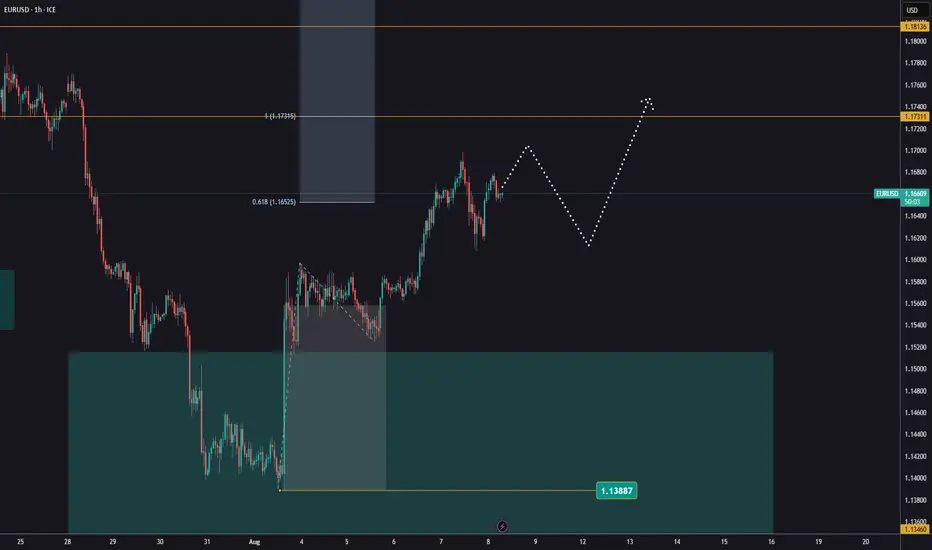
Bullish rise?The Fiber (EUR/USD) is falling towards the pivot and could bounce to the 1st resistance.
Pivot: 1.1591
1st Support: 1.1391
1st Resistance: 1.1811
Risk Warning:
Trading Forex and CFDs carries a high level of risk to your capital and you should only trade with money you can afford to lose. Trading Forex and CFDs may not be suitable for all investors, so please ensure that you fully understand the risks involved and seek independent advice if necessary.
Disclaimer:
The above opinions given constitute general market commentary, and do not constitute the opinion or advice of IC Markets or any form of personal or investment advice.
Any opinions, news, research, analyses, prices, other information, or links to third-party sites contained on this website are provided on an "as-is" basis, are intended only to be informative, is not an advice nor a recommendation, nor research, or a record of our trading prices, or an offer of, or solicitation for a transaction in any financial instrument and thus should not be treated as such. The information provided does not involve any specific investment objectives, financial situation and needs of any specific person who may receive it. Please be aware, that past performance is not a reliable indicator of future performance and/or results. Past Performance or Forward-looking scenarios based upon the reasonable beliefs of the third-party provider are not a guarantee of future performance. Actual results may differ materially from those anticipated in forward-looking or past performance statements. IC Markets makes no representation or warranty and assumes no liability as to the accuracy or completeness of the information provided, nor any loss arising from any investment based on a recommendation, forecast or any information supplied by any third-party.

EURUSD continues its uptrendYesterday, EURUSD extended its climb, reaching 1,1699.
The trend remains firmly bullish, with buying opportunities being the only viable option.
Watch for a pullback and a continuation towards the next target.
Look for a favorable risk-to-reward ratio and manage your risk carefully.
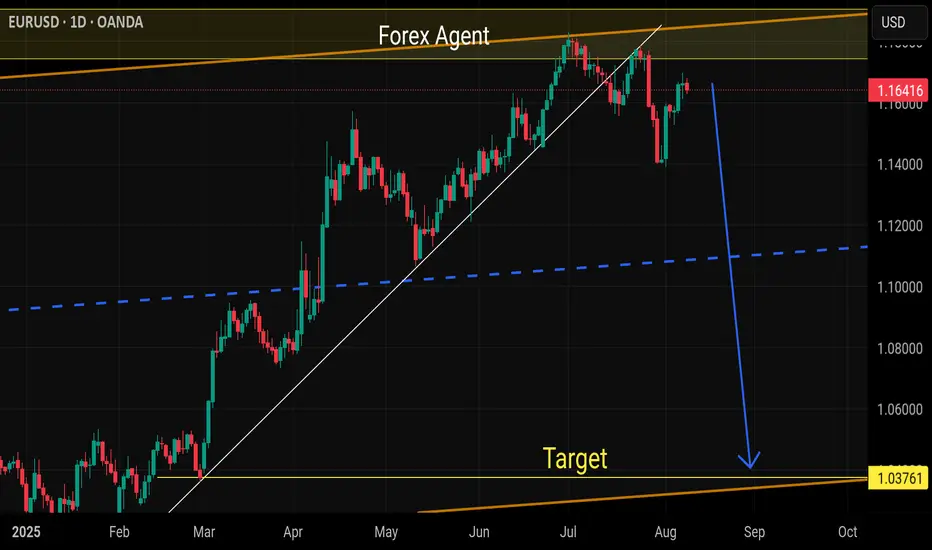
EURUSD SELL BIASPrice action has maintained a bullish structure since the beginning of the year. However, recent failure to break above the June high, coupled with the formation of lower highs and lower lows, suggests a potential bearish reversal. My final target is positioned at 1.15164, with the ultimate take-profit level set at 1.13914.
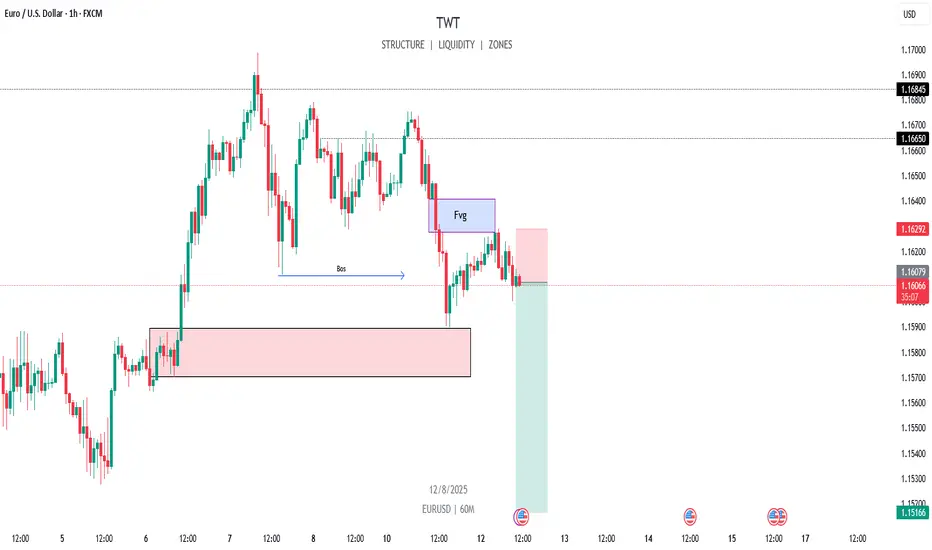
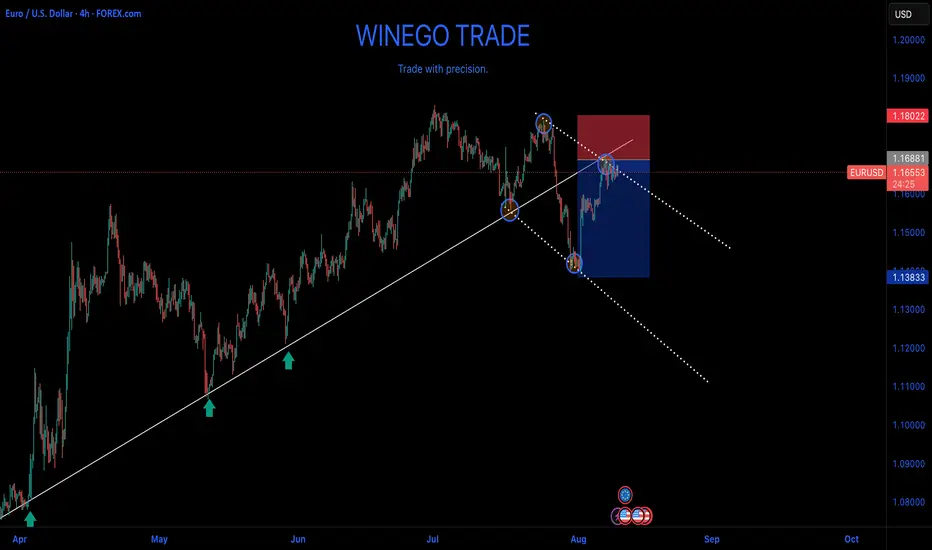
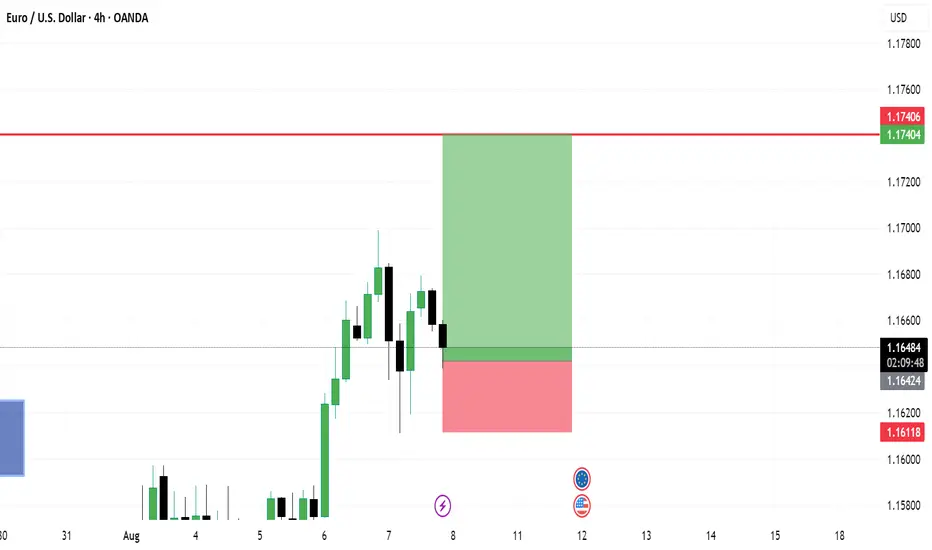
Eurusd📊 EUR/USD – H4 Detailed Analysis
On the H4 timeframe, EUR/USD has formed a clear Change of Character (CRT), indicating a possible shift in market structure.
Right next to this CRT, we identified a Fair Value Gap (FVG) – a strong imbalance zone that often acts as a high-probability reaction point.
Today, as soon as price came back to retest the H4 FVG, we executed a sell entry from our pre-marked zone.
This trade was planned in advance based on market structure and smart money concepts.
Why this setup is important:
• CRT shows a break in previous bullish structure.
• FVG retest often provides a precise entry with tight risk.
• Alignment on H4 increases trade reliability.
Now, we will manage the trade according to our plan — letting the market play out without emotional interference.
📌 Key Takeaway: Patience to wait for the retest, and discipline to execute only when the setup is complete, is what separates consistent traders from the rest.
Tecnical analysis EURUSD 4HIt is expected that the price will start to move downwards to the support area of 1.1300 upon reaching the resistance range between 1.17100 and 1.17500 and forming a suitable setup.
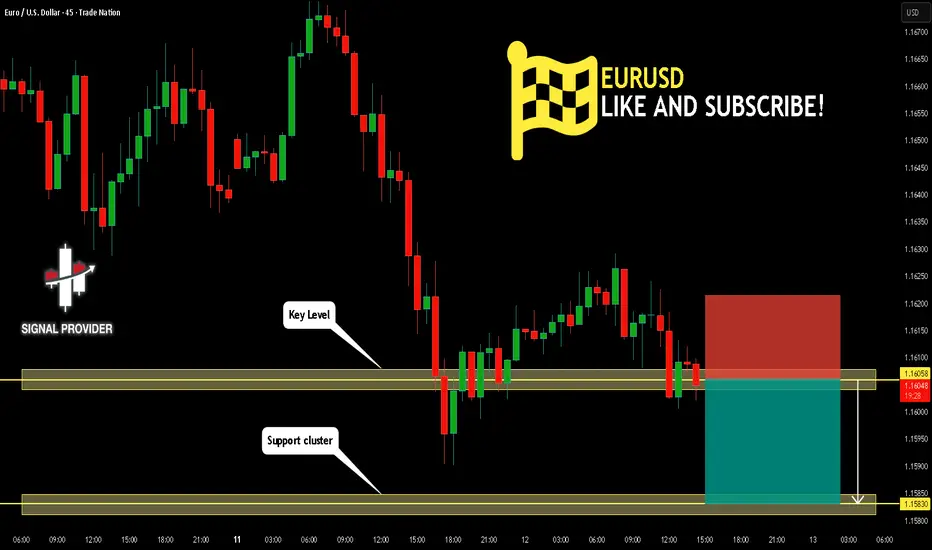
EURUSD Will Move Lower! Sell!
Take a look at our analysis for EURUSD.
Time Frame: 45m
Current Trend: Bearish
Sentiment: Overbought (based on 7-period RSI)
Forecast: Bearish
The market is approaching a key horizontal level 1.160.
Considering the today's price action, probabilities will be high to see a movement to 1.158.
P.S
Please, note that an oversold/overbought condition can last for a long time, and therefore being oversold/overbought doesn't mean a price rally will come soon, or at all.
Disclosure: I am part of Trade Nation's Influencer program and receive a monthly fee for using their TradingView charts in my analysis.
Like and subscribe and comment my ideas if you enjoy them!

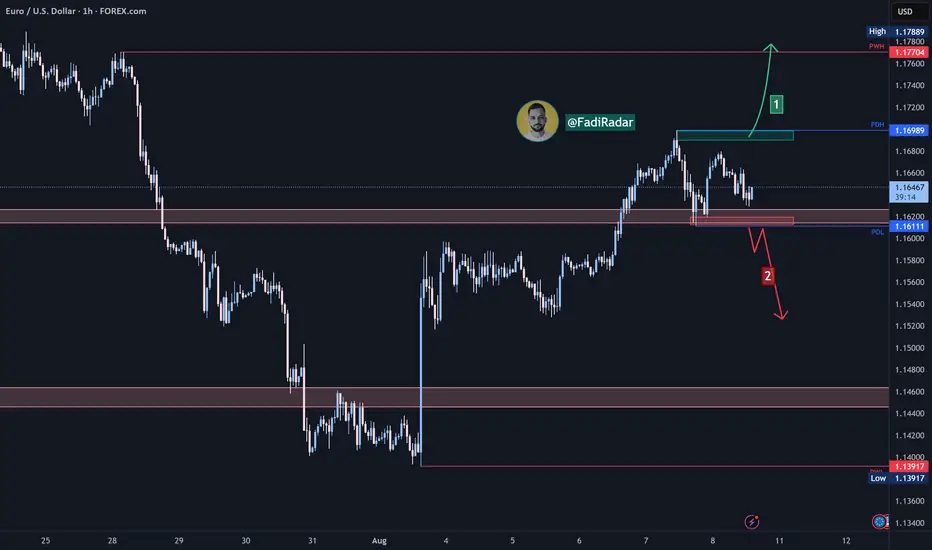
EUR/USD Analysis:The pair is moving sideways between the 1.169 resistance zone and the 1.162 support zone.
A break and hold above 1.169 could push the price to test 1.177.
A break below 1.161 and stability beneath it may lead to a retest of 1.157, followed by 1.153, which is a potential bounce area.
⚠️ Disclaimer:
This analysis is not financial advice. It is recommended to monitor the markets and analyze the data carefully before making any investment decisions.
EURUSD possible bearish for 1.1200#eurusd forming lower high and lower low in daily time frame. Price broke 1.1557 & 1.1447 support level. 1.1738-1788 daily supply zone for sell. there are many different support levels before 1.1200 level i.e. 1.1550, 1.1420, 1.1255 & 1.1200. 1.1430-20 is secure level to book profit in sell trade.

EURUSD: Market of Sellers
The price of EURUSD will most likely collapse soon enough, due to the supply beginning to exceed demand which we can see by looking at the chart of the pair.
Disclosure: I am part of Trade Nation's Influencer program and receive a monthly fee for using their TradingView charts in my analysis.
❤️ Please, support our work with like & comment! ❤️

ELLIOTT WAVE EURUSD Daily update
EW Trade Set Up daily
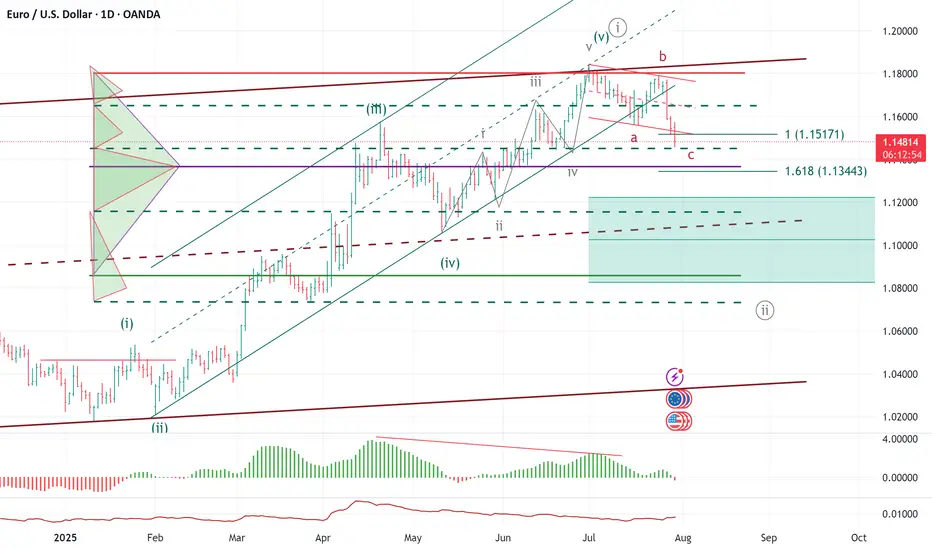
minute ((i)) seems finished
H4 scenario 210725:
the price upward movement from 1.1557 area on 17/07/25 has broken decisively 1.1684-1.1705 area but it had not the
strenght to go further so that the lagging span (green line) could break upward the leading span B (red line).
A decrescent high has been registered at 1.1800 area on 24/07/25.
In this new scenario it looks like that the impulsive movement that started from 1.0180 on 13/01/25
finisced at 1.1834 on 010725 in the minute wave (i). (EWO divergence, break down of the upward (ii)/(iv) channel).
So i have to register that a correction to minute wave ((ii) has started
key levels VP area
1.1800
1.1370 POC
1.0850
note :
monitor the price reaction at any supports level: VP area and LVN
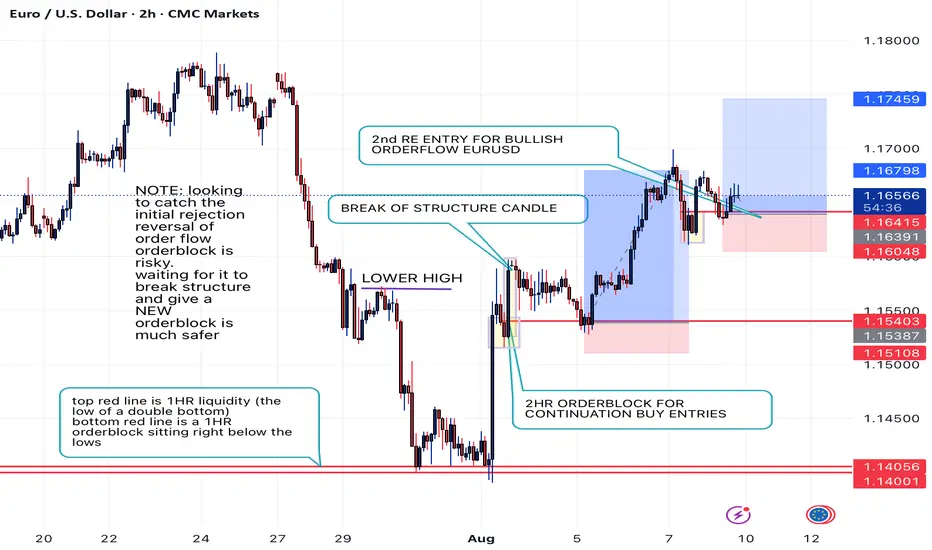
2HR ORDERBLOCK BULLISH ORDERFLOW EURUSD WEEK OF 8/4/25note: previously in the week of 7/28 we wanted to snipe the 4hr orderblock reversal candle...
not waiting for price action to truly consolidate/mitigate in that zone.
FOMC dropped price further than expected.... this is why to stay with trend/orderflow until it is confirmed the ORDERFLOW as switched. BIG BANK ENTRIES AND BIG TIMEFRAME ORDERFLOWS.. ..;
once price breaks out there is no rush to get in... knowing it has to continue to the next KEY higher timeframe orderflow/liquidity, you can easily wait for price to RANGE and consolidate on lowertimeframe forming and ORDERBLOCK for an entry.
if you have a normal broker account or a swing prop firm account you are able to CATCH A SNIPER ENTRY OFF ORDERBLCK AND HOLD TO HIGHER TIMEFRAME TARGET ZONE.