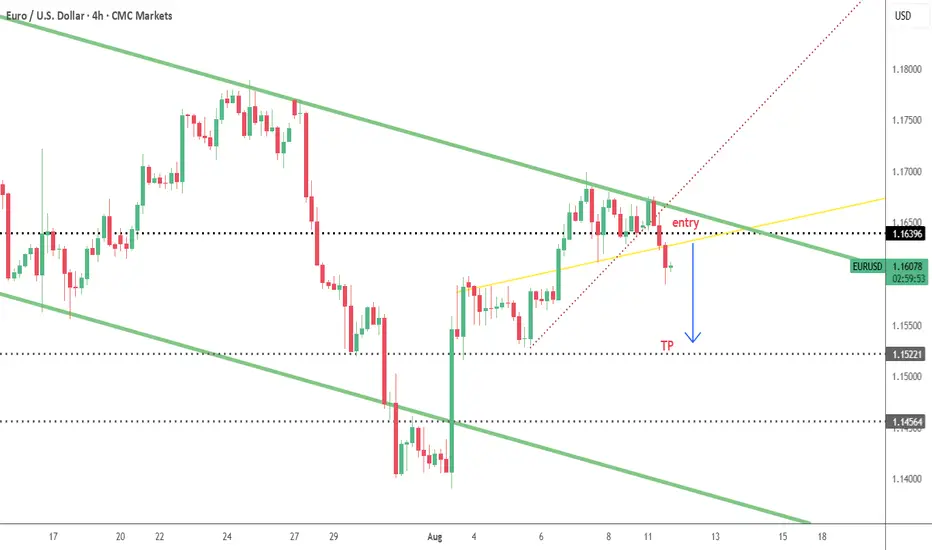
EURUSDEURUSD also have correction coming this week before anymore upside.
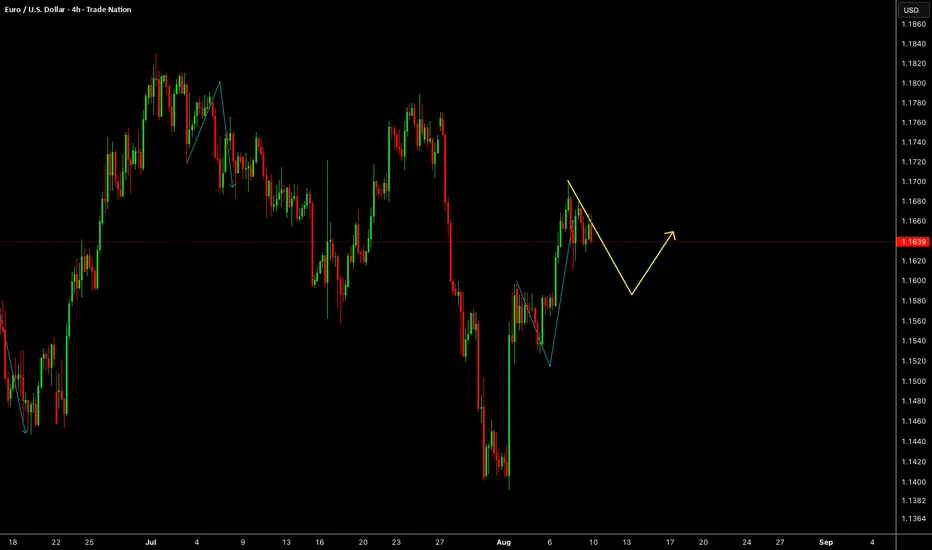
Disclosure: We are part of Trade Nation's Influencer program and receive a monthly fee for using their TradingView charts in our analysis.
EURUSD trade ideas
EURUSD--SHORT--Dollar index is rising so it is time to short EURUSD
--my favorite set-up as shown on chart
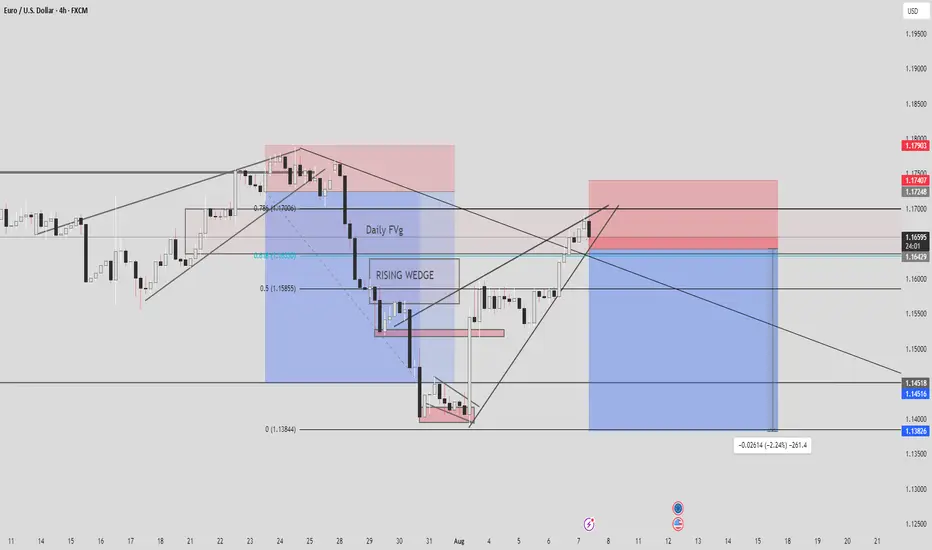
EURUSD SWING SETUP EURUSD has Pulled back into critical level thats a Fib zone and also a daily FVG With a charts pattern price action thats a rising wedge. Any breakout we see from the wedge could led to a deep fall on the EURUSD
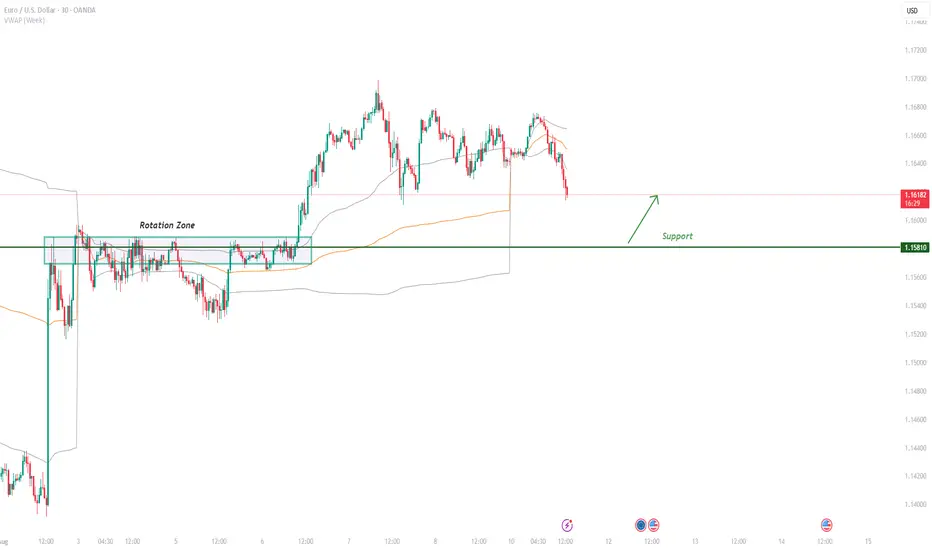
EUR/USD: Volume Accumulation Setup at Support LevelOn EUR/USD, it's nice to see a strong support at the price of 1.1581.
This level marks the weekly Point of Control, where the heaviest volumes from last week were traded, showing strong buyer accumulation. Buyers who entered here later pushed the price up aggressively, and if the price returns to this area, they will likely defend it and push the market up again.
EURUSD: Will Go Up! Long!
My dear friends,
Today we will analyse EURUSD together☺️
The market is at an inflection zone and price has now reached an area around 1.16337 where previous reversals or breakouts have occurred.And a price reaction that we are seeing on multiple timeframes here could signal the next move up so we can enter on confirmation, and target the next key level of 1.16551.Stop-loss is recommended beyond the inflection zone.
❤️Sending you lots of Love and Hugs❤️
EurUsd Shorts... 'ICT Fair value gap Trade'After a steady gain in prices on EURUSD market this week volume seems to subside signaling a possible end of the retracement and the continuation down looking imminent. A 200 pip drop looking possible in the following days. Stay Sharp.
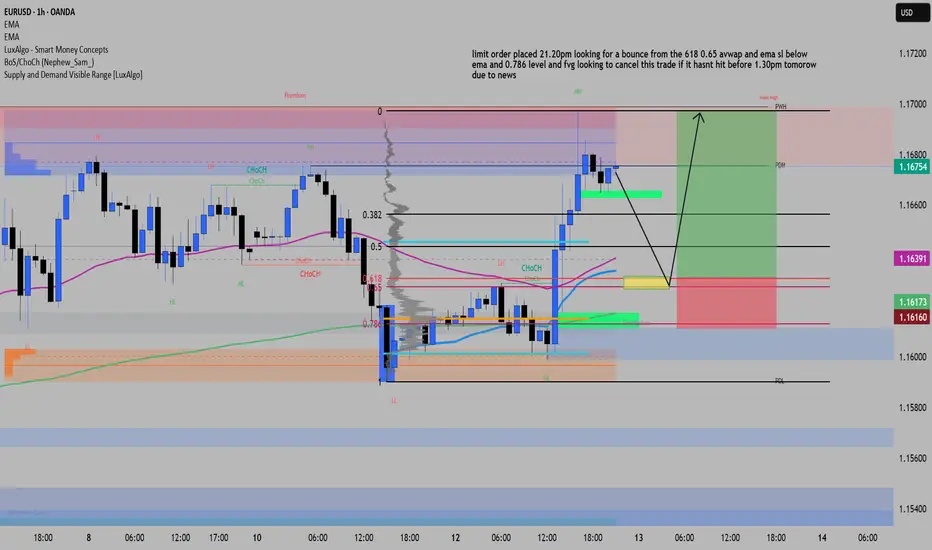
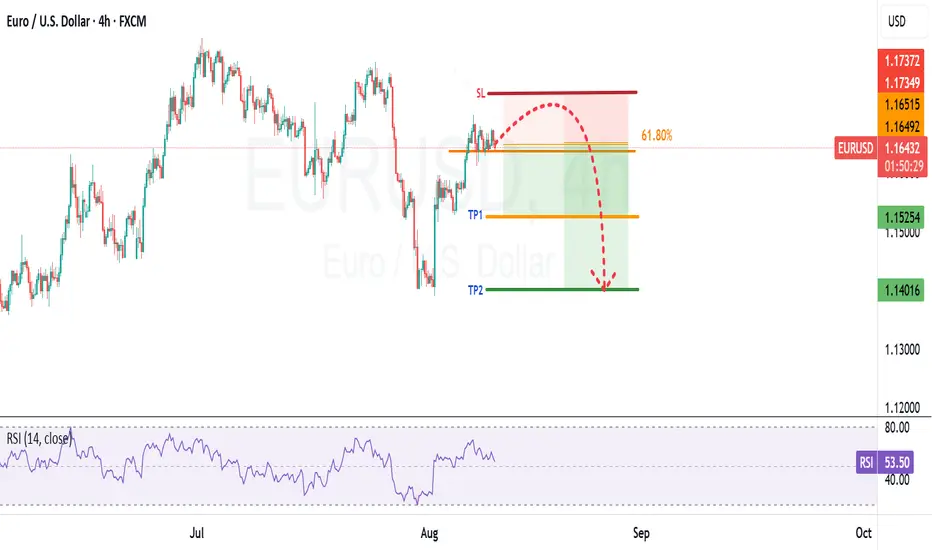
EUR/USD Long – 0.618 Fib + AVWAP/EMA Confluence | Target 3.29RDisclaimer: This is my personal trading journal entry, not financial advice.
EUR/USD – 1H Long Setup
Bias: Bullish, supported by DXY showing bearish structure (Lower Highs & Lower Lows).
Entry Plan:
Limit order set at 0.618–0.65 fib retracement zone, aligning with AVWAP and 50 EMA.
Additional confluence from NPOC and prior support zone.
SL placed below 0.786 fib and FVG, under the 200 EMA for extra protection.
Target set at Previous Weekly High (PWH), giving ~3.29R.
Risk Management:
If price hasn’t triggered before 1:30 PM news release tomorrow, trade will be cancelled to avoid volatility risk.
If triggered before news, plan is to move SL to BE at +1R or consider partial profit booking.
Confluences:
Fibonacci 0.618 retracement
AVWAP
50 EMA & 200 EMA
FVG & NPOC levels
Support/resistance alignment
EURUSD, Will we be stopped again?Check out our previous analysis to get more info on the explanations.

pretty cut and dry set upNot much explanation needed here, looking for a bearish move, 2:1 risk. Price failed to make a new high, impulsed down and is in a classic correction pattern, enter on break or wherever you feel comfortable. Good luck!
EUR USD LONGHi guys, this pullback its a perfect time to entry and get the last operation for this week, good luck everyone.
EURUSD retested bearish wedge. Ready to decline?EURUSD retested bearish wedge. Ready to decline?
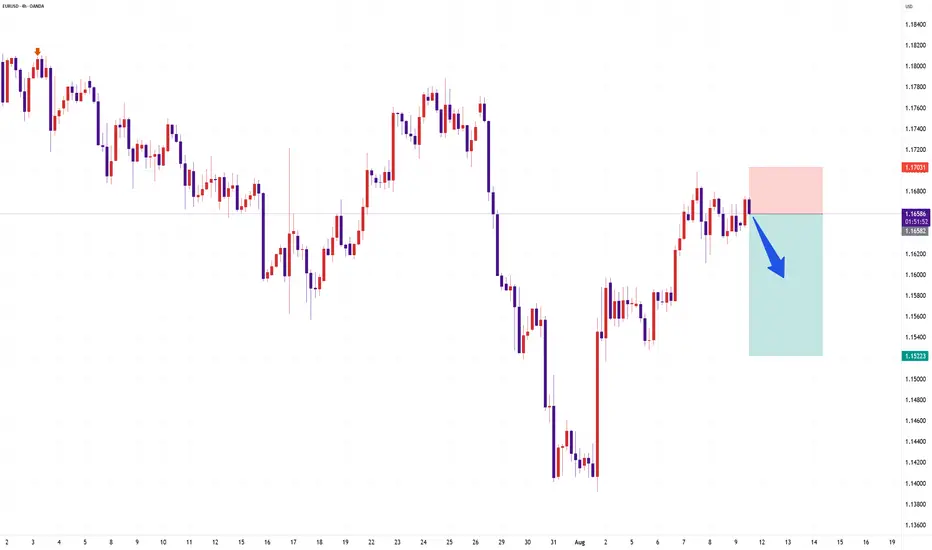
EURUSD has been trading bullish since the beginning of August after disappointing NFP report data came out. By the end of last week price has come to a lower border of the wedge and SMA200 on 4-h chart, but failed to develop bullish momentum and pulled back from it. The asset shows weakness and further decline towards 1.14000 as a first target is expected. MACD is in the red zone.

EUR/USD Update - Potential TargetsDear Friends in Trading,
How I see it,
** CPI Release tomorrow - BE SAFE!
Keynote:
Price currently at a key support: Previous break-out area!
If support holds potential for more upside is high.
I sincerely hope my point of view offers a valued insight
Thank you for taking the time study my analysis.
SELL EURUSDThis pair has just completed the 2618 trade setup which is based upon Fibs, so we anticipate a downward liquidity as depicted.
EURUSD rises again amid growing Fed rate cut expectationsEURUSD rises again amid growing Fed rate cut expectations
On Friday, U.S. job data (NFP) showed an increase of just 73,000 for July—far below forecasts. This weak result suggests deeper problems in the labor market.
Many financial institutions now expect the Federal Reserve to cut interest rates in September. Markets are pricing in over 63 basis points of rate cuts by the end of the year.
Adding to uncertainty, President Donald Trump dismissed Bureau of Labor Statistics Commissioner Erika McEntarfer on Friday, accusing her of manipulating job data.
Investors are also concerned about the impact of Trump’s new tariffs, which could slow economic growth and push inflation higher.
Technical Analysis:
From a technical perspective, EURUSD broke below the neckline of a double top pattern, confirming the bearish setup.
The price hit the first downside target before bouncing back, likely driven by speculation around the NFP report.
Looking ahead, there's a strong chance EURUSD could begin another downward move from this zone, as suggested by our earlier chart analysis.
You may find more details in the chart!
Thank you and Good Luck!
PS: Please support with a like or comment if you find this analysis useful for your trading day
Disclosure: I am part of Trade Nation's Influencer program and receive a monthly fee for using their TradingView charts in my analysis.

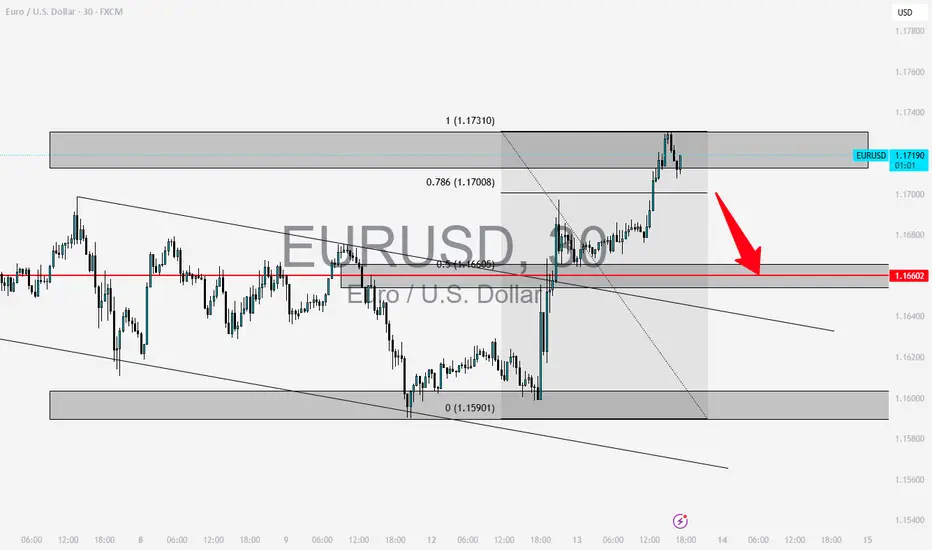
EUR USD - PRICE MAY FALL BACK TO 0.5 FIB LEVEL 1.16600 EUR USD here we can see that market created a new high of these week today, now price may take support at 1.16600,make a short entry as shown after breakout of 1.17008 keep a target at 1.16600 short trade, follow and check my page for more live updates...
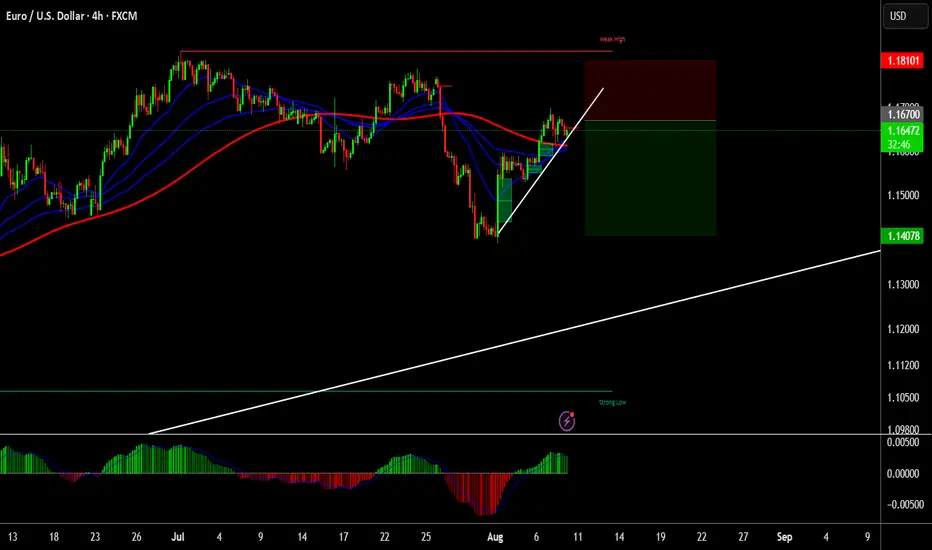
EUR/USD Bullish Breakout 4H 5Aug2025 | Targeting 1.18084EUR/USD has shown clear bullish momentum after bouncing off the support level at 1.14027, marking a higher low within a confirmed demand zone.
Key confirmations:
✅ CHoCH (Change of Character) confirms reversal.
✅ MACD crossover indicating bullish pressure.
✅ Breakout expected towards the target area (1.18084).
✅ Support from wedge breakout & upward channel.
📈 Eyeing a push to retest strong resistance near the previous high.
Plan:
Watch for consolidation or retest near 1.1580–1.1600 before entry. Bullish continuation likely if price holds above the demand zone.
📌 Target: 1.18084
🛑 Invalidation below: 1.14027
🕵️♂️ Monitor price action near demand zone and wait for bullish confirmation candle for optimal entry

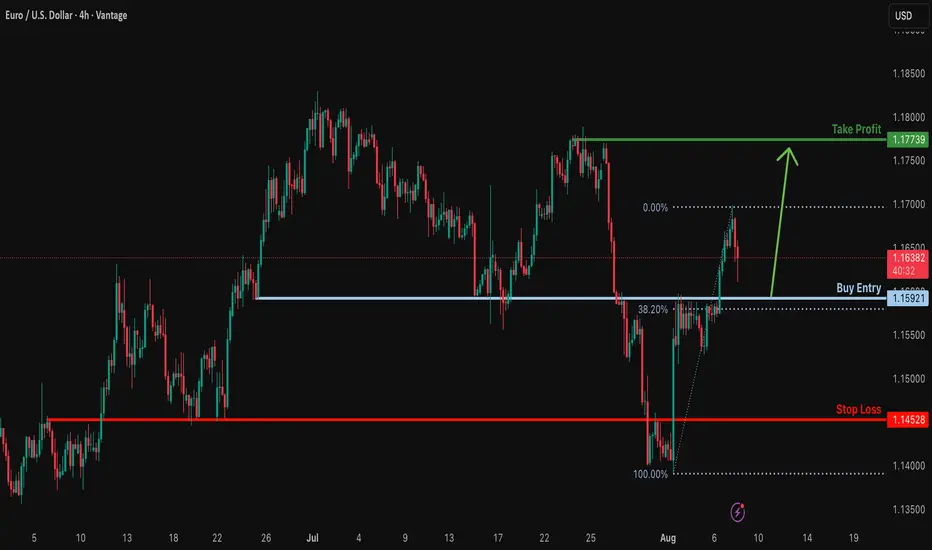
Bullish bounce off overlap support?EUR/USD is falling towards the support level which is an overlap support that aligns with the 38.2% Fibonacci retracement and could bounce from this level to our take profit.
Entry: 1.1592
Why we like it:
There is an overlap support level that lines up with the 38.2% Fibonacci retracement.
Stop loss: 1.1452
Why we like it:
There is a pullback support level that aligns with the 50% Fibonacci retracement.
Take profit: 1.1773
Why we llike it:
There is a swing high resistance.
Enjoying your TradingView experience? Review us!
Please be advised that the information presented on TradingView is provided to Vantage (‘Vantage Global Limited’, ‘we’) by a third-party provider (‘Everest Fortune Group’). Please be reminded that you are solely responsible for the trading decisions on your account. There is a very high degree of risk involved in trading. Any information and/or content is intended entirely for research, educational and informational purposes only and does not constitute investment or consultation advice or investment strategy. The information is not tailored to the investment needs of any specific person and therefore does not involve a consideration of any of the investment objectives, financial situation or needs of any viewer that may receive it. Kindly also note that past performance is not a reliable indicator of future results. Actual results may differ materially from those anticipated in forward-looking or past performance statements. We assume no liability as to the accuracy or completeness of any of the information and/or content provided herein and the Company cannot be held responsible for any omission, mistake nor for any loss or damage including without limitation to any loss of profit which may arise from reliance on any information supplied by Everest Fortune Group.
EURUSD 1H Supply Zone Rejection – Bearish Setup Loading!Price tapped into a clearly defined 1H supply zone, showing signs of rejection with multiple failed bullish attempts. Multiple rejections and liquidity sweeps have occurred at this level.
📉 Bearish Reaction Expected:
Price is currently forming lower highs inside the supply zone
Anticipated a final short-term push up (liquidity grab), followed by a sharp selloff
Bearish scenario confirmed if we break 1.16062 cleanly
🔻 Targets:
TP1: 1.16062 (near-term support)
TP2: 1.15401 (major demand zone)
🚨 Trade Idea:
text
Copy
Edit
Sell after final push into supply
SL: Above 1.17000
TP1: 1.16062
TP2: 1.15401
RR: ~2.5:1
🧠 Market Notes:
This setup is based on institutional supply/demand theory and visible range volume. Ideal for traders using Smart Money Concepts (SMC) or Order Flow approaches.
📌 Disclaimer:
This is not financial advice. Always do your own analysis before trading. Trade safe and manage risk.

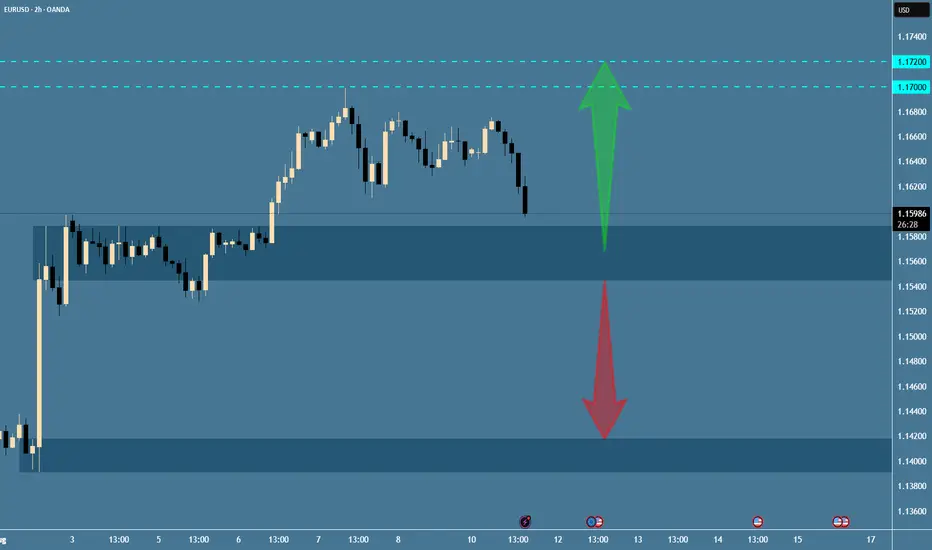
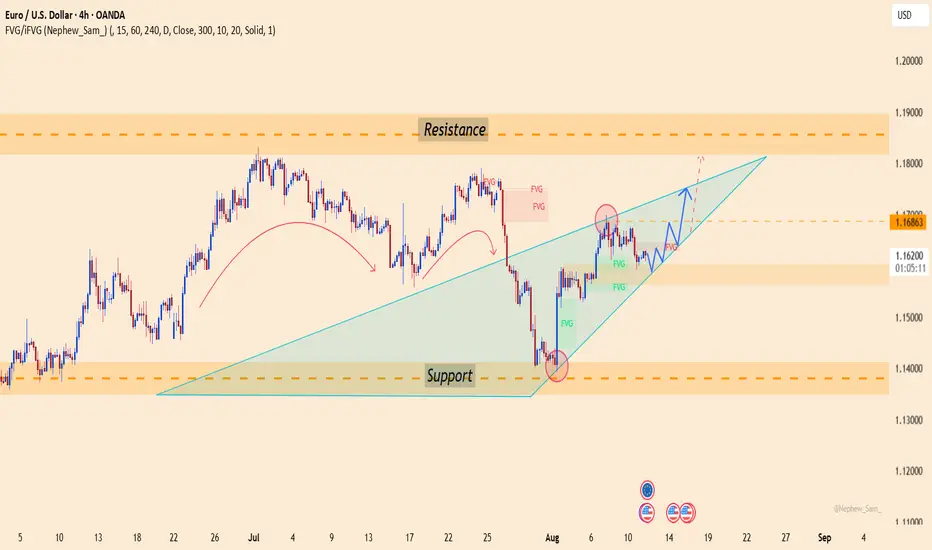
EURUSD: Uptrend Continues, Targeting New Resistance!Market Overview:
The CPI m/m was reported at 0.3%, higher than the expected 0.2%, boosting expectations that the Fed will continue to raise interest rates. Despite the strengthening USD, EURUSD continues its uptrend due to strong price structure and technical support in the short term.
Technical Analysis:
EURUSD is currently trading in an upward price channel, with strong support at 1.15800 USD. If the price maintains above this level, there is a high chance it will test the resistance at 1.16863 USD. If this resistance is broken, the price could continue to rise towards 1.17500 USD.
The chart shows that the upward price structure is supporting the trend, forming higher highs and higher lows, signaling the continuation of the bullish trend.
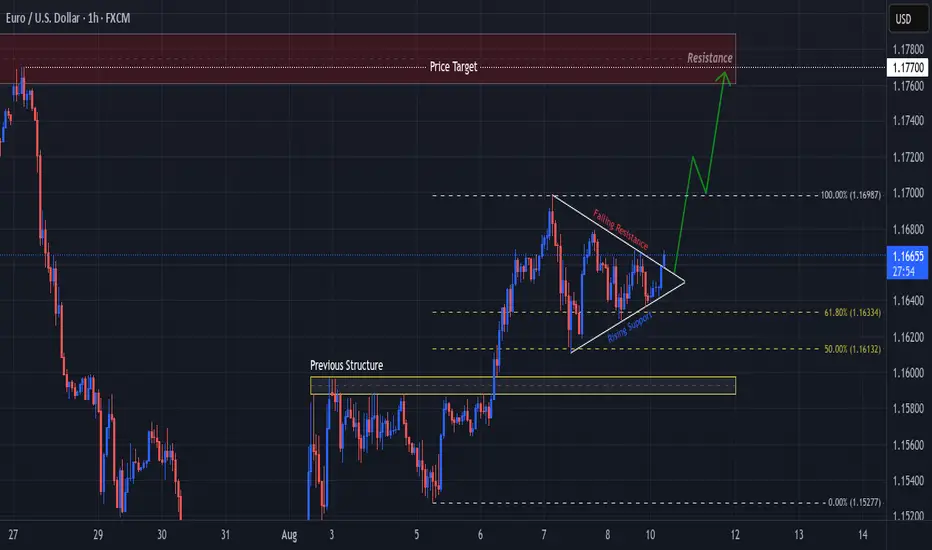
Pennant Breakout, EUR vs USD, Late July Highs Next?Price on FX:EURUSD has made a Pennant Breakout to the upside!
Next we will want to see a Retest to the Breakout of the Pattern and if successful, should be the Support Bulls need to take Price Higher!
The Late July Highs, last visited on July 27th @ 1.1770, will be the Price Target if the Breakout is Validated and Retest is Successful.
This week there is some heavy hitting news for the USD with CPI on Tuesday, PPI on Thursday and Retail Sales and Empire State Manufacturing (being forecast more bearish of all news) on Friday.