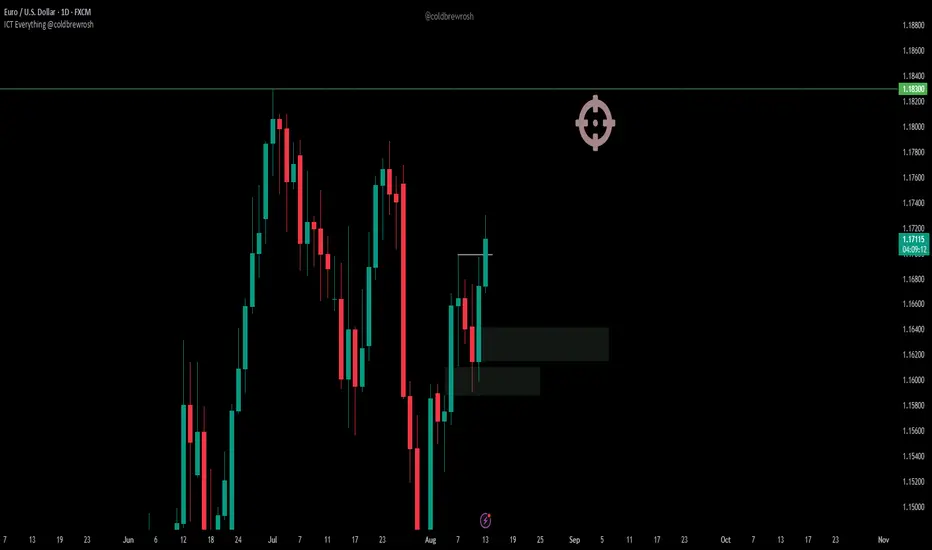
EURUSD Swing Outlook-Update/Market forecast!Following recent analysis!
EURUSD pushed price higher after CPI data,invalidating recent mapped internal structure.
Swing structure still remains Bearish and I am still looking for short positions targeting weak low.
Next few days i will be watching price closely as we are still trading with Fib key levels and price might seek to mitigate the supply zone before dropping.
Lets wait for clear internal structure shift !
EURUSD trade ideas

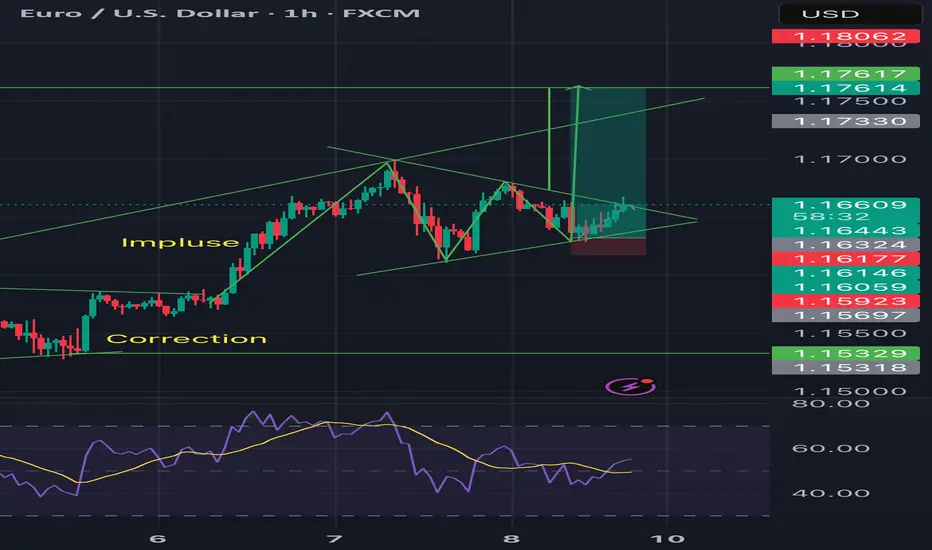
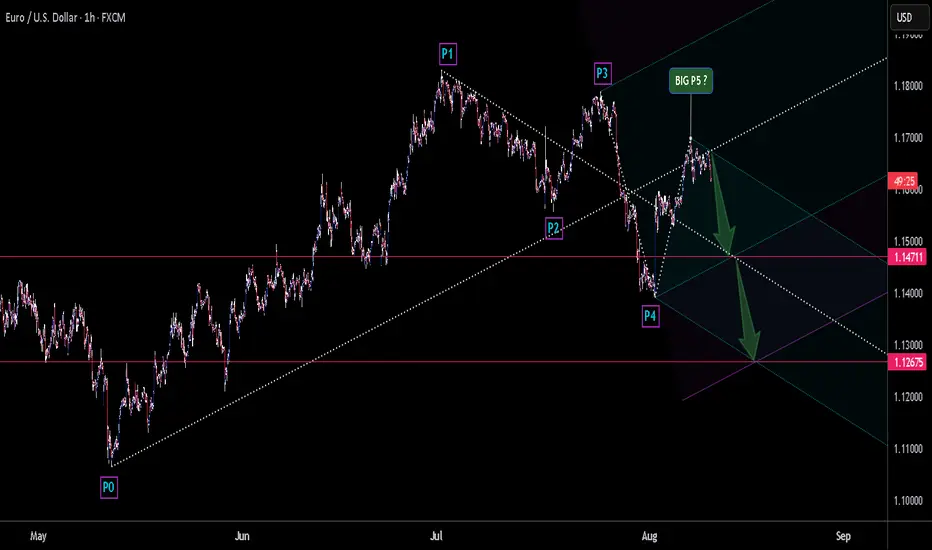
Potential Bullish Pennant on [EURUSD]I spotted a bullish pennant forming after a strong impulsive move upward. Price is currently consolidating in a tight range with lower highs and higher lows, forming the pennant shape.
I’m watching for a second breakout above the upper trendline with volume confirmation. My entry would be slightly above the breakout candle, with a stop loss below the pennant and TP based on the measured move from the previous impulse.
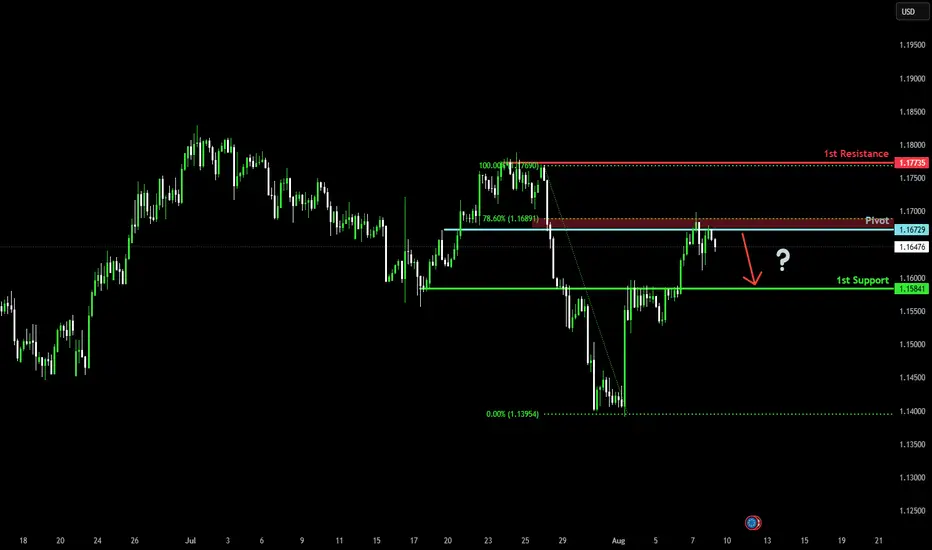
Potential bearish drop?The Fiber (EUR/USD) has rejected off the pivot which acts as a pullback resistance that is slightly below the 78.6% Fibonacci retracement and could drop to the 1st support.
Pivot: 1.1672
1st Support: 1.1584
1st Resistance: 1.1773
Risk Warning:
Trading Forex and CFDs carries a high level of risk to your capital and you should only trade with money you can afford to lose. Trading Forex and CFDs may not be suitable for all investors, so please ensure that you fully understand the risks involved and seek independent advice if necessary.
Disclaimer:
The above opinions given constitute general market commentary, and do not constitute the opinion or advice of IC Markets or any form of personal or investment advice.
Any opinions, news, research, analyses, prices, other information, or links to third-party sites contained on this website are provided on an "as-is" basis, are intended only to be informative, is not an advice nor a recommendation, nor research, or a record of our trading prices, or an offer of, or solicitation for a transaction in any financial instrument and thus should not be treated as such. The information provided does not involve any specific investment objectives, financial situation and needs of any specific person who may receive it. Please be aware, that past performance is not a reliable indicator of future performance and/or results. Past Performance or Forward-looking scenarios based upon the reasonable beliefs of the third-party provider are not a guarantee of future performance. Actual results may differ materially from those anticipated in forward-looking or past performance statements. IC Markets makes no representation or warranty and assumes no liability as to the accuracy or completeness of the information provided, nor any loss arising from any investment based on a recommendation, forecast or any information supplied by any third-party.
EU shortsLooking for shorts after Gu swept PDH, an S.M.T occurred aiming for PDL.
On the 4hr we happen to see another SMT occurring.
On the 15min i am looking for entries after i get a CISD.

EURUSD before inflation dataEURUSD remains range-bound ahead of the key U.S. inflation news scheduled for 1:30 PM (GMT+1).
We expect increased volatility following the release.
Wait for the market’s reaction and look for entries only once the main direction is confirmed.

EURUSD Swing outlook! Do you Think EU will sell today? EU Swing analysis H8 Timeframe.
Overall trend is bullish price is pulling back to discounted levels
Current PA:
Trend Bearish
Phase Corrective
Price has pulled back into premium levels, mitigated the 70.5% & 79.5%
with multiple wick rejections. I am expecting sells, targeting the weak low

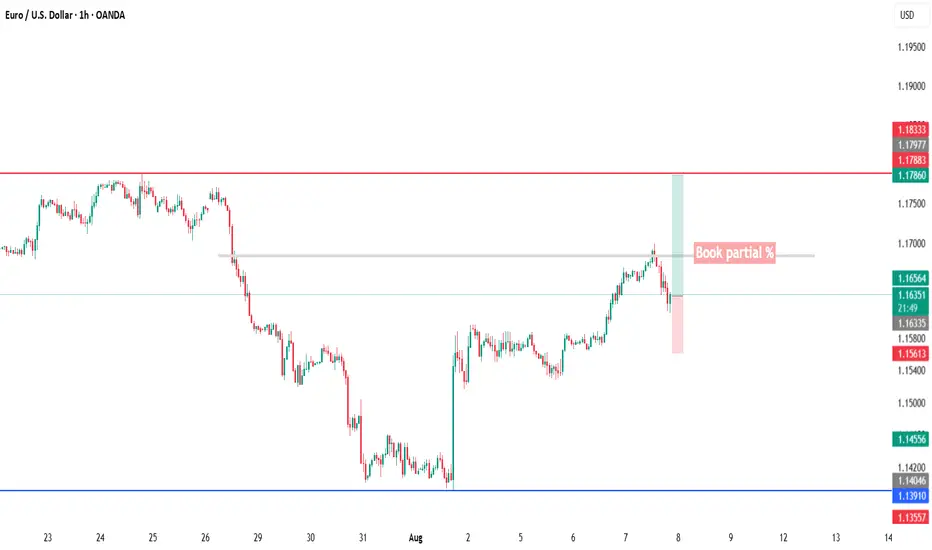
EURUSDEURUSD Buy Call
Partial booking is must, Manage risk and reward!
USD Still in bearish cotinuation as well as DXY
Keep looking for longs on EUR/USDAfter CPI release we have a confirmation that correction is over and we should await new lows on DXY.
We should ideally not go below the daily orderblock formed on Tuesday 12.08.
We might get a correction to daily ob, but don't be surprised if the price continues to grow.
My advice is to wait for liquidity raids and ote entrys, get your confirmation and lets continue making profits.
Euro dollar rollover at the ML & at resting on the edge of priceThere is plenty more going on via Gann MTF & Annual Forecast but technically on the forks the Euro should head to the new median line with approximately an 80% probability. If we get momentum on the sell off and later the new median line ( Downward Pitchfork ) gets breached decisively via a Zoom Bar/Retest, we may get all the way down to the second target as shown. looking for additional shorts on the lower TF. Cheers
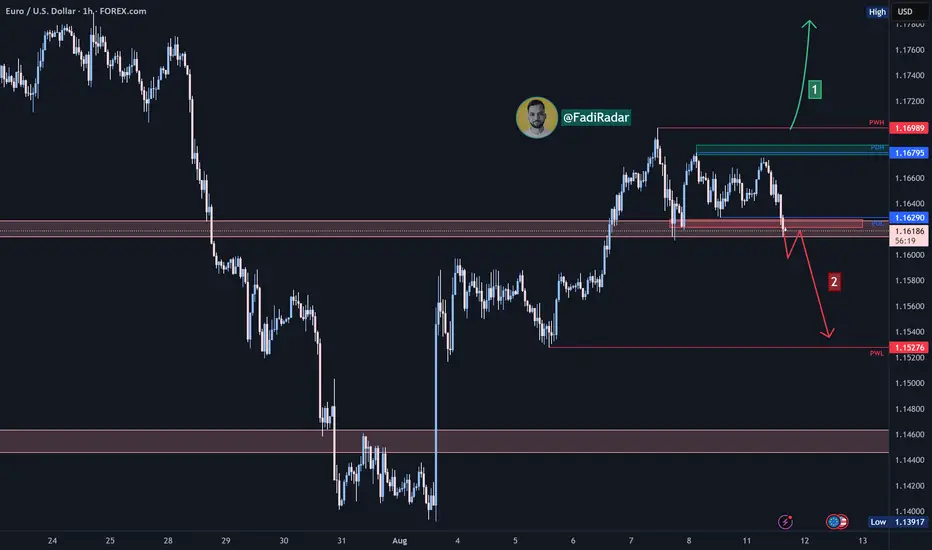
EUR/USD Analysis:The price is moving sideways between the $1.162 support area and the $1.168 resistance area.
A break and close above $1.168 could push the price toward testing $1.177.
A break below the $1.161 support and close under it may lead to a retest of $1.157, followed by $1.153, which is a potential reversal zone.
⚠️ Disclaimer:
This analysis is not financial advice. It is recommended to monitor the markets and carefully analyze the data before making any investment decisions.
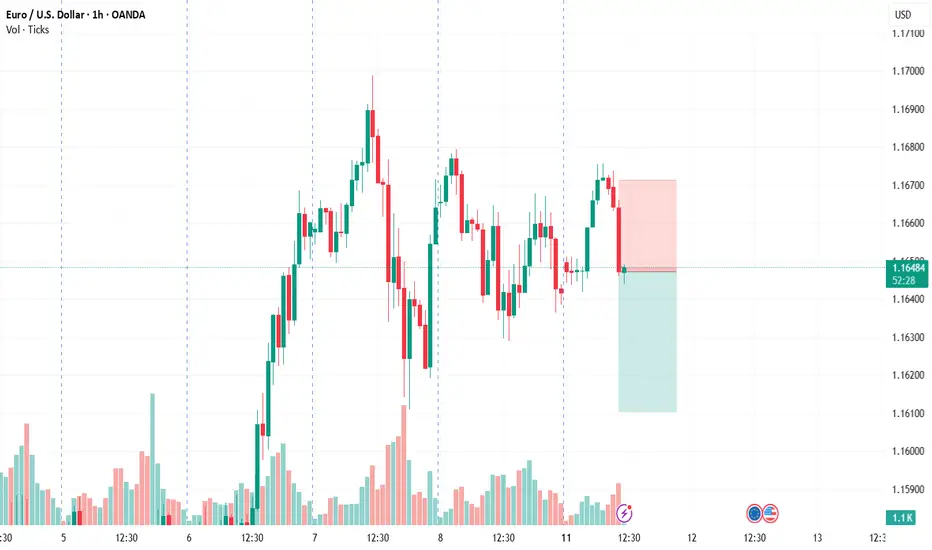
EUR/USD MA Breakout Short Setup
Price has broken below the moving average, signaling potential bearish momentum. A short entry is placed at 1.16472 with a stop-loss at 1.16714 to protect against upside reversals. The take-profit target is set at 1.16105.
Risk-to-Reward Ratio: ~1.29
EURUSD - General dynamics and rangesCurrent technical status (Daily/Weekly)
After breaking through the key support at ~1.1445 and then rebounding, EUR/USD is moving up within a steady daily trend, confirmed by the formation of the morning star candlestick pattern, with the short-term target at 1.1800.
The monthly chart shows the development of an upward trend from the October 2025 closing level, with the target of raising prices to 1.1710, but a correction to 1.1588 — the 14.6% Fibonacci retracement level — is possible.
Short-term levels (H1–H4)
Support:
1.1500–1.1480 — the buy zone, from where a reversal has already occurred; the stop level should logically be placed below 1.1440.
Resistance:
1.1600–1.1680 — the near zone, then — 1.1700 and 1.1800 if growth continues.
General dynamics and ranges
The week from August 4 to 8 was characterized by a slowdown in growth, fluctuations in the range of 1.1390–1.1500. The MACD and Stochastic indicators reflect the sellers' momentum, but the oversold situation can provoke a local rebound — growth is possible only with a breakout of 1.1550.
The 1.1650 level is a historically significant barrier. It coincides with the 50% Fibonacci correction and a number of moving averages. Its breakout will open the way to the 1.1700–1.1750 zones. Otherwise, a rollback to 1.1580–1.1530–1.1500 is likely.

EURUSD Analysis week 33🌐Fundamental Analysis
The US Dollar (USD) struggled to find buying momentum on Thursday, but the EUR/USD pair struggled to build upside momentum. The US economic calendar will not release any macroeconomic data that could boost USD valuations over the weekend. Therefore, investors may pay attention to comments from Federal Reserve officials and risk sentiment.
A bullish move on Wall Street after the opening bell could limit the USD’s upside momentum and help the EUR/USD pair find support. Conversely, the pair could continue to decline if the market turns cautious in the second half of the day.
🕯Technical Analysis
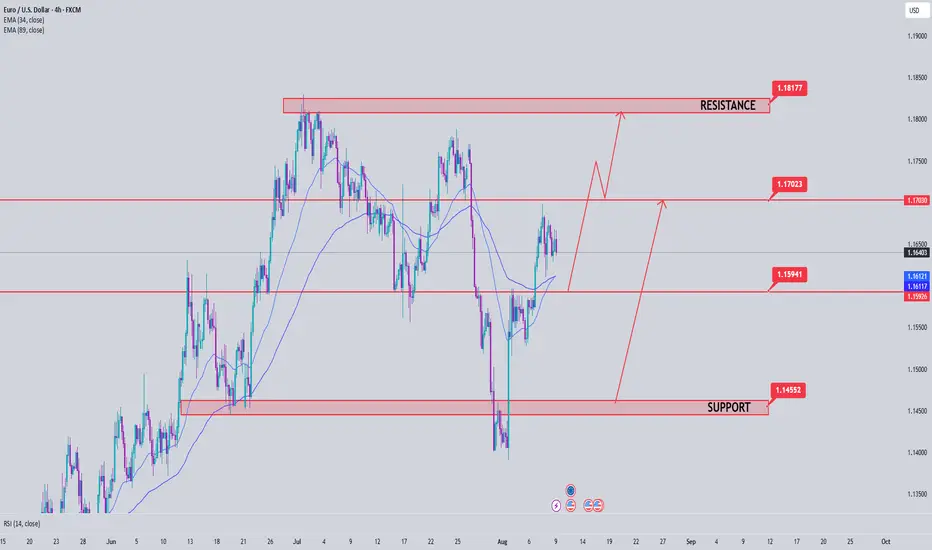
EURUSD is still trading in an uptrend and is facing resistance at 1.170. A break above 1.160 forms a lower boundary support zone that should prevent further downside. Pay attention to the resistance and support zones noted on the chart to have a strategy when there is a price reaction in that area.
📈📉KEY LEVEL
Support: 1.160-1.145
Resistance: 1.170-1.181
EURUSD – DAILY FORECAST Q3 | W32 | D8 | Y25📊 EURUSD – DAILY FORECAST
Q3 | W32 | D8 | Y25
Daily Forecast 🔍📅
Here’s a short diagnosis of the current chart setup 🧠📈
Higher time frame order blocks have been identified — these are our patient points of interest 🎯🧭.
It’s crucial to wait for a confirmed break of structure 🧱✅ before forming a directional bias.
This keeps us disciplined and aligned with what price action is truly telling us.
📈 Risk Management Protocols
🔑 Core principles:
Max 1% risk per trade
Only execute at pre-identified levels
Use alerts, not emotion
Stick to your RR plan — minimum 1:2
🧠 You’re not paid for how many trades you take, you’re paid for how well you manage risk.
🧠 Weekly FRGNT Insight
"Trade what the market gives, not what your ego wants."
Stay mechanical. Stay focused. Let the probabilities work.
FX:EURUSD

MORNING FORECAST LESSONHarnessing the Power of Morning Rituals to Enhance Your Forecasting Skills
The Art of Intuition: How to Read the Signs in Your Morning Forecasting
Creating a Forecasting Vision Board: Stacking Confluences for a Bright Day
The Hidden Connections: How Nature's Patterns Can Influence Your Morning Forecasts
Awakening Creativity Through Morning Confluence Practices for Forecasting Success

EURUSD ShortsEURUSD rallied today after Core CPI announcement and we also have another high level news event tomorrow that might cause some volatility in price. I am still looking for lower prices on EURUSD to outlined levels
EUR/USD Robbery Blueprint Bear Strike Activated!💣🎯Operation Fiber Down: EUR/USD Robbery Blueprint (Day Trade Edition) 💰🔫
🚨 Thieves, Hustlers & Chart Bandits Assemble! 🚨
🌍 Hi! Hola! Ola! Bonjour! Hallo! Marhaba! 🌍
Welcome back to another Thief Trading Operation, where the money never sleeps—and neither do we. Let’s break into the vault of EUR/USD “The Fiber” with surgical precision. 🧠💼🕶️
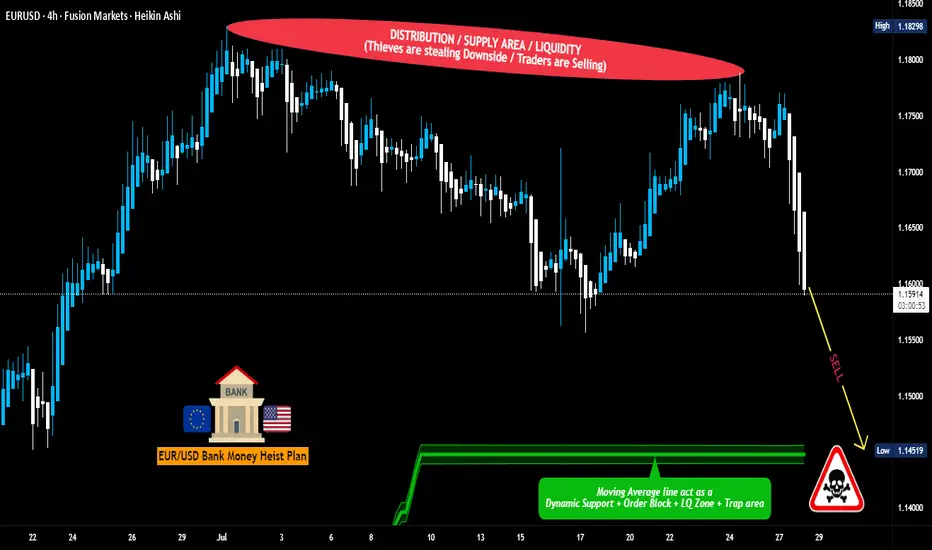
🧨 THE MASTER ROBBERY PLAN: EUR/USD SHORT STRIKE 🔍💸
💀 Market Bias: Bearish – Trend Reversal + Supply Trap Setup
🎯 Target: 1.14600
🛑 Stop-Loss: Near Swing High (around 1.16700 – 4H chart view)
🕓 Timeframe Focus: 15m / 30m / 3H
🧭 ENTRY ZONE:
👣 Plan your entry from recent high retests—that’s where the big money bulls get trapped.
🎯 Use Sell Limit Orders (DCA style / Layered Limit Orders) like a true thief setting up tripwires.
💼 RISK STRATEGY:
💡 SL should match your lot size and order count—not one-size-fits-all!
📌 Place above key structure or swing level (e.g. 1.16700) based on timeframe.
🔍 BEHIND THE SCENES – THE WHY:
The EUR/USD "Fiber" pair is showing all the classic signs of a trend shift and bear raid setup, including:
📰 Fundamentals weakening the Euro
💣 COT Report reveals institutional exits
🍂 Seasonal Bias points to downward trend
📉 Intermarket Pressure from bond yields & USD strength
📊 Sentiment turning overly bullish = trap zone
⛽ Storage & Inventory imbalances adding fuel
📌 Reminder: Before any robbery, study the layout—Macro, Fundamentals, Sentiment, and Intermarket are your blueprint.
🚨 HEIST ALERT – PROTECT THE LOOT:
🕰️ High-Impact News Events? Tighten up!
💼 Don’t take fresh entries during releases.
🔐 Use Trailing SLs to lock in profits.
🎯 Exit with grace before the sirens start.
⚡🔥JOIN THE CREW, BOOST THE LOOT🔥⚡
💥 Smash the Boost Button 💥 if you're vibing with the Thief Trading Movement.
We ain’t just trading—we’re executing strategic robberies on the market’s weaknesses.
🧠💪 Every like = more power to the crew. Every comment = a new map to a vault.
We rob, retreat, and repeat. Let’s make money with skill, not luck. 🕶️💰🚁
⚠️ LEGAL COVER (For the Lawyers 😏):
This plan is not investment advice, just an organized heist blueprint by chart robbers.
Always manage your own risk and update your plan as the market evolves.
🕶️ Stay ready for the next master plan... Until then, keep your charts clean and your stops tight. 🕶️💣📉
– Thief Trader Out 🐱👤🚀
EURUSD stops at the SMA200, ready to pullback.EURUSD stops at the SMA200, ready to pullback.
The pair has been forming the bearish wedge since the April 2025 till July 2025. At the end of July the lower border of the pattern got broken and the price has rapidly reached the 1.14000 support level. Then the rebound from this level occurred and currently the price is retesting the lower border of the wedge from below. Additionally, the SMA200 is situated just above the current price, which is a fair argument for the price to pullback in the nearest future. The price is expected to decline with a first target of 1.14000.

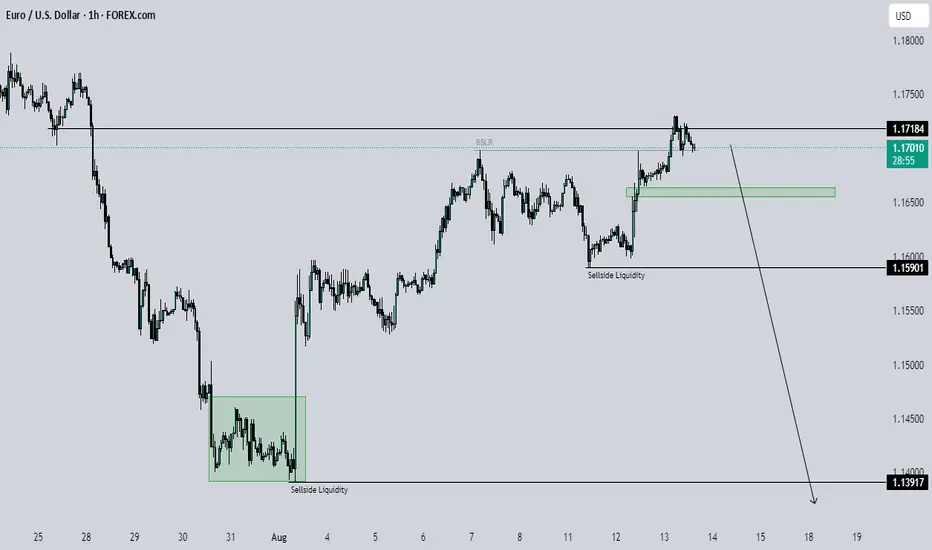
EURUSD – Target: 1,1731EURUSD reached 1,1668, confirming the uptrend on the 1-hour chart.
The next target is a breakout above 1,1731.
At the current levels, the risk-to-reward ratio is not favorable.
Wait for a pullback to look for new entry opportunities.

EVENING FORECASTINGHey traders I have just shared the processess I normally do when it comes to wesday so that you can look the process behind when doing all of these work and if you have any questions please do let me know I am more than happy to help and give some clear details just comment and will get back to you!

EUR/USD - Potential Targets Dear Friends in Trading,
How I see it: (A different perspective)
** POC = Institutional Point of Control
KEYNOTE:
Via the grape vine: 95% chance of FED $ rate cut in September.
We are already seeing the institutional adjustments in this regard.
I will wait for price to correct/retrace back to break-out support area.
Only then will I go through my process of confirmations to look for a "LONG" entry.
I sincerely hope my point of view offers a valued insight
Thank you for taking the time study my analysis.

EUR/USD Resistance Test as USD Tests SupportEUR/USD bears haven't been able to re-take control since the jarring pullback after the August 1st NFP report. But, that said, there may be more attractive areas to look for that USD-weakness to continue, such as GBP/USD.
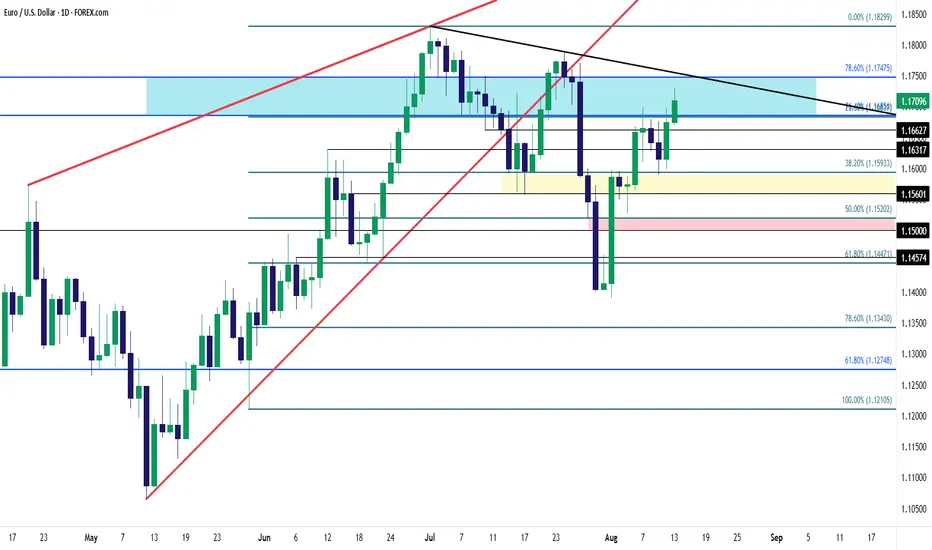
While Trump is pushing hard for rate cuts in the U.S. and markets are highly expecting that in September with at least one and perhaps two more by the end of the year, the USD continues to hold higher-lows from July, with a big spot of support currently in-play. And in the mirror image of that move, we have lower-low and lower-high structure that remains in-play on EUR/USD daily. Shorter-term we have seen bulls continue to chew back parts of that prior sell-off, with short-term resistance-turned-support at the 1.1593 level, followed by a venture back up to the 1.1686 level. Now bulls are driving above that, extending the short-term bounce, and this exposes two key levels in the pair.
At 1.1788 we have the lower-high from mid-July. This is the level that sellers would need to hold to retain that bearish structure that had built last month. And below that, we have the 78.6% Fibonacci retracement at 1.1748, which is confluent with a bearish trendline taken from those lower-highs as we move towards later this week or early next week.
If we are going to see continued breakdown in the USD, we're probably going to need to see the Euro onload some strength as it's a 57.6% weighting in the DXY basket. But, in that scenario, I still think Cable (GBP/USD) could be a more attractive venue for that theme. - js