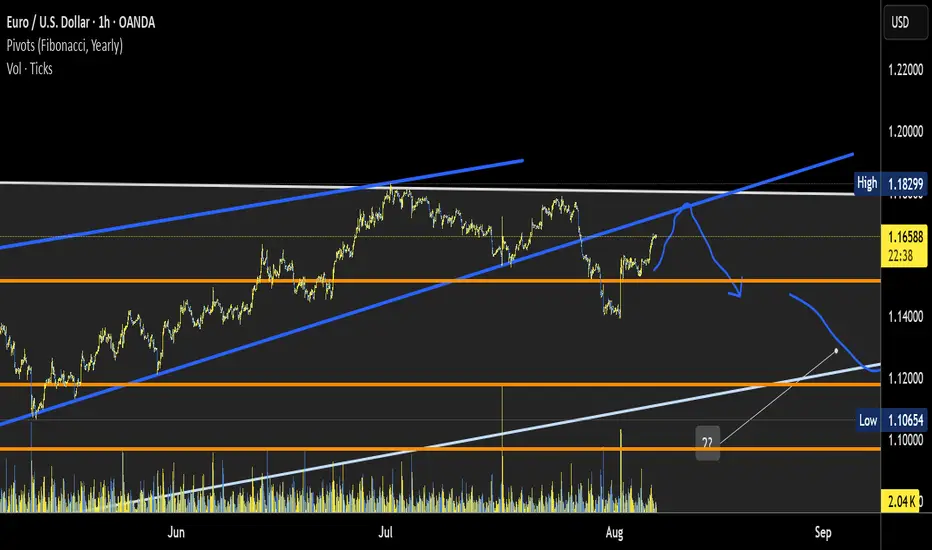
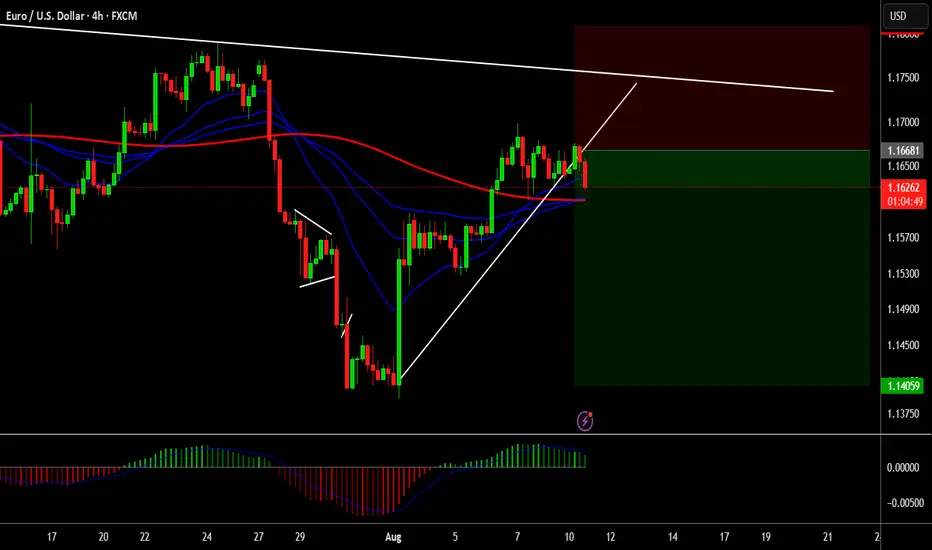
EUR USD potential roadmapLooking for entry signal for weaker EUR favouring a major ABC -C leg down perhaps W2 ends. Currently looks like end of minor abc - c leg up at resistance (blue trendline)
EURUSD trade ideas
EURUSD – Eyes on the Supply Zone Before the Big DropRight now, I see EURUSD gearing up for a bigger fall. The recent price rejection and break below key fib levels hint at strong bearish pressure. My expectation is for the price to head toward the highlighted Supply Zone around 1.1553.
If the market respects this zone, we could see a short-term bounce. But if price breaks and closes below it, I’m looking for a bearish continuation toward deeper levels near 1.1518 and possibly 1.1494.
The EMA is also above current price action, adding extra weight to the bearish bias. For me, this setup signals a “stay short until proven otherwise” approach.
📉 Bias – Bearish towards the Supply Zone
📍 Key Break Point – 1.1553 zone
🎯 Next Targets if broken – 1.1518 / 1.1494

EURUSD: Will Go UP! BUY!
My dear friends,
Please, find my technical outlook for EURUSD below:
The price is coiling around a solid key level - 1.1623
Bias - Bullish
Technical Indicators: Pivot Points Low anticipates a potential price reversal.
Super trend shows a clear buy, giving a perfect indicators' convergence.
Goal - 1.1671
Safe Stop Loss - 1.1587
About Used Indicators:
The pivot point itself is simply the average of the high, low and closing prices from the previous trading day.
Disclosure: I am part of Trade Nation's Influencer program and receive a monthly fee for using their TradingView charts in my analysis.
———————————
WISH YOU ALL LUCK

EUR/USD - RISKY PlayShorting EURO as we head into the weekend
Looking for a reversal and claw back on gains after the positive news at the end of last week
Bulls running out of steam, US releasing relatively positive news on SEC chair
Lets see how we go!
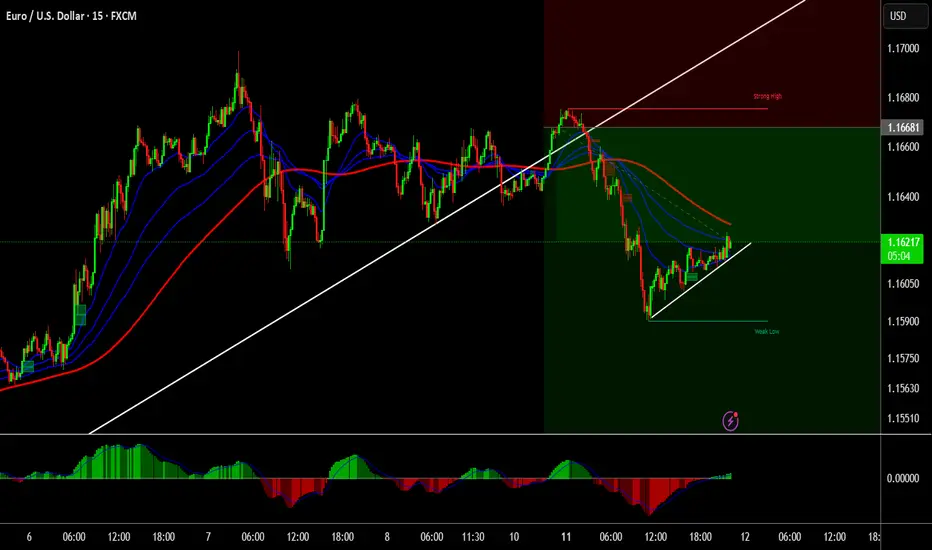
EURUSD - Current technical pictureCurrent technical picture
The euro strengthened after weak US employment data and broke above 1.1670, which greatly improved its technical sentiment
The pair is currently testing its 200-hour moving average (≈1.1578) - stability above this level indicates confident interest in the euro
The price has broken the 50% retracement level of the decline from the July 1 high (≈1.16098) and has already reached the 61.8% level (≈1.1661), which previously served as resistance in mid-July
EURUSD long position 12/08/2025English : According to our analysis, we anticipate a bullish scenario.
Morocan Darija : kanchofo d'apres l'analyse dyalna antsanaw tloo3
ATENTION : I only share my ideas, not signals
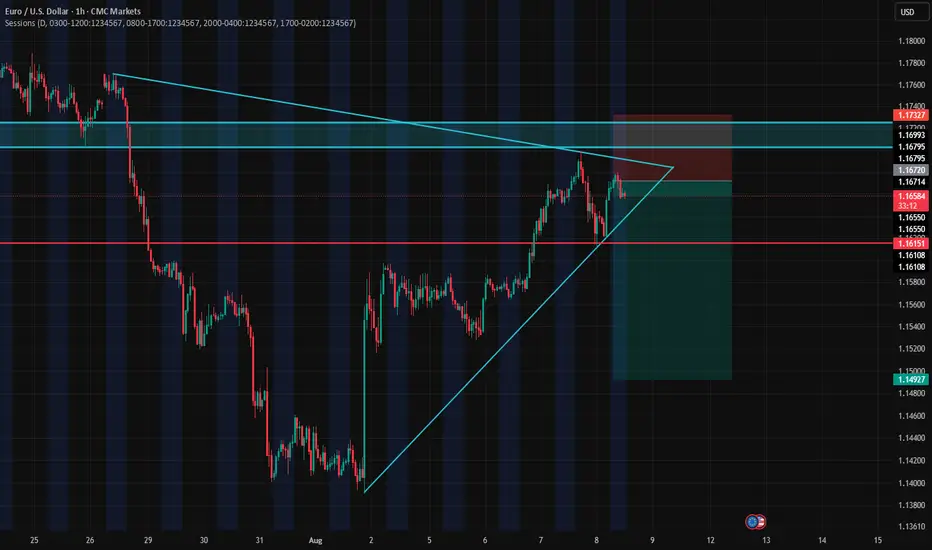
EUR/USD Breaking Point! ALERT Price action is coiling up in a tight triangle and a breakout is imminent! See how the ABCDE pattern on the chart is setting up for a potential explosive move. Will EUR/USD surge higher or drop to key support?
I've mapped out BOTH scenarios with clear technical targets—don’t miss your chance to catch the next big wave!
💡 Tap "Boost" if you found this analysis helpful.
📈 Follow my page for daily actionable trading setups!
👇 Drop your predictions in the comments below—are you bullish or bearish on EUR/USD this week?
Let’s win together!

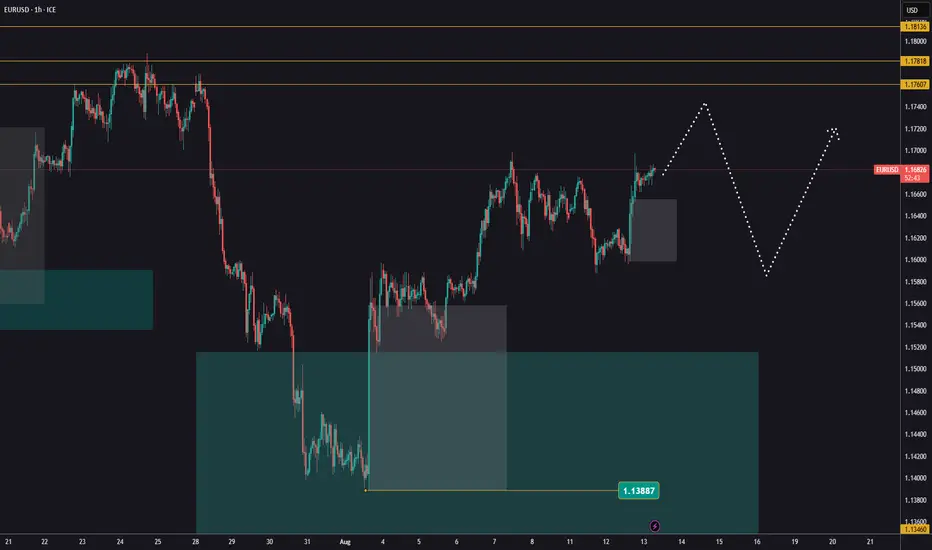
Long EURUSDPrice will push up to fill the gap
Even though 1D chart is in the short trend
But the price need to go back to fill the gap
If the price still not break the sell trend of 1D
then it will head back down to fill 1.10 imbalance below
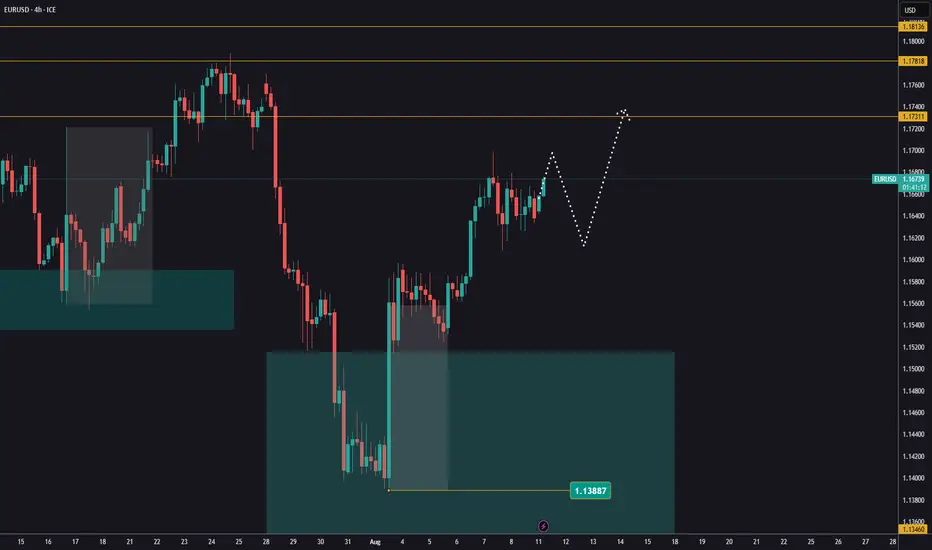
EURUSD after the newsYesterday, EURUSD continued its bullish move, reaching 1,1697.
If the rally continues, the next target is 1,1760.
Some pullbacks are still possible before breaking above the previous high, which could provide opportunities for additional entries.
Focus only on trades in the main direction!
EUR/USD short in profitIf you caught the setup I shared last week, you should be seeing some early-week profits.
From here, it’s all about managing the trade according to your plan.
Personally, I’m confident in finding quality entries, so I don’t mind keeping a tight stop and re-entering if needed.
EURUSD uptrendEURUSD remains in a sideways range.
The overall trend is bullish, but a short-term pullback is possible.
Tomorrow’s U.S. inflation data could influence the market and present additional opportunities.
Reduce your risk and avoid rushing into new positions.
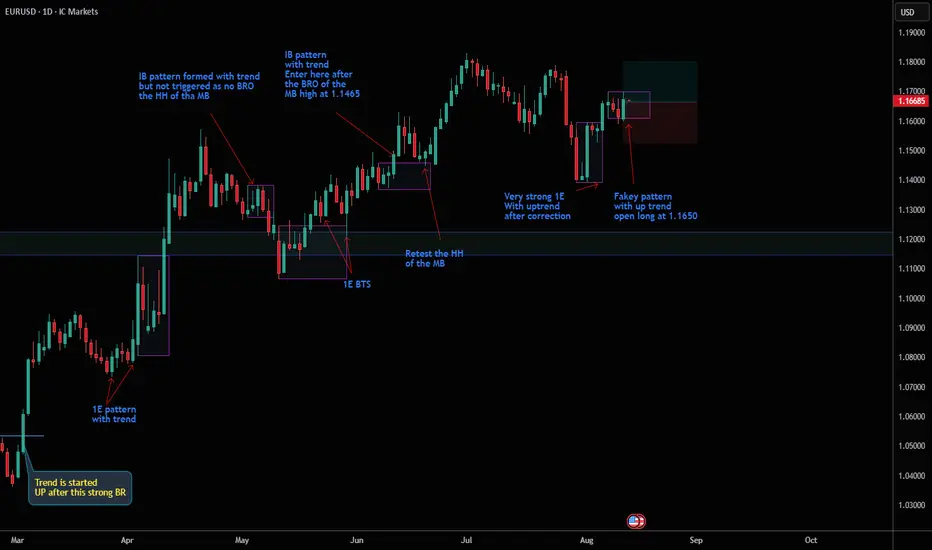
Fakey pattern with up trend The trend is up
Fakey pattern is formed after a small correction
this setup id valid
I opened long at 1.1650
SL 1.1550
TP 1.1800
ICC structure forming. Correction is happening now, looking for more downside. Stop loss can be set to break even from the initial move if desired.
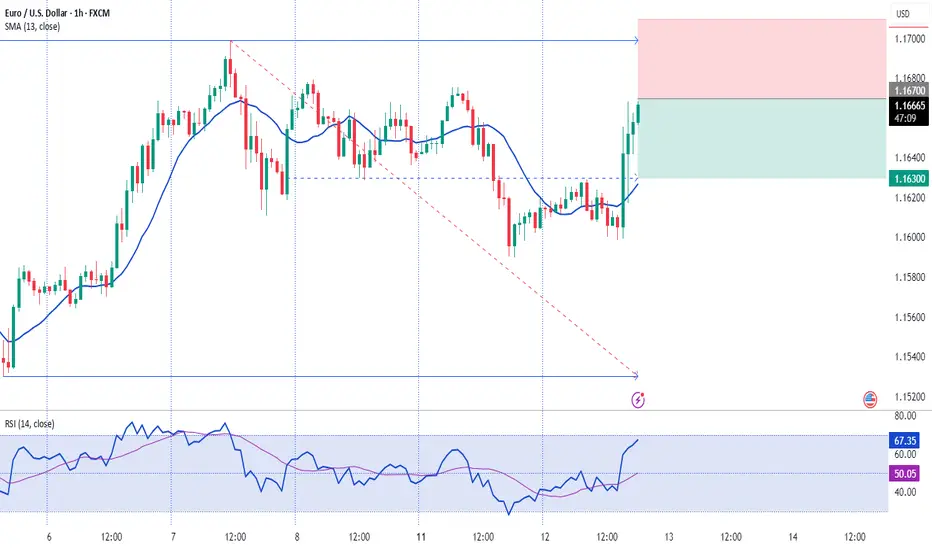
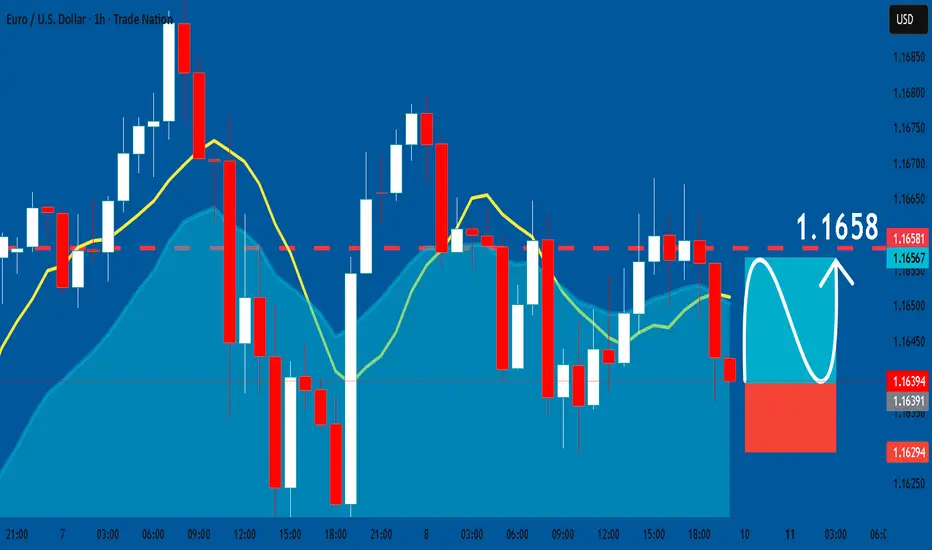
EURUSD: Long Signal Explained
EURUSD
- Classic bullish formation
- Our team expects growth
SUGGESTED TRADE:
Swing Trade
Buy EURUSD
Entry Level - 1.1639
Sl - 1.1629
Tp - 1.1658
Our Risk - 1%
Start protection of your profits from lower levels
Disclosure: I am part of Trade Nation's Influencer program and receive a monthly fee for using their TradingView charts in my analysis.
❤️ Please, support our work with like & comment! ❤️
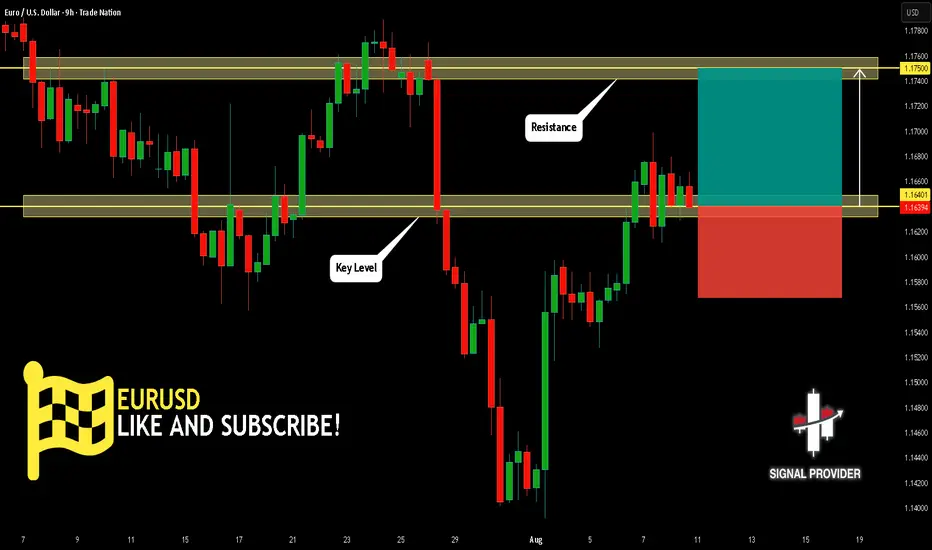
EURUSD Will Go Higher! Buy!
Please, check our technical outlook for EURUSD.
Time Frame: 9h
Current Trend: Bullish
Sentiment: Oversold (based on 7-period RSI)
Forecast: Bullish
The market is approaching a significant support area 1.164.
The underlined horizontal cluster clearly indicates a highly probable bullish movement with target 1.175 level.
P.S
Overbought describes a period of time where there has been a significant and consistent upward move in price over a period of time without much pullback.
Disclosure: I am part of Trade Nation's Influencer program and receive a monthly fee for using their TradingView charts in my analysis.
Like and subscribe and comment my ideas if you enjoy them!
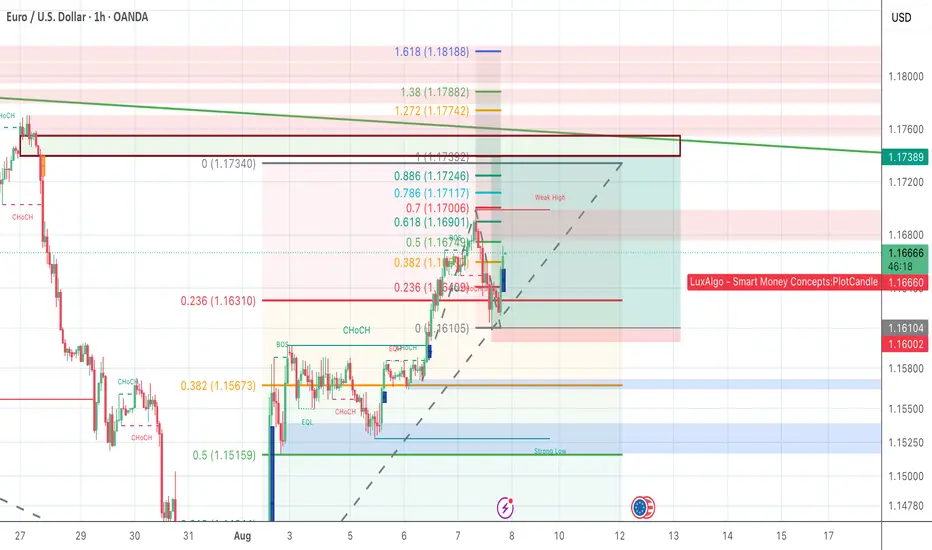
EUR/USD – Day 12 of 100 Days Analysis
We’re closely watching price action around the 1.16164 demand zone. If price holds above this range and breaks 1.16472, we may see a bullish continuation up to 1.17060.
🔍 Smart Money Perspective:
Price may dip below the minor low to sweep liquidity
Retest around 1.16472 can offer a long opportunity
Target Zones:
🟢 TP1 – 1.16722
🟢 TP2 – 1.17060
⚠️ Risk Zone:
Below 1.16164, invalidation for longs. Break of 1.15981 = bearish shift.
📆 Recorded on: August 7, 2025
📍 Session: New York
💥 Watch this level-by-level roadmap unfold and stay consistent through 100 days of EUR/USD analysis!
👇 Comment your bias – Bullish or Bearish?
#forexsignals #eurusdanalysis #tradingview #priceactiontrader #forexchart #technicalanalysis #traderlifestyle #nyopen #smcforex #forexjourney

EURUSD; Heikin Ashi Trade Idea📈 Hey Traders!
Here’s a fresh outlook from my trading desk. If you’ve been following me for a while, you already know my approach:
🧩 I trade Supply & Demand zones using Heikin Ashi chart on the 4H timeframe.
🧠 I keep it mechanical and clean — no messy charts, no guessing games.
❌ No trendlines, no fixed sessions, no patterns, no indicator overload.
❌ No overanalyzing market structure or imbalances.
❌ No scalping, and no need to be glued to the screen.
✅ I trade exclusively with limit orders, so it’s more of a set-and-forget style.
✅ This means more freedom, less screen time, and a focus on quality setups.
✅ Just a simplified, structured plan and a calm mindset.
💬 Let’s Talk:
💡Do you trade supply & demand too ?
💡What’s your go-to timeframe ?
💡Ever tried Heikin Ashi ?
📩 Got questions about my strategy or setup? Drop them below — ask me anything, I’m here to share.
Let’s grow together and keep it simple. 👊

EurusdNy Reversal trade
Only perfect W formation with a 5/13 Cross will possibly give is a 1 % win ratio
TDI sharkfin low
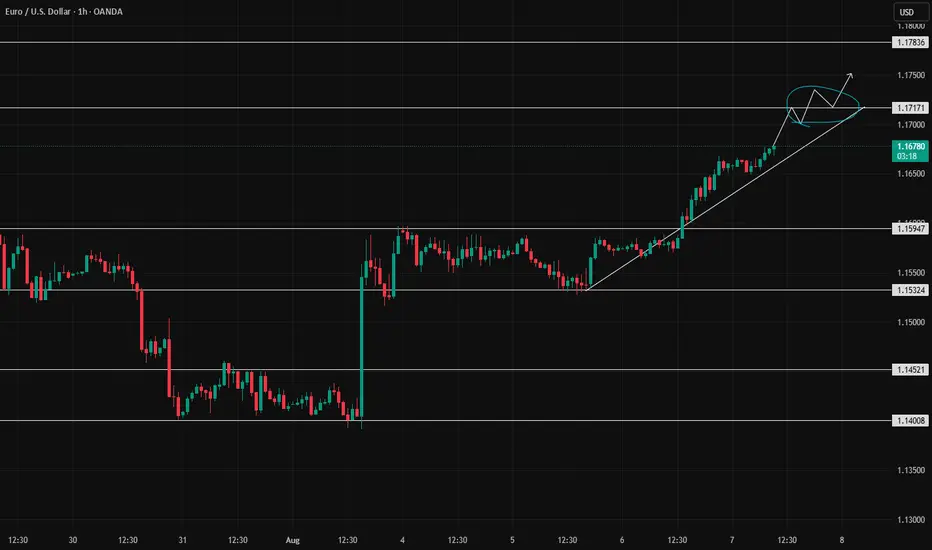
EURUSD - We Joined If you follow my previous analysis, we joined the trend to the next level.
Risking 9 Pips, we are aiming for a 1:10+

1.17171 is the decision point.As long as the price hasn't reached that level, no position should be opened.
We need to wait for it to reach that level and then, based on the reaction to that point, see whether the trend will continue or turn bearish.
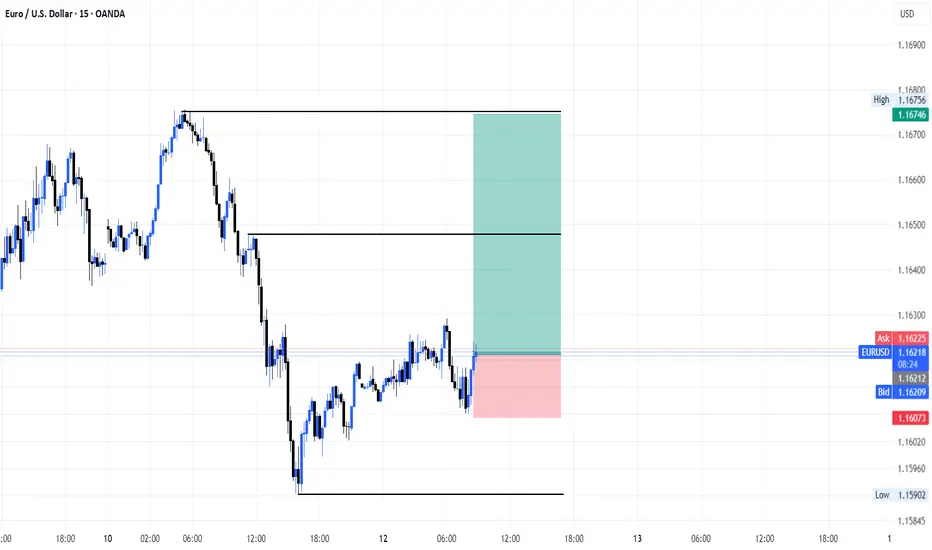
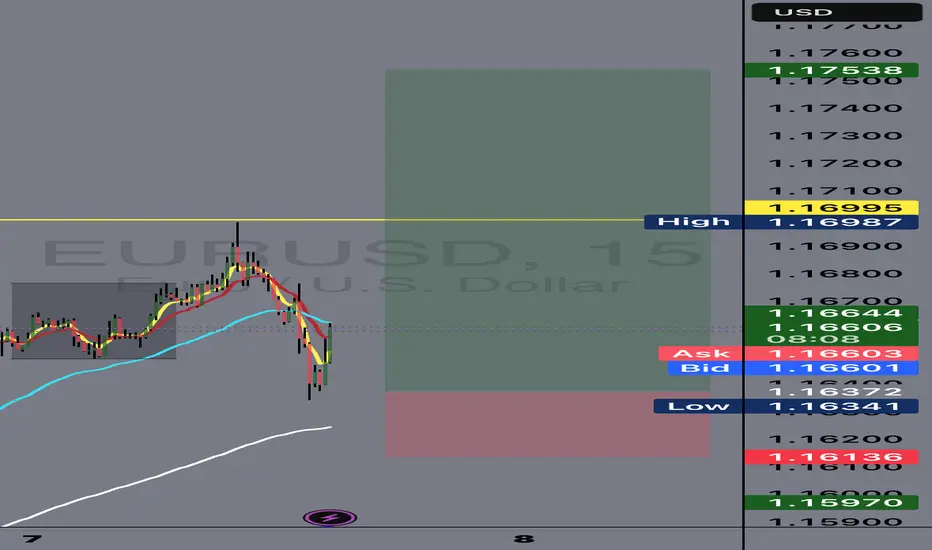
Eurusd Buy Setup | 11 august
EUR/USD (Euro vs. US Dollar)
Timeframe:1 5 minutes
Broker Feed: OANDA
Session Indicator: Shows global market sessions — New York, London, Tokyo, Sydney.
Price Levels Marked:
Entry Zone: Around 1.16187 (current price)
Stop-Loss (SL): 1.16141 (highlighted in pink below entry)
Take-Profit (TP): 1.16319 (highlighted in red zone above entry)
Risk-Reward Ratio: The green (reward) area is much larger than the red (risk) area, indicating a favorable R:R setup.
Trade Idea:
Price is expected to dip slightly (gray curved arrow down) before moving upward toward the target zone.
The red rectangle above marks a supply/resistance zone where the trader expects to take profit.
The pink area below is the risk zone leading to stop-loss if price goes against the trade.
Visual Indicators:
Green Zone: Profit target area.
Red/Pink Zone: Risk area.
Gray Arrows: Expected price path prediction.
Labels: Exact price points for SL, TP, and key intermediate levels.
If any doubt feel free to Comment

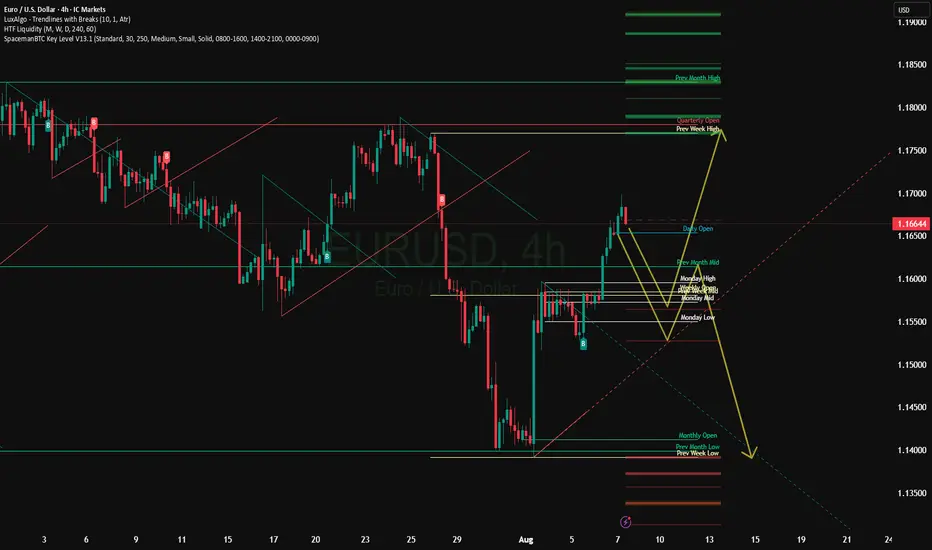
EURUSD – DAILY FORECAST Q3 | W33 | D11 | Y25
📊 EURUSD – DAILY FORECAST
Q3 | W33 | D11 | Y25
Daily Forecast 🔍📅
Here’s a short diagnosis of the current chart setup 🧠📈
Higher time frame order blocks have been identified — these are our patient points of interest 🎯🧭.
It’s crucial to wait for a confirmed break of structure 🧱✅ before forming a directional bias.
This keeps us disciplined and aligned with what price action is truly telling us.
📈 Risk Management Protocols
🔑 Core principles:
Max 1% risk per trade
Only execute at pre-identified levels
Use alerts, not emotion
Stick to your RR plan — minimum 1:2
🧠 You’re not paid for how many trades you take, you’re paid for how well you manage risk.
🧠 Weekly FRGNT Insight
"Trade what the market gives, not what your ego wants."
Stay mechanical. Stay focused. Let the probabilities work.
FX:EURUSD
