Short EURUSDOn the Daily time frame the EU is on a downtrend and has create a BOS...for me this a ia sell bais
EURUSD trade ideas
EURUSD(20250808) Today's AnalysisMarket News:
① Trump nominated Stephen Milan, Chairman of the White House Council of Economic Advisers, to serve on the Federal Reserve Board, with a term ending January 31, 2026.
② Waller is reportedly a leading candidate for the next Fed Chair.
③ U.S. Treasury Secretary Bensont stated that the interview process for the Fed Chair has begun.
④ Bostic stated that the July jobs report did indeed change the Fed's outlook on its employment goals.
Technical Analysis:
Today's Buy/Sell Levels:
1.1657
Support and Resistance Levels:
1.1745
1.1712
1.1691
1.1624
1.1603
1.1570
Trading Strategy:
If the price breaks above 1.1691, consider entering a buy position, with the first target price being 1.1712. If the price breaks below 1.1657, consider entering a sell position, with the first target price being 1.1624.

SWING TRADE IN EURUSD SWING Trade in EURUSD.📉🔻
Swing opportunity is forming in EURO to Short
Follow for more swing analysis on Indices, Commodities
Dr. Iqra Shah
EURUSD; Heikin Ashi Trade Idea📈 Hey Traders!
Here’s a fresh outlook from my trading desk. If you’ve been following me for a while, you already know my approach:
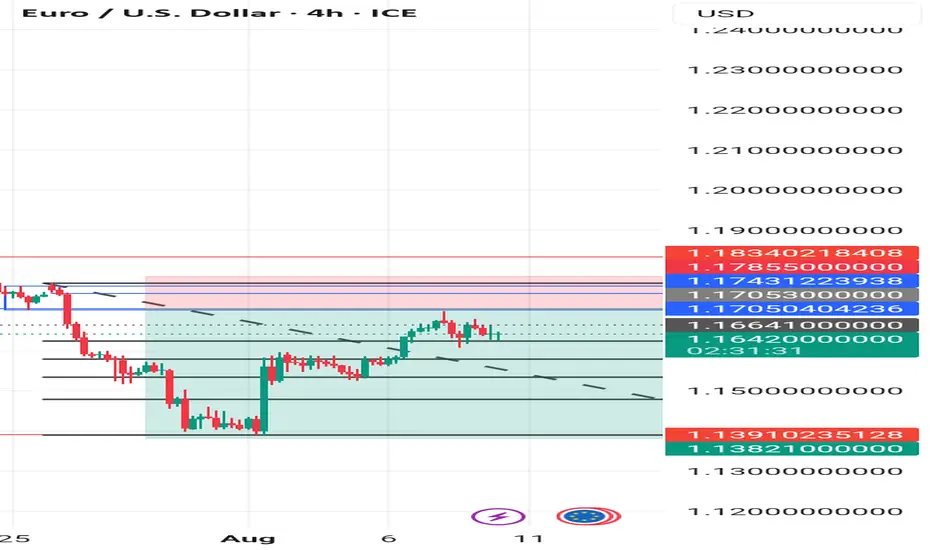
🧩 I trade Supply & Demand zones using Heikin Ashi chart on the 4H timeframe.
🧠 I keep it mechanical and clean — no messy charts, no guessing games.
❌ No trendlines, no fixed sessions, no patterns, no indicator overload.
❌ No overanalyzing market structure or imbalances.
❌ No scalping, and no need to be glued to the screen.
✅ I trade exclusively with limit orders, so it’s more of a set-and-forget style.
✅ This means more freedom, less screen time, and a focus on quality setups.
✅ Just a simplified, structured plan and a calm mindset.
💬 Let’s Talk:
💡Do you trade supply & demand too ?
💡What’s your go-to timeframe ?
💡Ever tried Heikin Ashi ?
📩 Got questions about my strategy or setup? Drop them below — ask me anything, I’m here to share.
Let’s grow together and keep it simple. 👊

EURUSD SELLGlobal equities rose on Thursday, with Japanese shares hitting a record high, as tech-led gains on Wall Street, upbeat earnings, growing hopes for a ceasefire in Ukraine and expectations for U.S. rate cuts boosted sentiment.
EURUSD rises slightly as US economy weakens more than expected1) Market Overview
EURUSD fluctuates around 1.0850 - 1.0960, with a slight upward trend thanks to
- US economic data is below expectations
- ECB maintains a mildly dovish stance, affirming that it will continue to monitor inflation instead of declaring an end to interest rate hikes
This week the market will focus on
- US CPI - which can cause strong fluctuations
- Some statements from ECB and FED members
- Geopolitical risks in the Middle East and Europe
2) Technical Analysis
- Trend: EURUSD is trending slightly upward, the main support level is around 1.0850 and strong resistance is at 1.0970-1.10000
- RSI: fluctuates near the 55-60 zone, not overbought, still has room to increase
- MACD: is crossing the signal line - a potential bullish signal
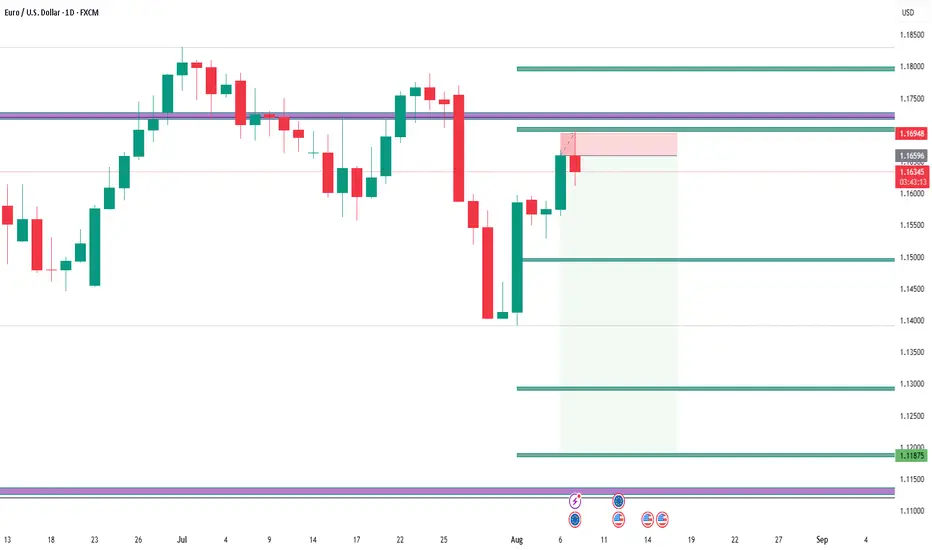
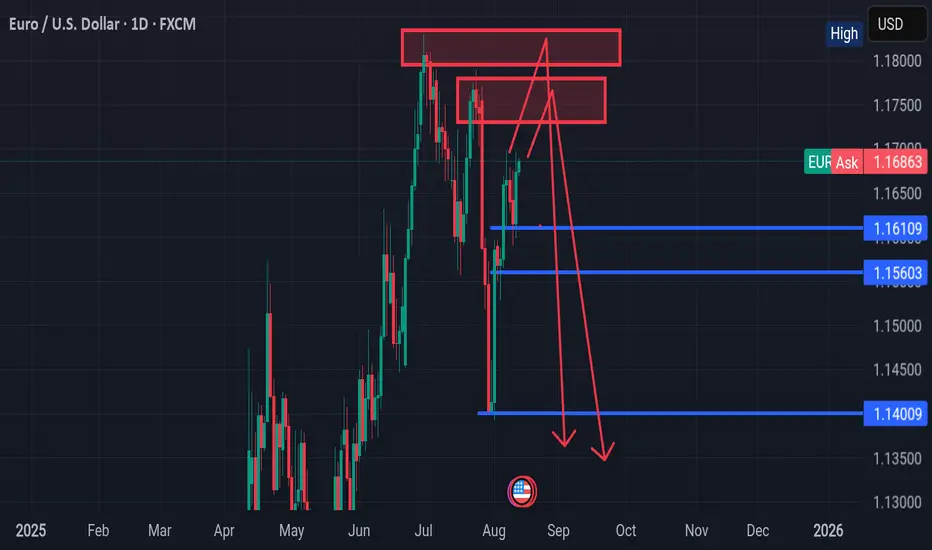
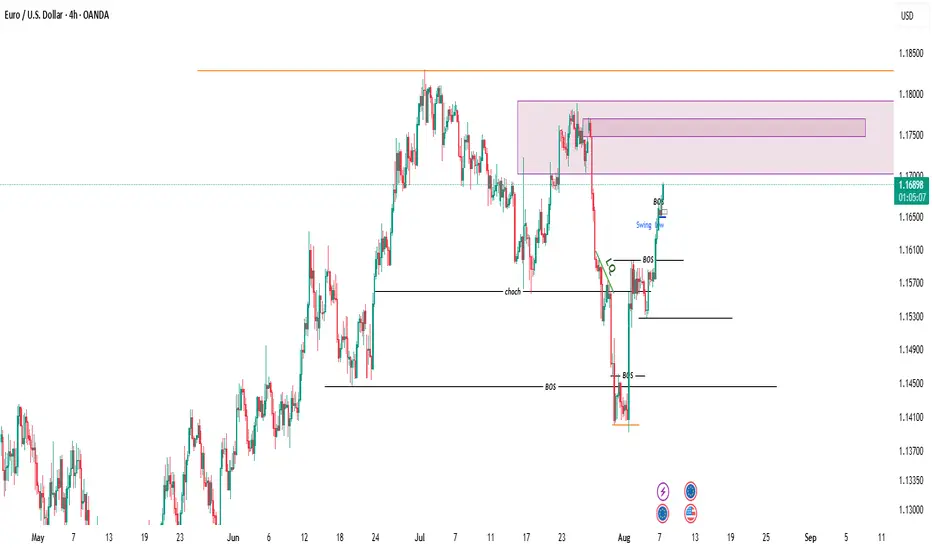
EURUSD DAILY TIMEFRAME ANALYSIS From the chart (EUR/USD, Daily), here’s the breakdown:
---
Trend Analysis
Medium-term context: Price previously made a strong bullish run from late May to late June 2025, topping near 1.1840.
Recent action: After that peak, we’ve seen a lower high and lower low structure, meaning the market shifted into a bearish correction.
Current state: Price is in a range/consolidation between roughly 1.1400 (support) and 1.1780 (resistance), but leaning bullish short-term because the recent candles have been climbing back toward the upper mid-range.
The key mid-range level around 1.1680–1.1700 is being retested — this is both a former support-turned-resistance and a zone where many stop orders could be clustered.
---
Liquidity & Stop Hunt Zones
1. Above current highs (bullish liquidity)
Around 1.1730–1.1780: Previous swing highs and order block zone.
Institutions could push price above here to trigger buy stops before reversing.
Above 1.1840: Major liquidity pool from the June top.
2. Below current lows (bearish liquidity)
Around 1.1610: Recent swing low and consolidation base.
Around 1.1560: Cluster of lows where stop losses for buyers may sit.
1.1400 zone: Key liquidity pool from the July drop — large stop cluster likely below here.
---
Possible Stop Hunt Scenarios
Bullish Stop Hunt: Price could run above 1.1730 to take out breakout buyers’ stops and then reverse down.
Bearish Stop Hunt: Price could drop below 1.1610 to grab liquidity before pushing up again toward 1.1780.
EURUSD Faces Renewed Selling PressureHello, what are your thoughts on EURUSD?
After failing to break above the 1.1600 level, the EUR/USD pair is now facing strong selling pressure again, currently testing the mid-1.1500s on Monday. Meanwhile, the US Dollar has seen a modest rebound across the board as investors digest Friday’s sharp drop following weaker-than-expected US jobs data.
From a technical standpoint, this setup may lead EURUSD to even lower levels. The recent movement aligns well with our previous outlook and follows the Dow Theory principles.
I'm expecting the price to continue its correction—what about you?
EURUSDPrice recently plunged into the deep and has now returned for fair value. We are already in a significant area, on a higher time-frame(1D), so any moment from now they can collapse it, much like last week! Be on the look-out like a meerkat!
1.1680 and 1.1720 are institutional price levels and price tends to have strong reactions in these areas. I expect to see that play out tomorrow.
The following reports will be used to trigger this move:
BoE Monetary Policy Report.
Continuing Jobless Claims 4-Week Average.
Initial Jobless Claims.
Unit Labour Costs.
Nonfarm Productivity.
Stay safe!

ENTRY EURUSDDisclaimer:
This is merely a chart-based analytical trading idea and is not considered investment advice. Please manage your risks carefully and conduct your own research before making any trading decisions.
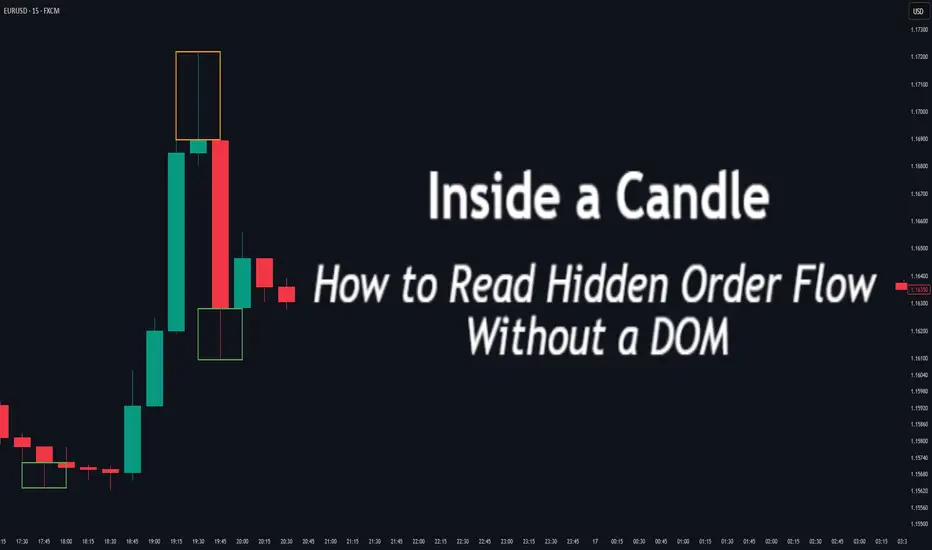
Inside a Candle: How to Read Hidden Order Flow Without a DOM
Difficulty: 🐳🐳🐳🐋🐋 (Intermediate+)
This article is for traders who want to understand the “story” behind a candle’s shape — and learn to spot aggressive buying/selling, absorption, and traps without needing footprint or order book tools.
🔵 INTRODUCTION
Most traders see candles as static shapes — green or red, big or small. But each candle is a battlefield of orders . Even without access to a DOM or volume footprint, you can still extract valuable information from just the candle's body, wick, and context .
🔵 ORIGINS: WHERE CANDLESTICKS COME FROM
Candlestick charts trace back to 18th-century Japan, where rice traders needed a way to visualize price movements over time. A legendary trader named Munehisa Homma , who traded rice futures in Osaka, is credited with developing the earliest form of candlestick analysis.
Homma discovered that price wasn’t just driven by supply and demand — but also by trader psychology . He created visual representations of market sentiment by tracking:
The opening and closing price of rice
The highest and lowest price reached during the session
This system became known as the “Sakata rules,” and it laid the foundation for many patterns still used today — such as Doji, Engulfing, and Marubozu.
Western traders only began using candlesticks widely in the 1990s, when analyst Steve Nison introduced them to the broader financial world through his book Japanese Candlestick Charting Techniques.
Today, candlesticks remain one of the most powerful and intuitive ways to visualize order flow, momentum, and market psychology — even without a Depth of Market (DOM) or depth of book.
In this article, you’ll learn how to read hidden order flow by analyzing:
Wick length and positioning
Body-to-range ratios
Candle clustering and sequences
🔵 HOW A CANDLE FORMS
Before you can read a candle, you need to understand how it comes to life . A single candle represents the full auction process during its time window.
Here’s how it builds, step by step:
Candle opens — this is the open price .
As price moves up during the session → the high] updates.
As price moves down → the low] updates.
The final traded price when the time closes → this becomes the close price .
The wick = price areas that were tested but rejected
The body = where the majority of aggressive trades occurred
If buyers push price up quickly but sellers slam it down before the close — the candle will have a long upper wick and close near the open, revealing seller absorption.
Understanding this flow helps you recognize traps, fakeouts, and reversals in real time.
🔵 CANDLE BODY: WHO'S IN CONTROL
The body of the candle reflects the result of the battle between buyers and sellers. A wide body with minimal wicks means dominance and commitment.
Big body, small wick → clear conviction
In an uptrend: buyer aggression
In a downtrend: panic or aggressive selling
Small body, long wicks → indecision, absorption, or trap
Often appears near tops/bottoms
Indicates both sides were active but neither won clearly
tradingview.sweetlogin.com
🔵 WICKS: THE SHADOWS OF REJECTION
Wicks are not just “leftovers” — they show where price was rejected after being tested.
Long upper wick = seller presence or absorption at highs
Long lower wick = buyer defense or trap spring
Double wick = liquidity sweep / false breakout
Use wick direction to spot:
Failed breakouts
Smart money traps
Exhaustion candles
🔵 HIDDEN ORDER FLOW PATTERNS
1️⃣ Absorption Candle
A large wick with little movement afterward — shows that big orders absorbed market pressure.
2️⃣ Trap Candle
A candle that sweeps above/below a key high/low and closes opposite — classic smart money fakeout.
3️⃣ Imbalance Candle
Large-bodied candle that closes near the high/low with no wick on the other end — implies one-sided aggression (and often leaves an imbalance).
🔵 CLUSTERING & SEQUENCES MATTER
Never read a candle alone. The sequence of candles tells the full story:
3+ rejection wicks near resistance? Liquidity building before breakout or trap
Bearish engulfing after long upper wick = smart money selling into retail buying
Tight-range dojis + volume spike = compression before expansion
Context + volume + structure = hidden flow decoded.
🔵 PUTTING IT TOGETHER: A REAL EXAMPLE
Price breaks above previous high
Candle closes with long upper wick and smaller body
Next candle opens, dumps fast, leaving imbalance behind
Buyers trapped — move likely to continue down
This is how you read order flow from candle anatomy .
🔵 TIPS FOR MASTERY
Use a lower timeframe (1M–5M) to see microstructure
Watch how wicks behave near S/R or OBs
Confirm with volume spikes or delta-style indicators
Use replay mode to slow down the story and study cause/effect
🔵 CONCLUSION
Every candle is a message. You don’t need expensive tools to read order flow — just your eyes, context, and curiosity.
Learn to see candles not as symbols, but as evidence of behavior . Absorption, imbalance, and traps are all visible if you look closely.
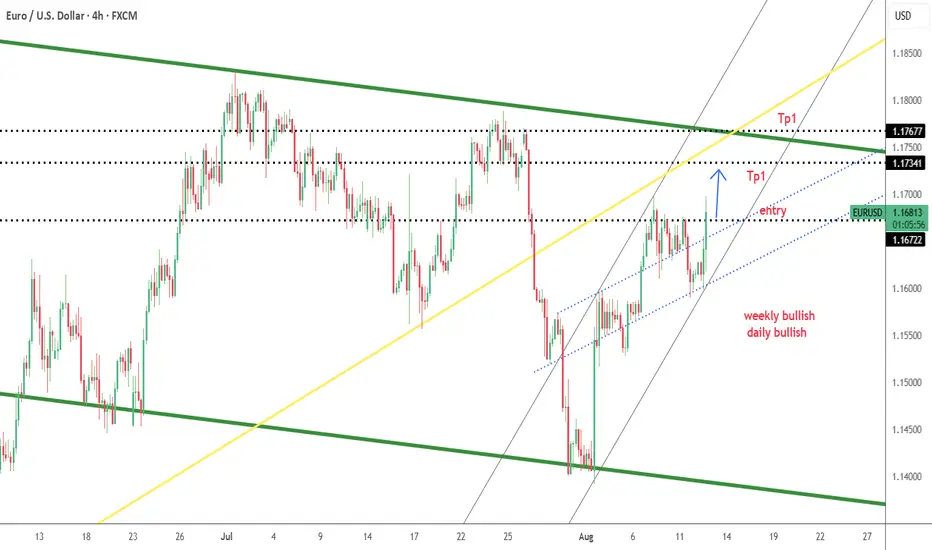
EURUSD BUYA nice break to the upside after Friday's data release, so now I'm just waiting for a pullback to go long.
EURUSD--LONG--weekly,daily bullish
--entry around 1.1673
--tp1 around 1.1734
--tp2 around 1.1767 or the upper side of green channel
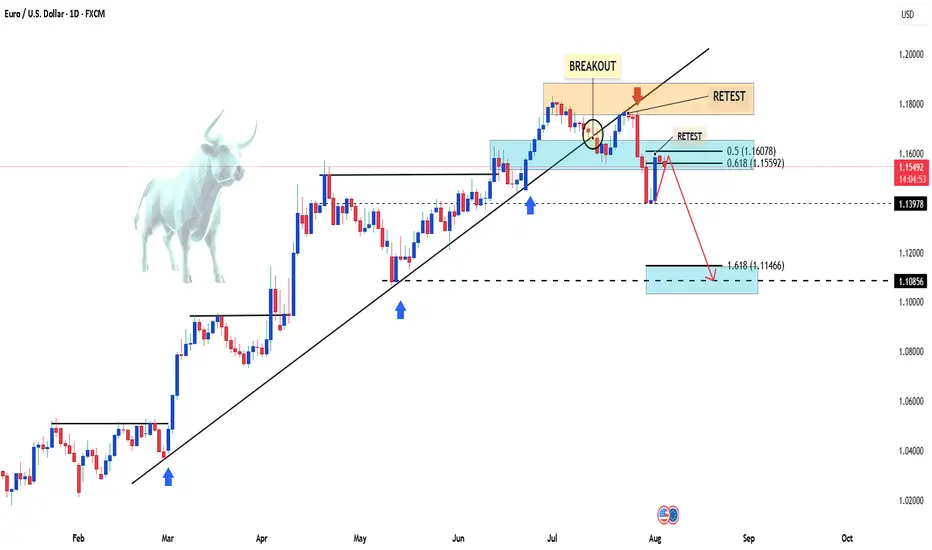
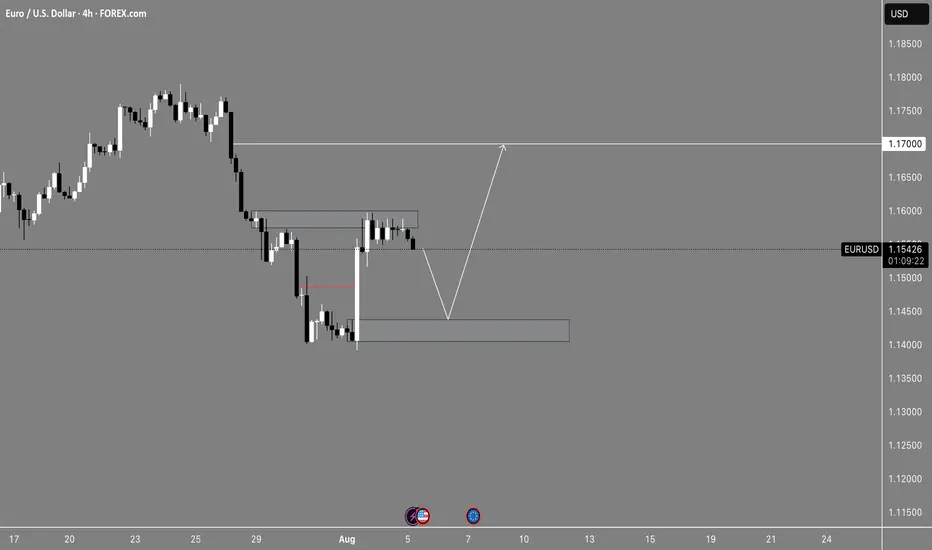
EURUSD Setup Is Crystal Clear — Here’s My Long & Short TriggersHey, it’s Skeptic. This isn’t about blind price prediction — it’s about spotting clean long and short triggers on EURUSD using daily and 4H structure, DXY correlation, and momentum.
We’ll break down a fresh V-Pattern , exact breakout levels, and how to avoid getting chopped in ranges.
If this helped, give it a boost — peace out.

Potential treat for the weekIn the higher time difference, we do have a swing high on the daily. In the daily, we also have a fair valuegap
eurusdWe have a bearish order block in the daily timeframe. If the bottom breaks in the fifteen-minute timeframe, we can enter a sell position. Or the fifteen-minute or five-minute bottom in the news timeframe must break with the body.
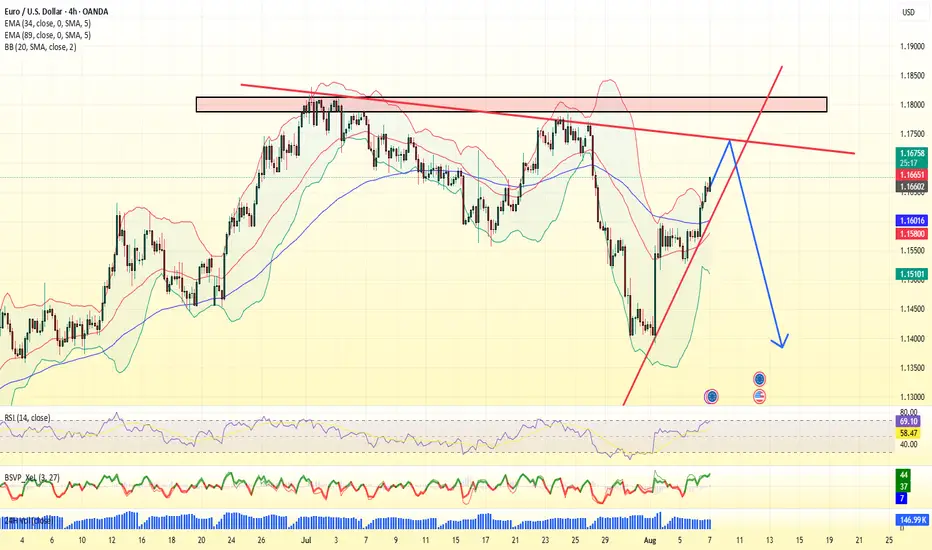
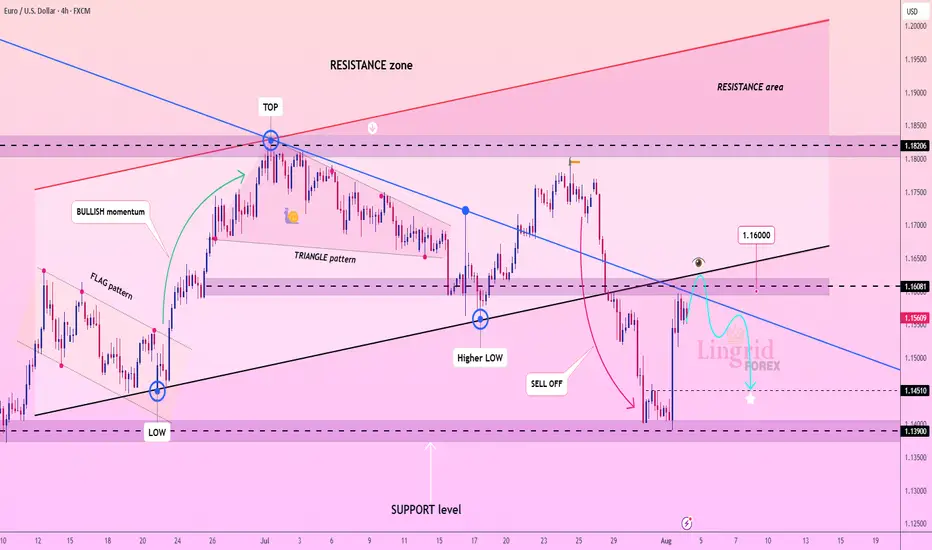
Lingrid | EURUSD Confluence Zone: Shorting Opportunity. The price perfectly fulfilled my previous idea . FX:EURUSD is pulling back toward a confluence of resistance formed by the broken upward trendline and the descending channel boundary. Price structure suggests a lower high beneath the $1.16081 zone after a sharp sell-off from the July peak. As long as price remains below this resistance and fails to reclaim the $1.16000 level, further downside toward $1.14510 and lower remains likely. Momentum is favoring continued bearish pressure following the recent breakdown.
📉 Key Levels
Sell trigger: Rejection from $1.16000
Sell zone: $1.15800 – $1.16081
Target: $1.14510
Invalidation: Break above $1.16081
💡 Risks
A confirmed breakout above $1.16081 may invalidate the bearish setup
Momentum could stall near $1.15000 and lead to consolidation
Support at $1.14510 may attract short-term dip buyers
If this idea resonates with you or you have your own opinion, traders, hit the comments. I’m excited to read your thoughts!
EUR USD - PRICE BACK TO FILL THE LIQUIDITY OF LAST FRIDAYS HIGH EUR USD here we can see that thursday high is 1.17000, and also friday high is 1.16800,these level is filled with liquidity sweep after thurdays, we got an break out, after grabbing the liquidity at these highs price broke down towards a support zone,cleared all the liquidity here, hence current expectation price may return to fill the liquidity of last fridays high level is 1.17000, follow for more live updates and check my page


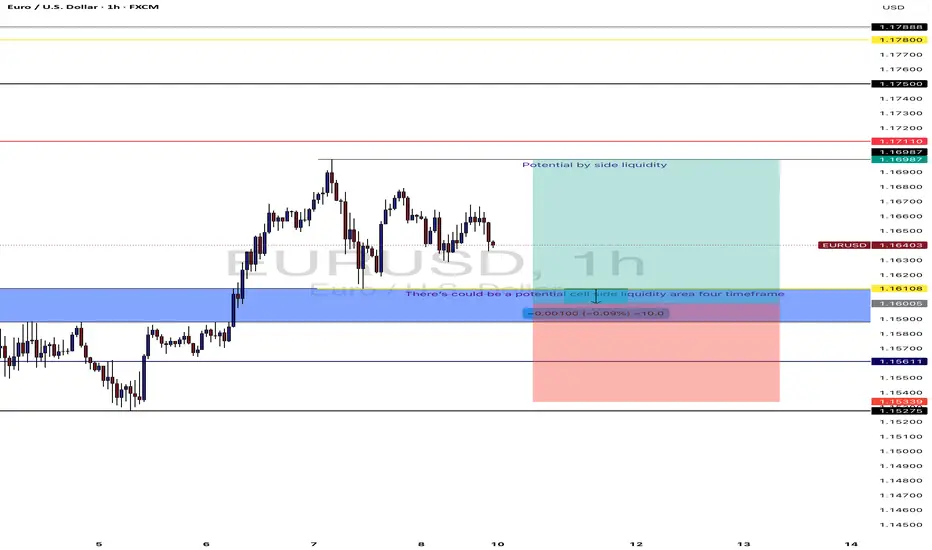
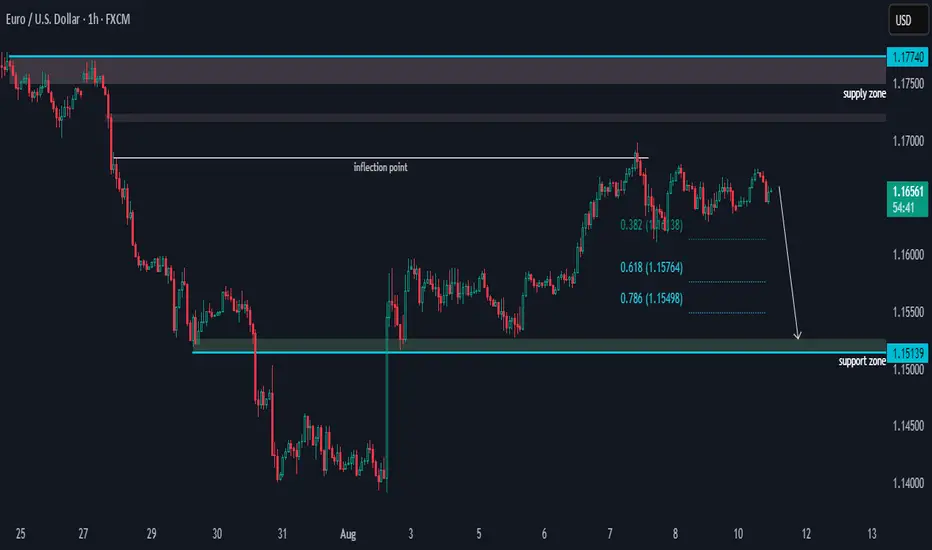
EURUSD Bearish Outlook.Hi there,
EURUSD at the H1 timeframe seems to be losing bullish momentum to 1.17k. We have three potential target areas for a bias of 1.15139.
Happy Trading,
K.
Not trading advice
EURUSD: Short Signal with Entry/SL/TP
EURUSD
- Classic bearish setup
- Our team expects bearish continuation
SUGGESTED TRADE:
Swing Trade
Short EURUSD
Entry Point - 1.1625
Stop Loss - 1.1635
Take Profit - 1.1605
Our Risk - 1%
Start protection of your profits from lower levels
Disclosure: I am part of Trade Nation's Influencer program and receive a monthly fee for using their TradingView charts in my analysis.
❤️ Please, support our work with like & comment! ❤️

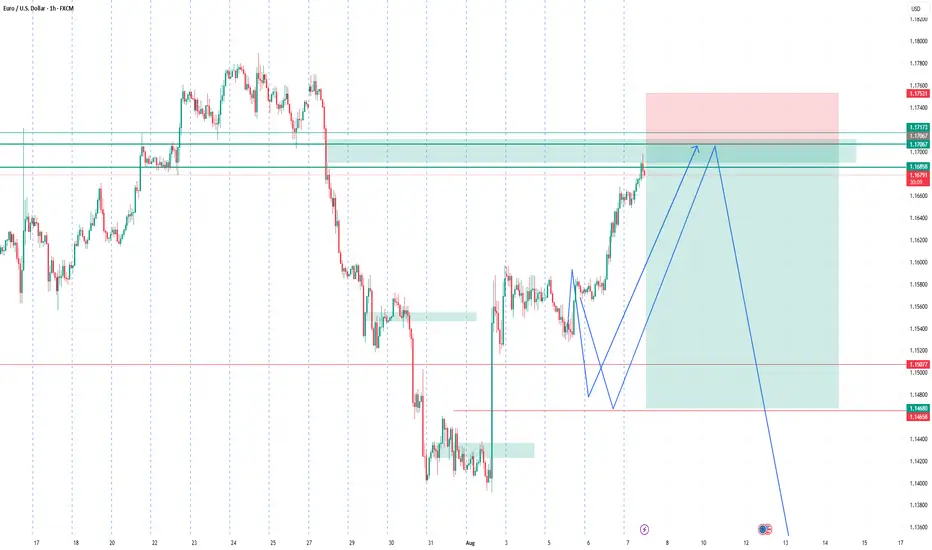
EURUSD | Eyes on the 50EMA — One Bold Candle and I’m All InThe 1-hour chart has carved a beautiful bullish range from 1.1565 to 1.1696. A little 15-minute pullback tried to test our love, but I’ve got all the signs — the retracement is over, and the ride is calling again.
WHAT TO DO
Just one confident Marubozu closing above the 50EMA, and I’m jumping in — no hesitation, no second thoughts. Let’s ride this story back to the top.
TP1: 1.1696 (where the heart first skipped)
TP2: 1.1716 (where dreams begin)
SL: If that candle speaks loud and clear, my stop loss will be just below it — because love deserves a little risk, but never recklessness.
WHAT IF IT WONT CROSS?
This is day trading setup. While watching 15m candle to bear below 50EMA also I glance 1hr chart. This setup will be valid as long as 1hr chart is still in bearing range.
Wish me luck — this might just be the ride of the day! 💞📈

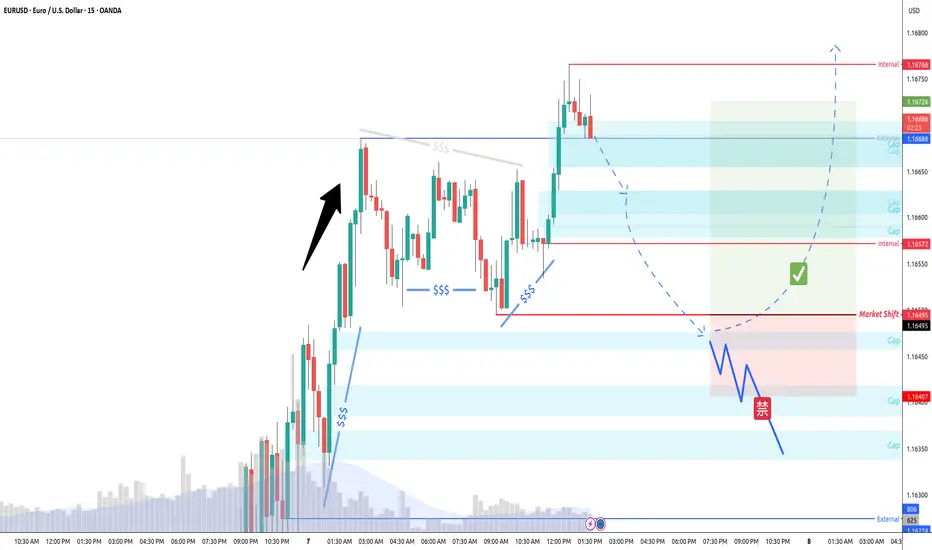
EURUSD 15/5 Pullback LongYesterday session TPO's POC is low, but price closed high. Looking for a continuos bull action.
The overall trend is bullish. Waiting to see if it pullback to the market shift and bounce back then long.
If the porice drop below marketshit and stay below, no trade for it.