Euro / U.S. Dollar forum
and buy Again at 1.17171 - 1.17195
2/2 Summary of Key Levels
Daily & 4-Hour Support and Resistance
Daily Support Levels: 1.17300, 1.17000, 1.16700
Daily Resistance Levels: 1.17800, 1.18000, 1.18300
4-Hour Support Levels: 1.17500, 1.17250, 1.17050
4-Hour Resistance Levels: 1.17850, 1.18050, 1.18200
Exponential Moving Average (EMA) Levels
Daily EMA Levels:
EMA 50: 1.17200
EMA 100: 1.16950
EMA 200: 1.16500
EMA 400: 1.16200
4-Hour EMA Levels:
EMA 50: 1.17600
EMA 100: 1.17300
EMA 200: 1.17000
EMA 400: 1.16600
Weekly Pivots
Pivot Level 1: 1.17700
Pivot Level 2: 1.17500
Pivot Level 3: 1.17200
Daily Pivots
Pivot Level 1: 1.17650
Pivot Level 2: 1.17500
Pivot Level 3: 1.17300
Fibonacci Retracement Levels
23.6% Level: 1.17400
38.2% Level: 1.17700
50.0% Level: 1.16900
61.8% Level: 1.18000
Fundamental Analysis and Upcoming USD News
As we analyze the EURUSD market, it’s essential to consider the broader economic context, particularly regarding upcoming USD news that could impact the currency pair. Key events to watch for in the coming weeks include:
Non-Farm Payrolls (NFP): Scheduled for July 7, 2025, this report provides insights into employment trends in the U.S. and can significantly influence USD strength.
Consumer Price Index (CPI): To be released on July 12, 2025, the CPI report will shed light on inflation trends, impacting Federal Reserve policies and, consequently, the USD.
Federal Reserve Meeting: On July 25, 2025, any announcements regarding interest rate changes or economic outlook could lead to volatility in the USD and affect EURUSD prices.
Traders should remain vigilant during these periods, as significant fluctuations in USD can lead to corresponding movements in the EURUSD market.
Conclusion
In conclusion, the current EURUSD price of 1.17660 USD is situated at a critical juncture, surrounded by key support and resistance levels. The analysis of Fibonacci retracement levels, EMAs, RSI divergence, order blocks, and MACD provides a comprehensive view of potential market movements. Additionally, keeping an eye on upcoming USD economic events will be crucial for traders navigating this dynamic market. By leveraging these insights, traders can make informed decisions and enhance their trading strategies.
1/1 🟡 EURUSD Daily Market Analysis—July 2, 2025
Introduction
In today’s analysis, we will delve into the current market dynamics of the EURUSD currency pair, which is trading at 1.17660 USD. This comprehensive overview will utilize various technical indicators, including Fibonacci Retracement Levels, Exponential Moving Averages (EMAs), RSI divergence, Weekly and Daily Pivots, Smart Money Concepts (SMC), Support and Resistance Levels, Order Blocks, and MACD. By examining both the daily and 4-hour timeframes, we aim to provide traders and investors with valuable insights into potential market movements and trading opportunities.
Market Analysis
Current Market Overview
As of now, the EURUSD is experiencing fluctuations around the 1.17660 USD mark. Understanding the underlying factors influencing this currency pair is critical for making informed trading decisions. The recent swing high was recorded at 1.16319, while the swing low stands at 1.14463. This analysis will focus on identifying key support and resistance levels, utilizing Fibonacci retracement levels, and examining various technical indicators to forecast potential price movements.
Support and Resistance Levels
Daily Timeframe:
Support Levels:
1.17300
1.17000
1.16700
Resistance Levels:
1.17800
1.18000
1.18300
4-Hour Timeframe:
Support Levels:
1.17500
1.17250
1.17050
Resistance Levels:
1.17850
1.18050
1.18200
These support and resistance levels are crucial for identifying potential entry and exit points. Traders should closely monitor these areas as they often serve as pivotal points for price reversals or breakouts.
Fibonacci Retracement Levels
Using the recent swing high of 1.16319 and swing low of 1.14463, we can derive the following Fibonacci retracement levels:
23.6% Level: 1.17400
38.2% Level: 1.17700
50.0% Level: 1.16900
61.8% Level: 1.18000
These levels indicate potential areas of support and resistance where price action may react, providing traders with additional insights into market behavior.
Exponential Moving Averages (EMA)
Daily EMA Levels:
EMA 50: 1.17200
EMA 100: 1.16950
EMA 200: 1.16500
EMA 400: 1.16200
4-Hour EMA Levels:
EMA 50: 1.17600
EMA 100: 1.17300
EMA 200: 1.17000
EMA 400: 1.16600
The EMAs provide insights into the overall trend direction. Currently, the price is above the EMA 50 on the daily timeframe, indicating a bullish sentiment in the market. Traders often look for crossovers between these EMAs as potential buy or sell signals.
RSI Divergence
The Relative Strength Index (RSI) is currently showing a divergence on the daily timeframe. While the price has made higher highs, the RSI has not followed suit, indicating potential weakness in the current bullish momentum. This divergence could signal an impending correction, and traders should remain cautious as they monitor price action.
Order Blocks
Order blocks are significant price levels where large institutional orders have been placed, indicating potential support or resistance. In our analysis, we identify the following order blocks:
Bullish Order Block: Near 1.17000, where buying interest has previously emerged.
Bearish Order Block: Around 1.18000, where selling pressure has been observed.
These order blocks offer insights into potential areas where price may react, allowing traders to align their strategies with institutional activity.
MACD Analysis
The Moving Average Convergence Divergence (MACD) is another valuable tool for assessing market momentum. Currently, the MACD line is above the signal line, indicating bullish momentum. However, if the MACD begins to converge with the signal line, it may suggest a potential slowdown in momentum, warranting a closer examination of price movements.
The LTF structural integrity is still present, for now lol
tradingview.com/x/XZO6TEUt
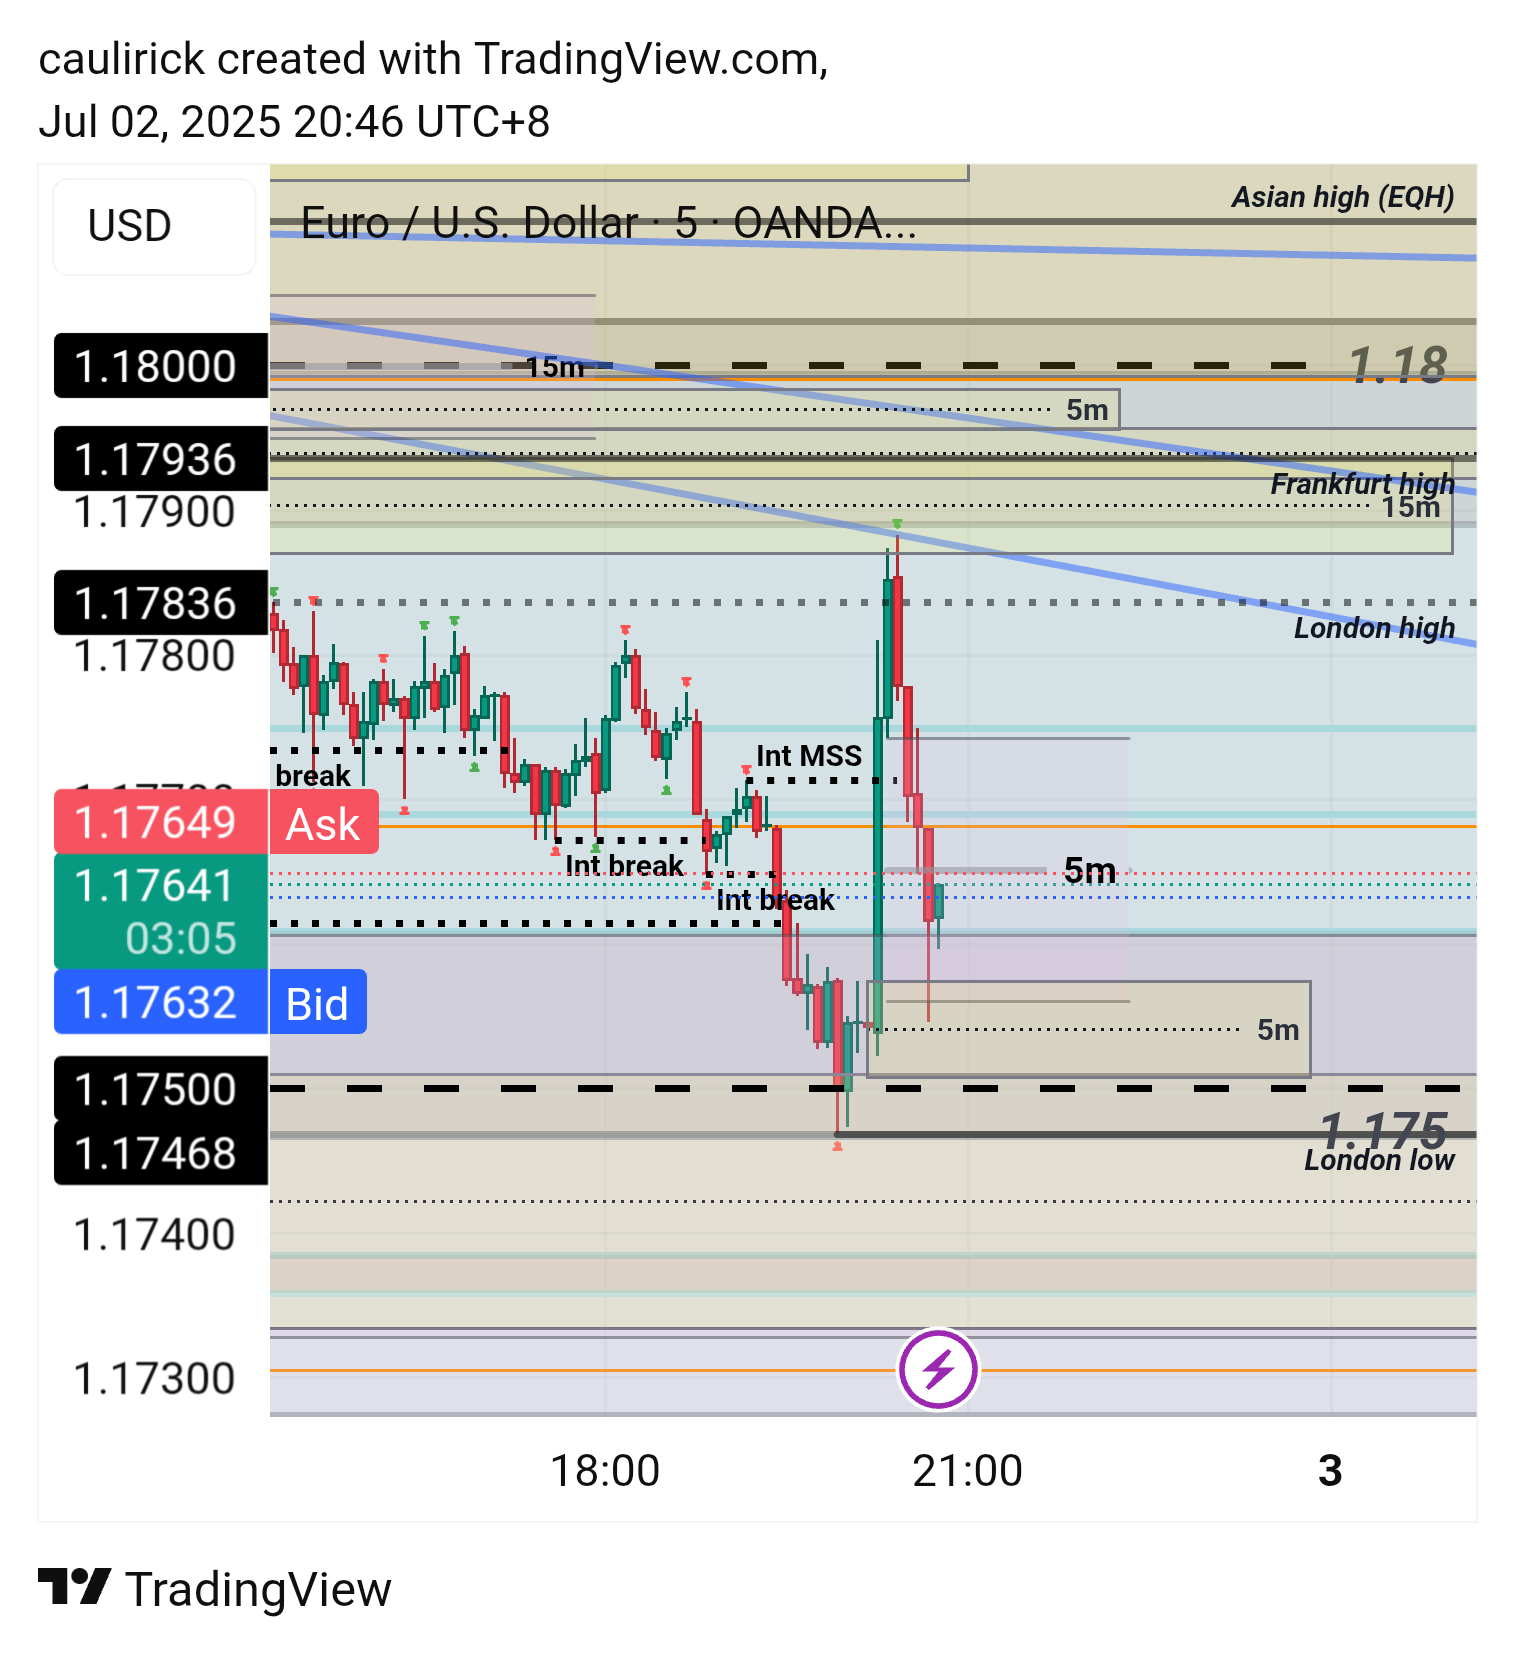
Be careful buyers, trend is still over all bearish, a choch or Bos during news is mostly invalid. Trade with caution and protect your assets fam.