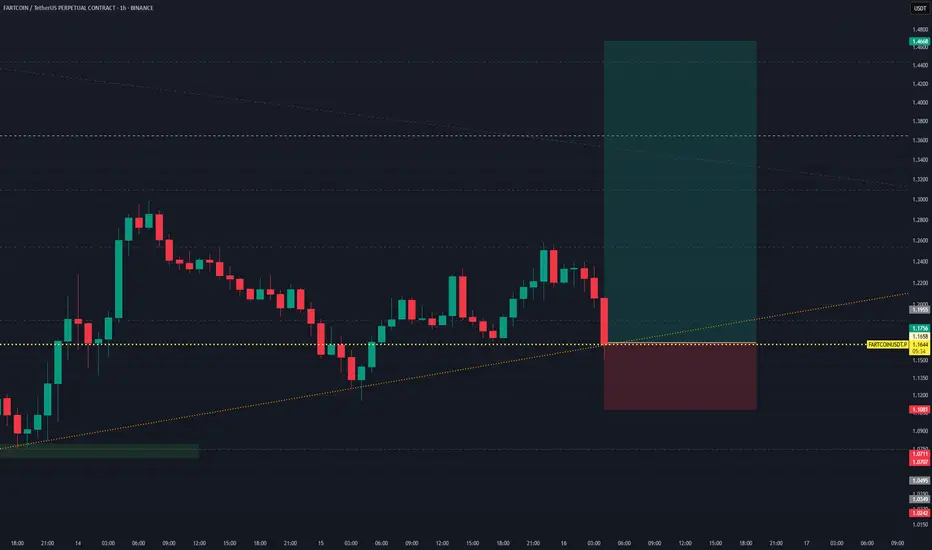
FARTCOINUSDT Perpetual – Trendline Bounce PlayThis chart presents a long position setup on FARTCOINUSDT.P, aiming for a rebound off a confluence of support levels.
Trade Details:
Position: Long
Entry Price: $1.1651
Stop Loss: $1.1081
Take Profit: $1.4668
Risk-to-Reward (RRR): ~5.32
Timeframe: Likely 4H or 1H
Setup Rationale:
Entry is p
FARTCOIN - The air is heavy and not smellyFartCoin moves are to be there when fall is done at bottom and moves from there at top, but moves are very to be seen soon!
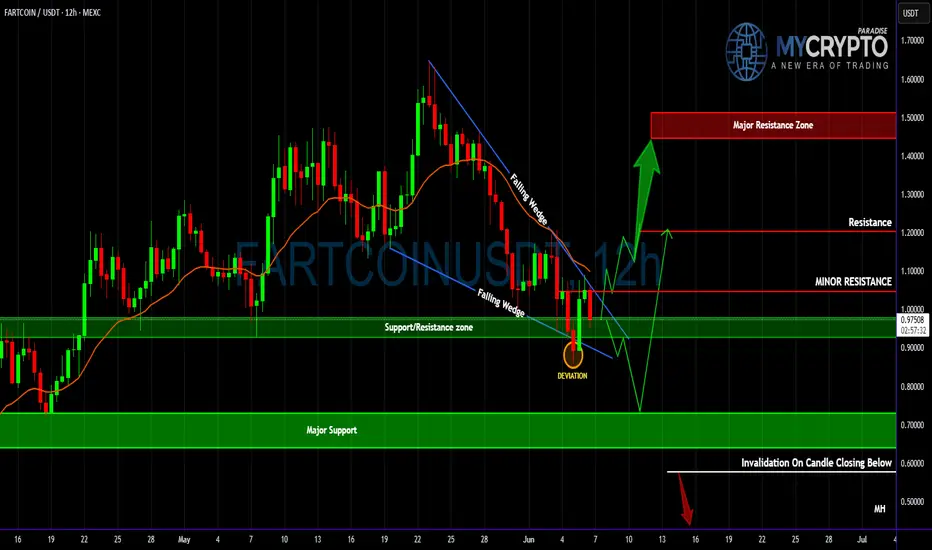
FARTCOIN’s - High Probability Breakout or Devastating Trap?Yello Paradisers, are you truly prepared for what #FARTCOIN is signaling right now? Because this setup is dripping with opportunity—but only for those who understand market structure and probability. After a steady grind lower inside a clean falling wedge formation, price just printed a high-probabi
Farts on the MOve!!! Light air goes up, its heavy - and soon 1.56 to be touched in some time if only not btc wrecks!

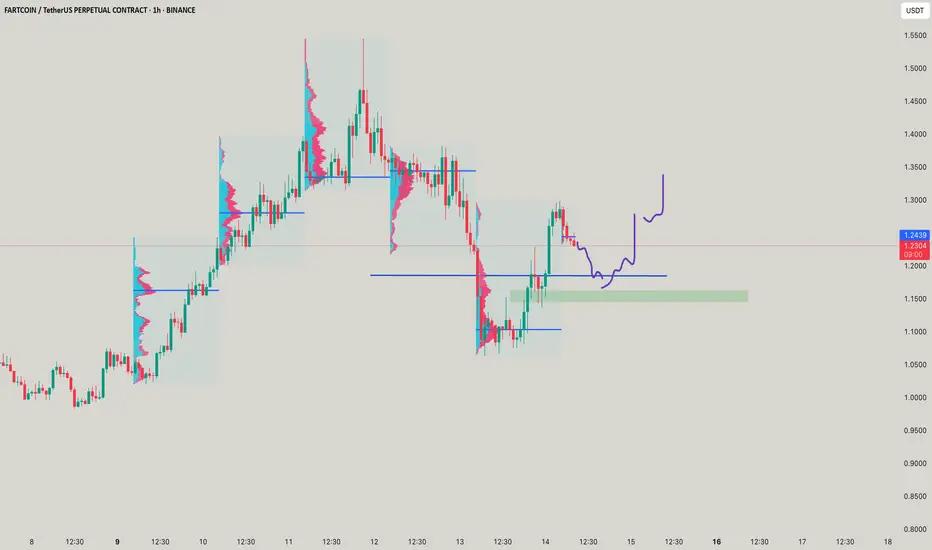
FARTCOINUSDT Bullish Breakout Setup – Retest OpportunityFARTCOINUSDT shows a potential bullish breakout from a falling wedge pattern. Price action breaks the descending trendline and comes back for a clean retest at a key confluence zone near horizontal support and wedge resistance turned support. This offers a high-probability long entry with minimal do
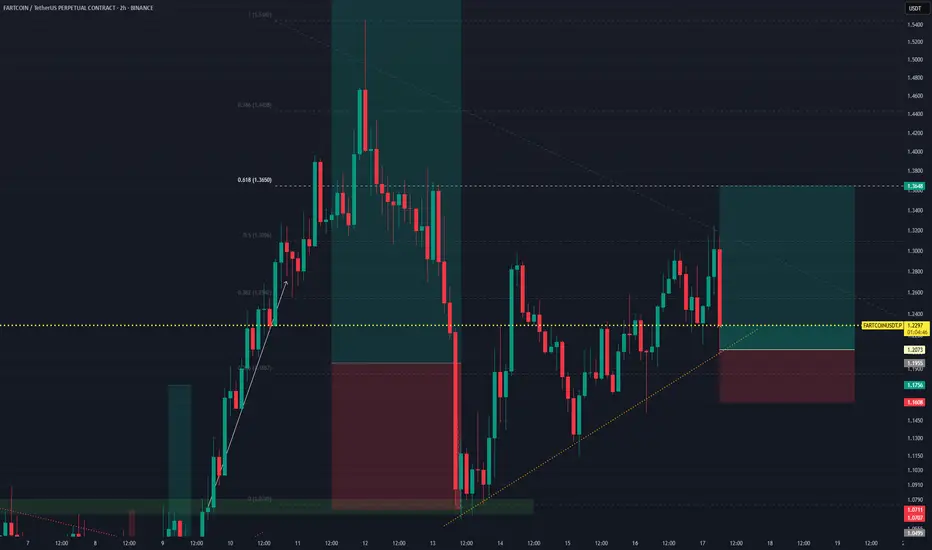
They laughed at the name. I loaded the setupPrice action doesn’t care about branding — it cares about imbalance, volume, and delivery. And FARTCOIN just hit a prime liquidity pocket with mechanical precision.
The structure:
After a fast drop, price tagged the 0.618 fib at 1.1607, which also aligns with the high-volume node (visible range) —
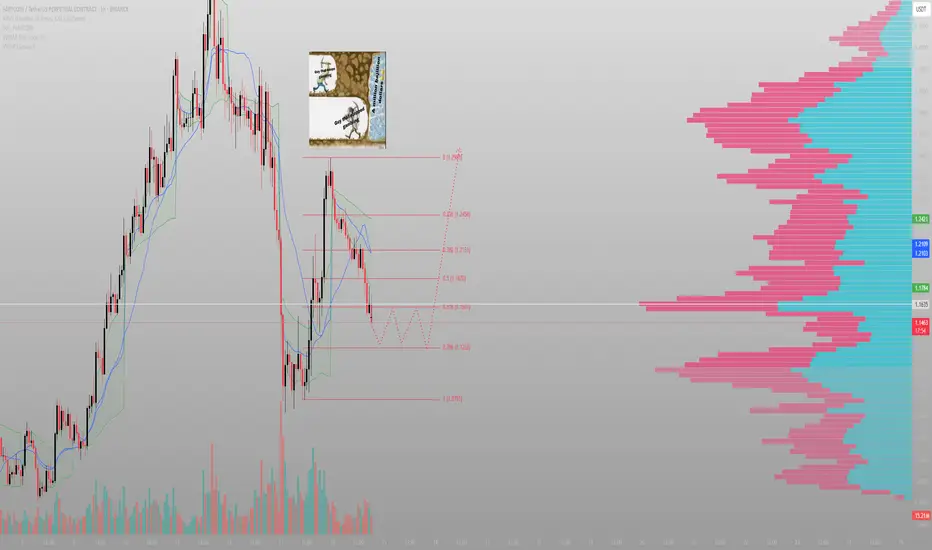
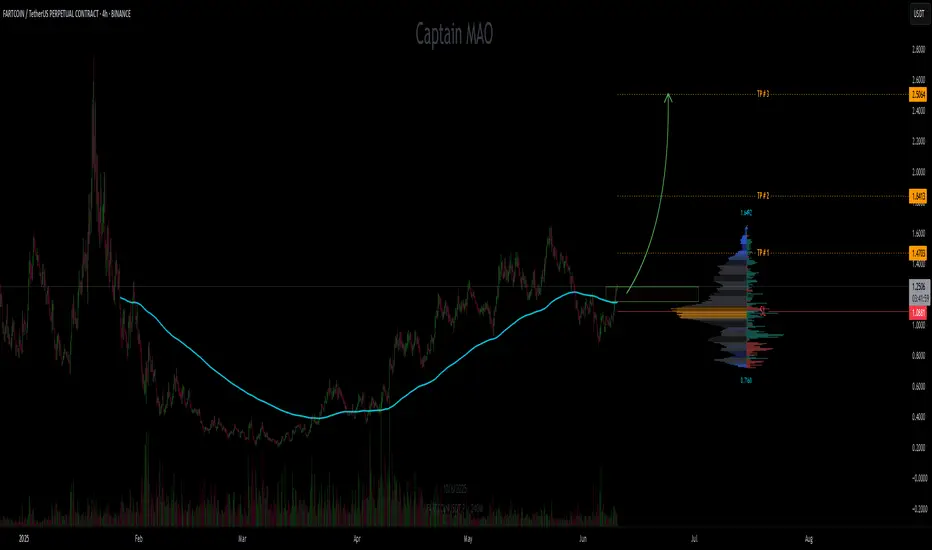
FARTCOIN/USDT Risk/Reward Ratio: 11
Entry Zone: $1.15 – $1.25 (green box)
TP1: $1.47
TP2: $1.82
TP3: $2.50
Stop Loss: $1.09
Price has already reclaimed the $1.18 level and broken out above the previous swing high — confirmation of bullish momentum is in place. Trade now active within entry zone. Eyes on continuation toward highe
I never knew FART has directions!So normal farts make sounds this fart gives direction - LOL Direction of whats gonna happen, the fall till yellow to be seen but first moves to top in place!


FARTCOIN | Dream scenarioTextbook ABC correction into the $0.83–0.75 zone.
Will the fartcoin gods let us bid sub $1 again? Odds are low, but man can dream.
If filled, expecting a big wave up — ultimate R/R.
Main risk: market front-runs and never fills — be nimble, ladder bids if you're serious.
"If you get the dream fill,

See all ideas
Summarizing what the indicators are suggesting.
Oscillators
Neutral
SellBuy
Strong sellStrong buy
Strong sellSellNeutralBuyStrong buy
Oscillators
Neutral
SellBuy
Strong sellStrong buy
Strong sellSellNeutralBuyStrong buy
Summary
Neutral
SellBuy
Strong sellStrong buy
Strong sellSellNeutralBuyStrong buy
Summary
Neutral
SellBuy
Strong sellStrong buy
Strong sellSellNeutralBuyStrong buy
Summary
Neutral
SellBuy
Strong sellStrong buy
Strong sellSellNeutralBuyStrong buy
Moving Averages
Neutral
SellBuy
Strong sellStrong buy
Strong sellSellNeutralBuyStrong buy
Moving Averages
Neutral
SellBuy
Strong sellStrong buy
Strong sellSellNeutralBuyStrong buy
Displays a symbol's price movements over previous years to identify recurring trends.