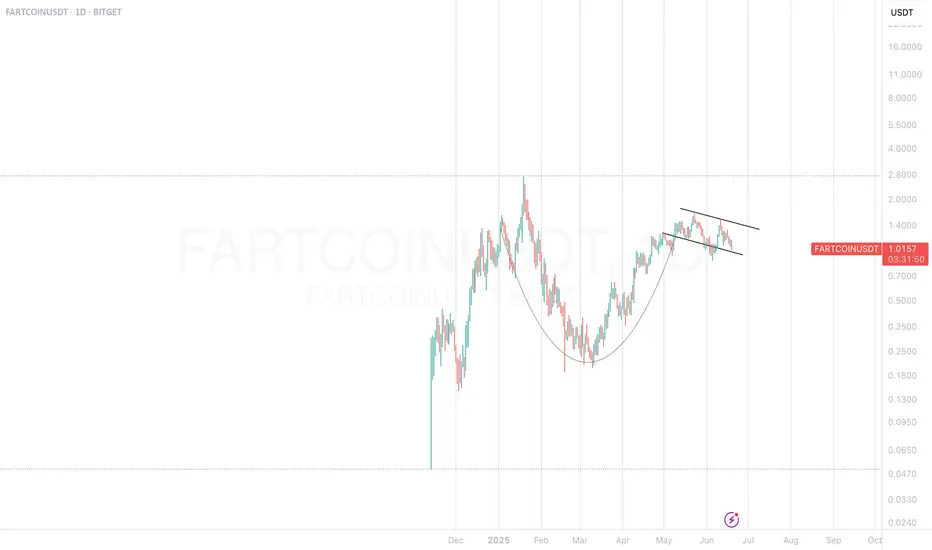
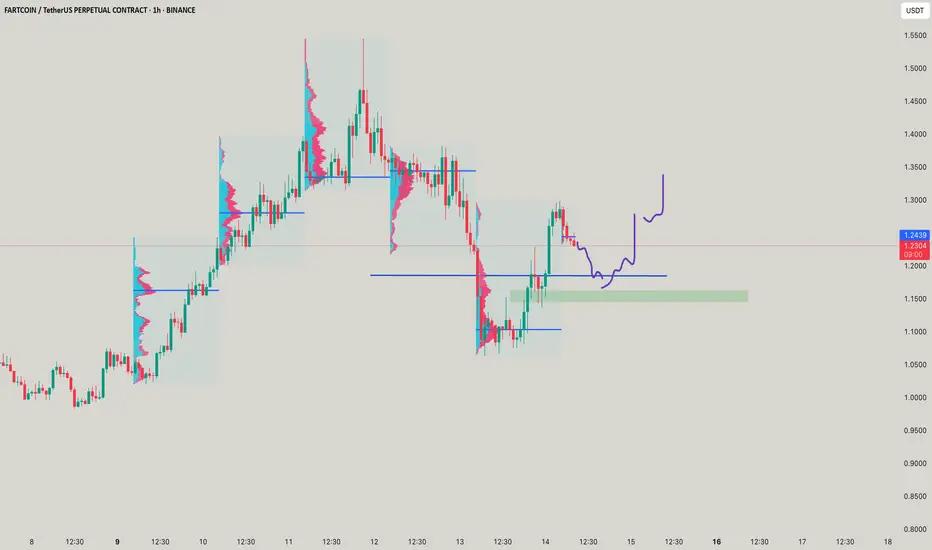
Fartcoin BullishCup and Handle formation showing on Fartcoin.
Bitcoin once it goes will lift a bunch of alt coins. I believe bitcoin is en route towards $130k next. Alt coins will likely move after.
FARTCOINUSDT.P trade ideas
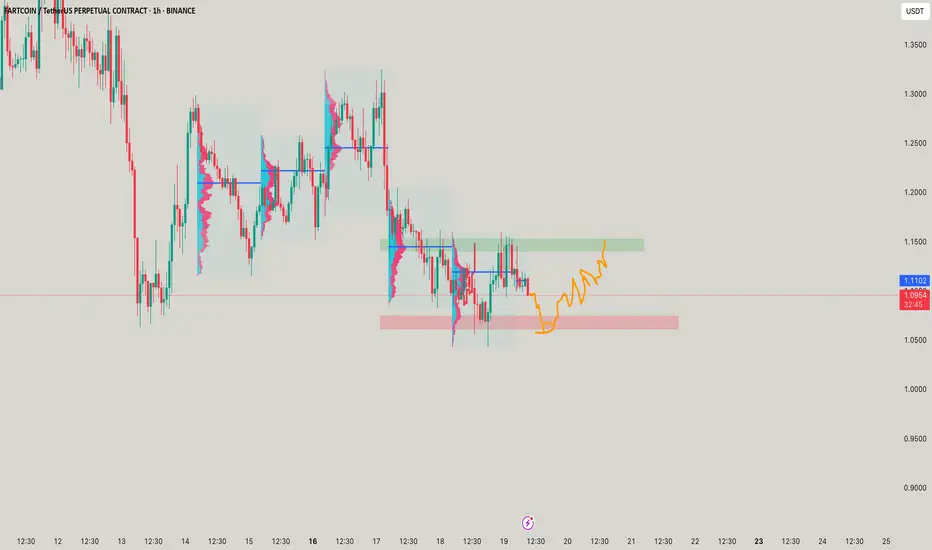
Heavy Air comes down - FARTCOINSO the arrow is purely made of fun and agression lol thats the move you expect, expecting btc to fall a bit for it fall further and move, ranges marked
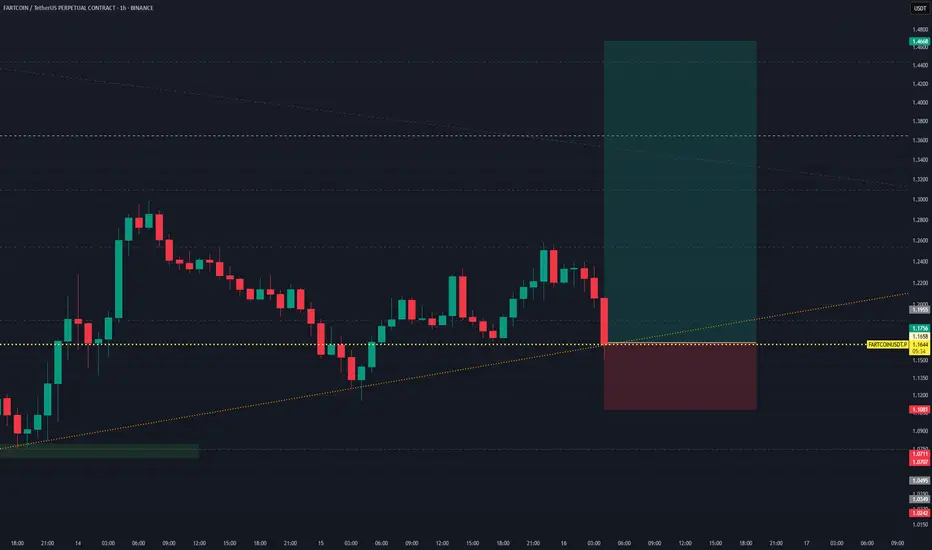
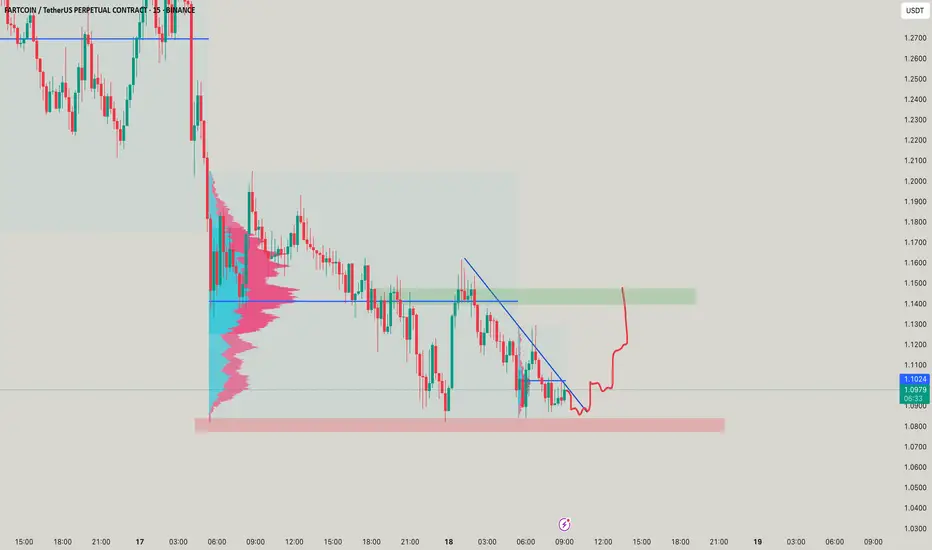
FARTCOINUSDT Perpetual – Trendline Bounce PlayThis chart presents a long position setup on FARTCOINUSDT.P, aiming for a rebound off a confluence of support levels.
Trade Details:
Position: Long
Entry Price: $1.1651
Stop Loss: $1.1081
Take Profit: $1.4668
Risk-to-Reward (RRR): ~5.32
Timeframe: Likely 4H or 1H
Setup Rationale:
Entry is placed at the intersection of a horizontal support and a rising trendline — strong confluence zone.
A long lower wick hints at rejection of lower prices (possible seller exhaustion).
Very favorable RRR shows high potential reward with relatively low risk.
Target aligns with prior structure level or supply zone.
Conclusion:
This is a technical bounce trade from a rising trendline and support. Price action confirmation (e.g., bullish engulfing or strong bounce candle) would strengthen the setup further.
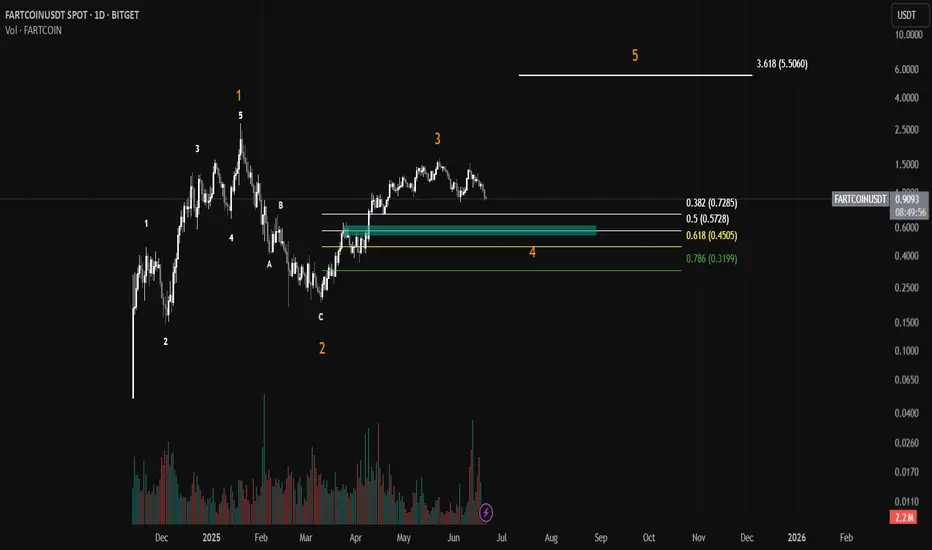
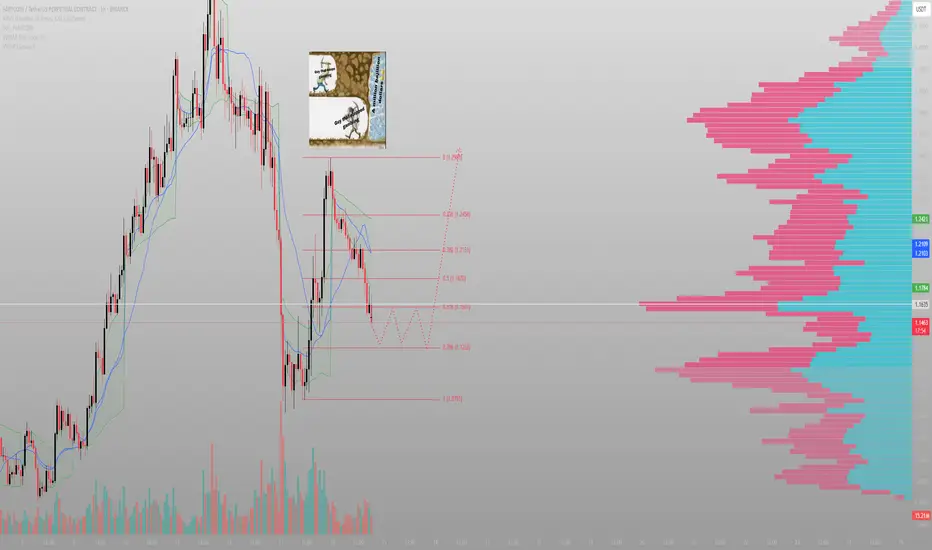
fartcoin trade ideathe orange impulsive wave is unfolding however the wave 3 is very weak and it didn't even took the wave 1 high but it is still allowed and can be called weak wave 3 so Wave 4 should unfold the support zones are mentioned with green box as area of opportunity I expect the wave 5 to be the biggest wave compared to 1 and 3 target for wave 5 is also mentioned
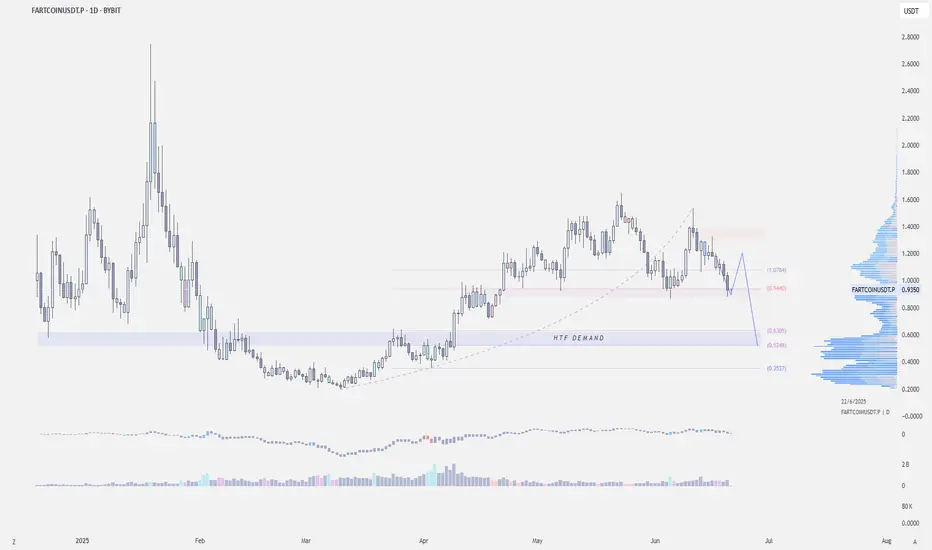
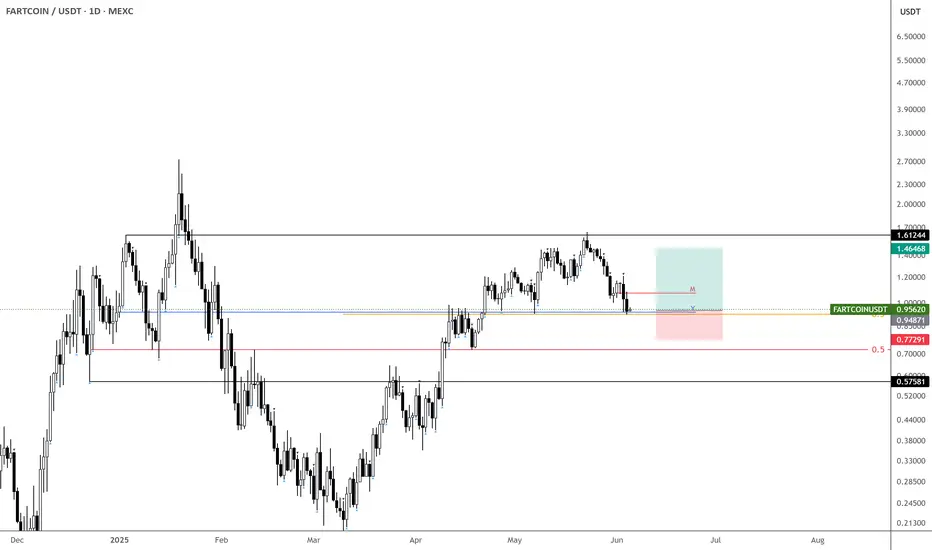
$FARTCOIN - HTF DemandMEXC:FARTCOINUSDT | 1D
If CRYPTOCAP:BTC makes another upthrust to sweep the highs, Fartcoin could test the 1.20–1.30 zone
If $1 is lost, the next support is around 0.94 to 0.87.
Failure to reclaim 1.20 on the upside increases the risk of revisiting the higher timeframe demand at 0.64–0.50.

Small Farts - No Smell Gurantee!Okay so farts this is a small move you can take in conisderation to be taken in the near times! Idle scenario and stances marked!
FARTCOIN | Midrange Retest After Rejection from Range HighClassic midrange scenario: defend $0.97 for another leg up, or risk testing the lower demand.
$FARTCOIN - $1 Bearish Retest MEXC:FARTCOINUSDT | 1D
Just a quick update:
Fartcoin hit our LTF support at 0.88 and is holding so far.
If CRYPTOCAP:BTC can stay above 103k–102.7k, we could see a retest of $1
From there, we'll see if we're going to revisit the HTF demand at 0.64–0.50
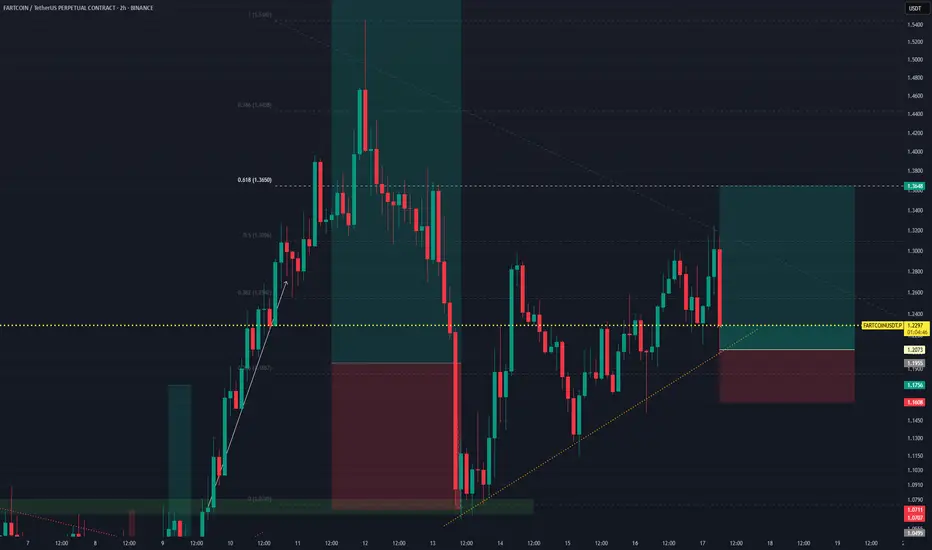
FARTCOINUSDT Bullish Breakout Setup – Retest OpportunityFARTCOINUSDT shows a potential bullish breakout from a falling wedge pattern. Price action breaks the descending trendline and comes back for a clean retest at a key confluence zone near horizontal support and wedge resistance turned support. This offers a high-probability long entry with minimal downside risk and a wide upside target.
Trade Details:
Entry Price: 1.2073 USDT (area antara zona hijau dan merah)
Take Profit (TP): 1.3648 USDT
Stop Loss (SL): 1.1608 USDT
Risk:Reward Ratio (RRR): 1 : 3.96
Potential Gain: +0.1575 USDT → +13.05%
Potential Loss: -0.0465 USDT → -3.85%

They laughed at the name. I loaded the setupPrice action doesn’t care about branding — it cares about imbalance, volume, and delivery. And FARTCOIN just hit a prime liquidity pocket with mechanical precision.
The structure:
After a fast drop, price tagged the 0.618 fib at 1.1607, which also aligns with the high-volume node (visible range) — a zone where Smart Money absorbs without headlines.
Below that? Void. Above? Rebalancing targets:
1.1870 (0.5 fib)
1.2133 (0.382)
1.2458 (0.236)
Full recovery to 1.2960 if liquidity calls for it
Volume has thinned on the pullback — ideal. That’s not fear. That’s vacuum.
Expectation:
We chop sideways here before liftoff. I’m not chasing — I’m letting the structure compress and then watching for the breakout reclaim above 1.1635.
Execution:
Entry: 1.1500–1.1600
SL: 1.1220 (below .786 fib)
TP1: 1.1870
TP2: 1.2130
TP3: 1.2450
Final target: 1.2960 full draw
This chart may trigger jokes — the move it’s building won’t.
Final thought:
“I don’t care what they call it. I care where Smart Money enters.”
FARTCOIN | Dream scenarioTextbook ABC correction into the $0.83–0.75 zone.
Will the fartcoin gods let us bid sub $1 again? Odds are low, but man can dream.
If filled, expecting a big wave up — ultimate R/R.
Main risk: market front-runs and never fills — be nimble, ladder bids if you're serious.
"If you get the dream fill, don't fumble the bag."

I never knew FART has directions!So normal farts make sounds this fart gives direction - LOL Direction of whats gonna happen, the fall till yellow to be seen but first moves to top in place!

FARTCOIN - The air is heavy and not smellyFartCoin moves are to be there when fall is done at bottom and moves from there at top, but moves are very to be seen soon!
Farts on the MOve!!! Light air goes up, its heavy - and soon 1.56 to be touched in some time if only not btc wrecks!

FARTCOIN – Flipping Long at Key LevelTaking the risk here—already played the short, now flipping to the long side.
Not expecting a new high, but this looks like a good spot for a bounce.
Price is sitting right at a mid-level and holding above the yearly open after a clean flip.
Treating this as a demand zone until it’s broken—if that happens, I’ll flip bearish and wait for a new signal. $fartcoin MEXC:FARTCOINUSDT
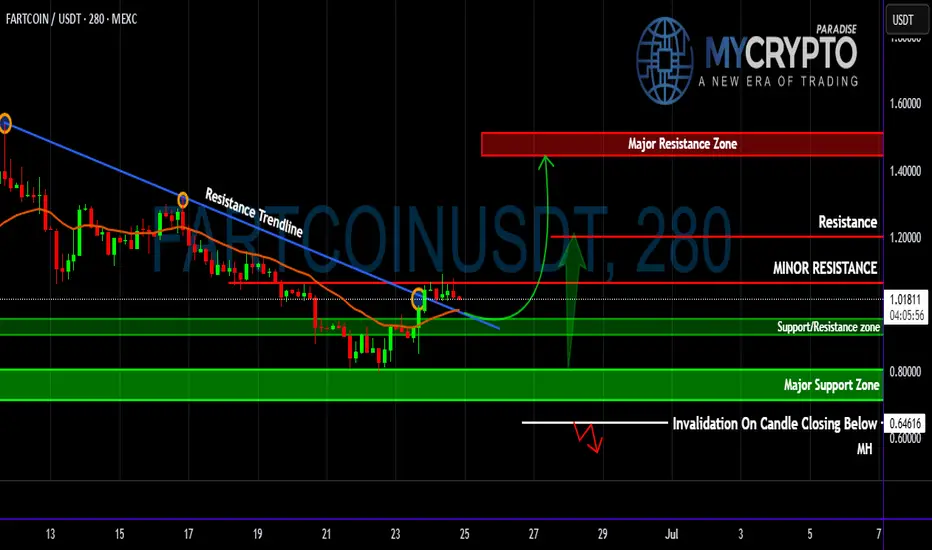
FARTCOIN Flipped Key EMA—Is This the Start of a Pump or Trap?Yello Paradisers ! Are we looking at a breakout that could deliver massive upside, or is this just another emotional trap before the next leg down? The market has been ruthless lately, and unless you base your decisions on structure, probability, and proper confirmation, you’re gambling—not trading. Let’s break down this #FARTCOIN setup from a professional standpoint.
💎#FARTCOIN has finally broken above a clearly defined descending resistance trendline, signaling a potential probable shift in short-term momentum. This breakout occurred precisely as the price reclaimed the multi-timeframe EMA —a key dynamic level that has consistently acted as resistance throughout the downtrend. The reclaim and hold above this EMA significantly increase the probability of a short- to mid-term trend reversal, especially as it aligns with an early attempt to build a bullish market structure.
💎Price is now trading just below a minor resistance level. This zone has capped previous upward attempts and is the first level bulls must overcome for continuation. A confirmed 4H/1H or daily candle close above this resistance will open the door to a measured move toward the next key level at $1.20265, with extended upside potential into the major resistance zone between $1.44660 and $1.55099. Should bullish momentum pick up with increasing volume, a Probable upside move becomes a realistic scenario.
💎However, none of this is guaranteed. We're dealing with probabilities, not certainties. The support/resistance flip zone between $0.95949 and $0.90596 now becomes a crucial reference point. A healthy retest of this area could provide a higher-probability long entry, especially if price continues to respect the reclaimed EMA. Below that, the major support zone from $0.80693 to $0.71058 represents a broader demand block. If the price pulls back this far, it may signal the formation of a larger accumulation range rather than immediate continuation.
💎To manage risk effectively, traders must monitor the invalidation level at $0.64616. A 4H candle close below this level would nullify the bullish breakout scenario and increase the probability of renewed bearish control, suggesting the recent breakout was a deviation or fakeout.
Stay sharp, Paradisers! Will this be a breakout or a fake-out? Only time—and disciplined trading—will tell!
MyCryptoParadise
iFeel the success🌴
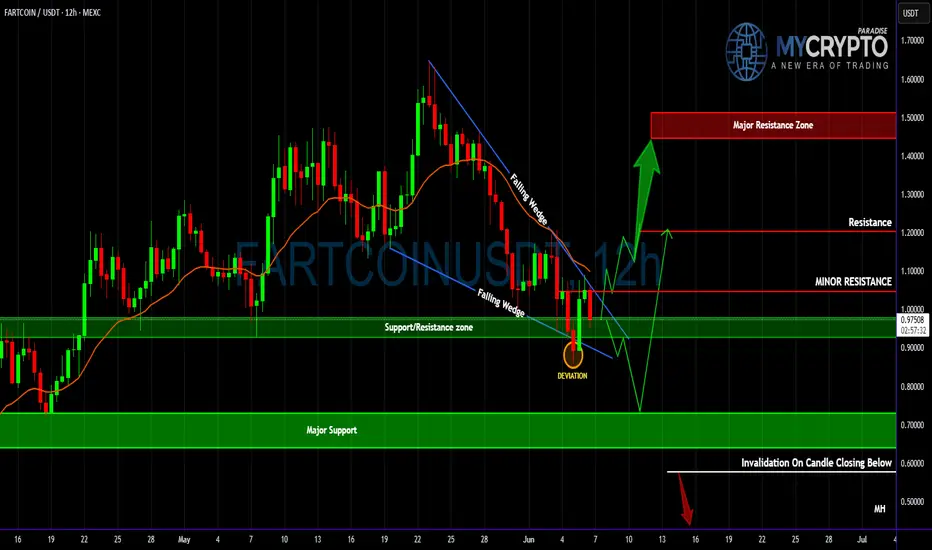
FARTCOIN’s - High Probability Breakout or Devastating Trap?Yello Paradisers, are you truly prepared for what #FARTCOIN is signaling right now? Because this setup is dripping with opportunity—but only for those who understand market structure and probability. After a steady grind lower inside a clean falling wedge formation, price just printed a high-probability deviation below the key support/resistance zone before snapping back inside. That kind of fakeout is no joke—it’s often the precursor to a major reversal. But will this deviation mark the beginning of a bullish surge, or is it a calculated trap before another leg down?
💎#FARTCOIN is hovering just above the reclaimed support/resistance area between 0.95 and 1.00. Historically, this level has played a pivotal role. The recent deviation below and swift recovery adds to the probability that this is a classic shakeout—designed to liquidate weak longs and trap aggressive shorts. However, we must be cautious.
💎Hovering above price is the multi-timeframe EMA (represented by the orange line), which is currently serving as dynamic resistance. As long as this EMA remains unbroken, bullish momentum is at risk of stalling. The probability of continuation only rises significantly if this EMA is reclaimed with strong candle closure above it.
💎The next obstacle is the minor resistance zone around 1.04667. A sustained breakout above this level will increase the probability of a move toward 1.20265, and if momentum builds, there’s a strong case for price to reach into the higher time frame major resistance zone between 1.45 and 1.50. However, we’re not there yet—and probability works both ways.
💎Should FARTCOIN fail to hold the reclaimed zone, or if price gets rejected at either the EMA or minor resistance, the bearish scenario comes back into play. In that case, price could collapse back into the wedge, increasing the likelihood of a drop toward the major support range between 0.73 and 0.64. Even worse, a confirmed 12-hour candle close below 0.60 would invalidate the entire bullish wedge setup and open the probability for a deeper correction.
This is the point where the weak hands get shaken out and smart money reloads, Paradisers. If you're aiming for long-term success, wait for high-probability setups and protect your capital. Strive for consistency, not quick profits. Treat the market as a businessman, not as a gambler.
MyCryptoParadise
iFeel the success🌴
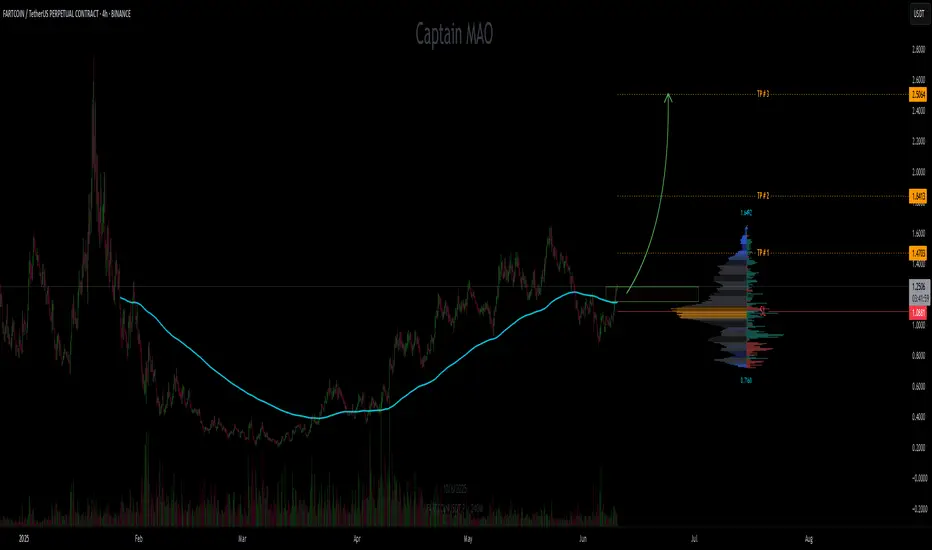
FARTCOIN/USDT Risk/Reward Ratio: 11
Entry Zone: $1.15 – $1.25 (green box)
TP1: $1.47
TP2: $1.82
TP3: $2.50
Stop Loss: $1.09
Price has already reclaimed the $1.18 level and broken out above the previous swing high — confirmation of bullish momentum is in place. Trade now active within entry zone. Eyes on continuation toward higher targets with tight risk management.
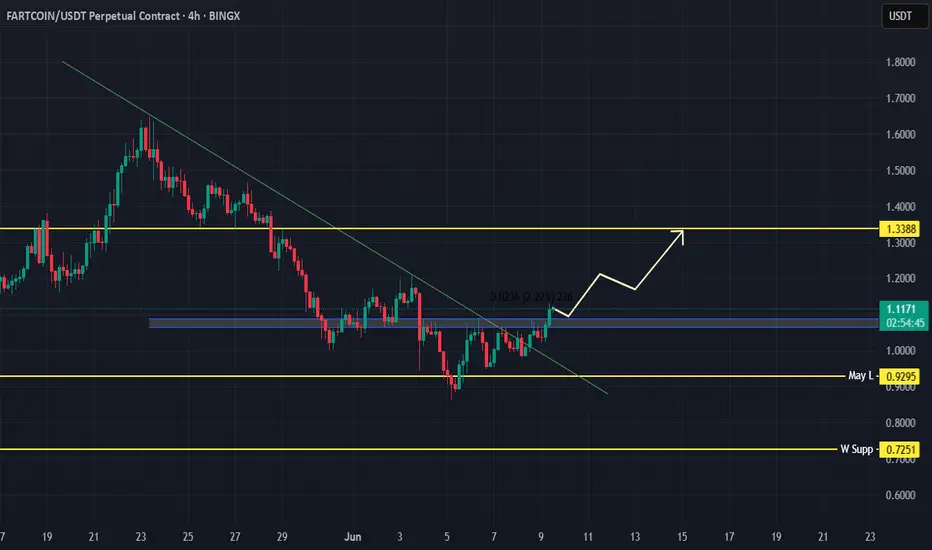
FARTCOIN Breakout📈 FARTCOIN/USDT - 4H Chart Analysis
FARTCOIN has successfully broken above the descending trendline, signaling a potential shift in market structure. The current price action is showing strong bullish momentum after reclaiming the key support zone around $1.05–$1.08 (highlighted in blue).
🔹 Bullish Scenario:
Price is expected to retest the breakout zone before continuing its upward movement. A successful retest could lead to a rally towards the next major resistance level at $1.3388, which aligns with a previous supply zone.
🔹 Key Levels:
Support: $1.05–$1.08 (zone)
May Low: $0.9295
Resistance Target: $1.3388
🔹 Market Structure:
The downtrend has been invalidated with a strong breakout, and higher highs/lows are forming. As long as the price holds above the blue zone, the bullish bias remains valid.
🚨 Watch for confirmation on the retest before entering. A strong bullish candle off support would be an ideal entry trigger.
FARTCOIN/USDT LongCrosspoint of confluence between 3 possible triggers.
Namely:
- Inverted Triangle structure (bullish)
- Invalidation of downtrend
- bounce of a semi-strong support
I would be longing this for 3R.
Let‘s see..

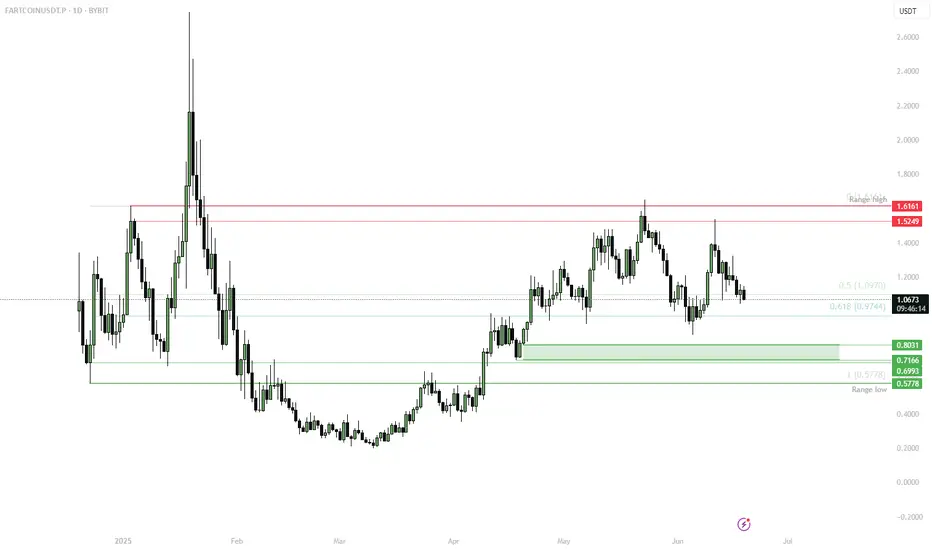
FARTCOIN | Bounce from Range Low, But Risks RemainPrice has bounced from the range low near $0.92, with early RSI divergence suggesting potential short-term relief. However, the structure remains fragile unless price reclaims key resistance.
🟩 Support:
• $0.92 = Range Low
• Break below = fast drop to $0.60
🔴 Resistance to Watch:
• $1.21 = Key rejection zone
• Above $1.21 opens up space toward the range high at $1.45–1.50
📉 Risk Scenario:
• Bearish continuation if $0.92 fails
• Targets: $0.73–0.60 (HTF demand)
📈 Bullish Case:
• Strong reclaim of $1.21
• RSI recovery confirms bottoming — reopens path to range top
📌 Range low bounce is intact — but strength only confirmed above resistance. Mid-range = caution zone.

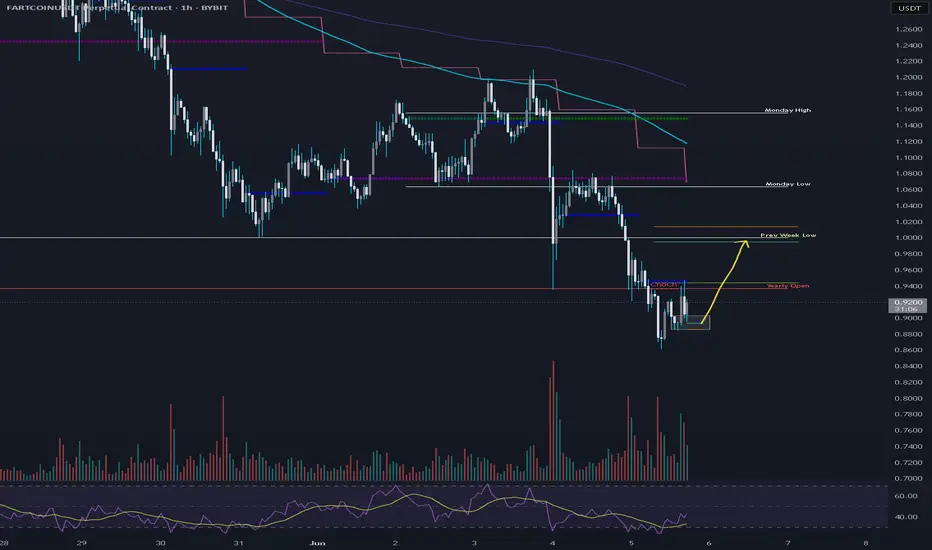
FARTCOIN Short termShort term price action on fartcoin is pretty straight forward . Unless BTC nukes under 102k right now , this scenario is unlikely to fail .
From 1h supply zone to .618 + prev week low as a target . 0.975 - 1.00 .