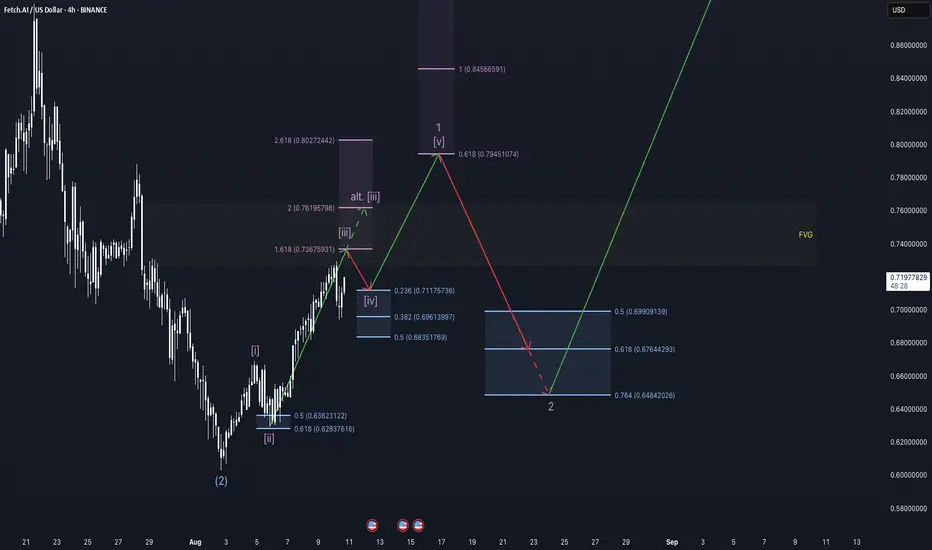
Mirroring alts - FET weekly update August 10 - 16thFetch.ai (FET) is advancing within a multi-degree Elliott Wave alignment that mirrors the structures seen across many other altcoins. At the Cycle degree, price is in Wave 1; at the Primary degree, a completed 1–2 structure suggests that Wave 3 is now underway; at the Intermediate degree, the same 1–2 formation implies another Wave 3; at the Minor degree, price is currently in Wave 1; and at the Minute degree, price is in the late stages of Wave 3, which is likely to end inside the highlighted Fair Value Gap (FVG).
Once this smaller Wave 3 completes, a short-lived Wave 4 pullback is expected, followed by Wave 5 to finish Minor Wave 1. A deeper retracement into the 0.5–0.764 Fibonacci zone would then be possible as part of Minor Wave 2 before the next sustained advance. The structure remains bullish as long as key support levels hold.
From a sentiment and liquidity standpoint, funding rates are positive, indicating a bias toward long positions. The liquidity heatmap shows only limited liquidity above current price, while there is more liquidity resting below — a configuration that could allow for a quick liquidity sweep before continuation.
This chart pattern is notably similar to many other altcoin structures right now, reflecting the high degree of correlation within the crypto market. If Bitcoin confirms its own bullish wave count, these aligned setups could trigger synchronized breakouts. Conversely, a BTC rejection could weigh on all correlated altcoins, including FET.
In the broader macroeconomic context, the CME FedWatch Tool indicates a 88,9% probability of a Federal Reserve rate cut at the September FOMC meeting. Markets often front-run such decisions, and this could act as a catalyst for impulsive Wave 3 rallies across crypto. However, heavily skewed bullish sentiment increases the risk of a “sell-the-news” event if traders over-leverage ahead of the announcement. Institutional accumulation likely occurred earlier in the cycle, leaving retail traders to drive the next legs higher.
As long as structural support remains intact and the anticipated Wave 4–5 sequence plays out, FET appears well-positioned for continuation — in alignment with the bullish setups currently visible across much of the altcoin market.
FETUSD trade ideas
TriangleIf price closes below the trendline(white line on chart)there is a possibility, for price to touch the Demand Zone below. If price breaks resistance around the 0.83 area the asset can touch the 1.00 area. Please be careful of fakeouts and liquidations and consolidations.
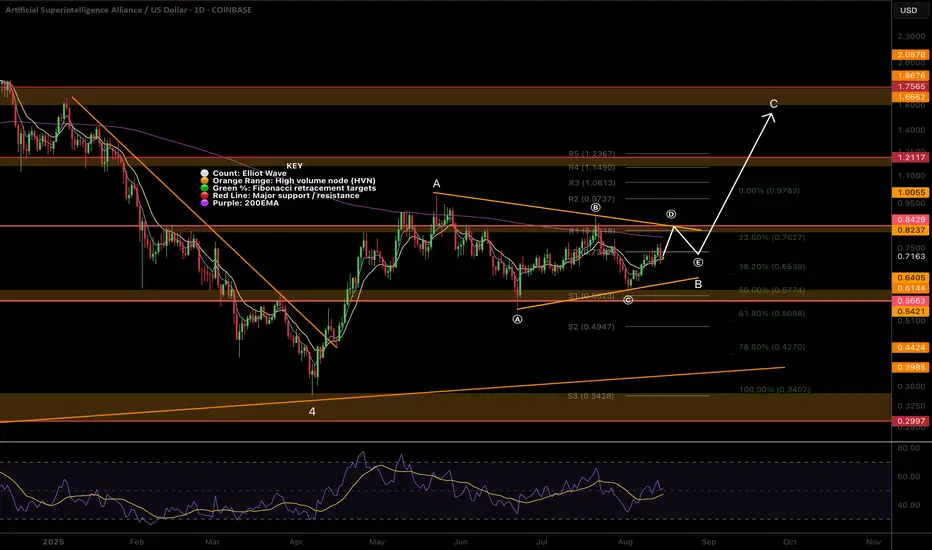
$FET Elliot Wave Updated, Triangle forming?NYSE:FET appears to be printing a triangle in a larger degree wave B of an ABC counter-bear trend correction.
Wave (D) is expected to finish at the descending resistance, poking above the daily 200EMA, while wave (e) is often shallow so expected to end at the daily pivot point. The target is $1.6 at he triangle pattern depth and major High Volume Node resistance.
An ABC corrective wave does not mean that the macro count is invalidated and may form part of larger ending diagonal series of ABCs to achieve my high degree wave 5 targets above all time high. I will update the weekly chart to reflect this shortly.
Safe trading
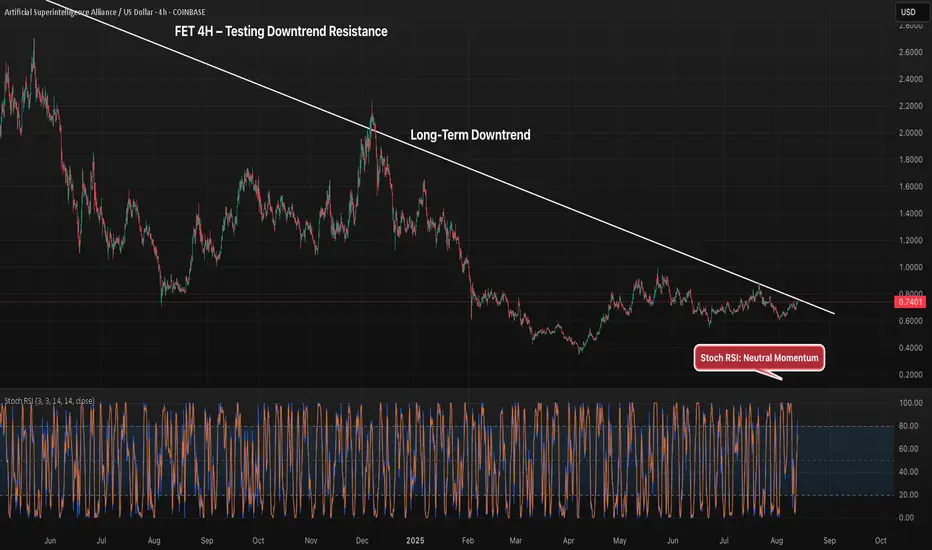
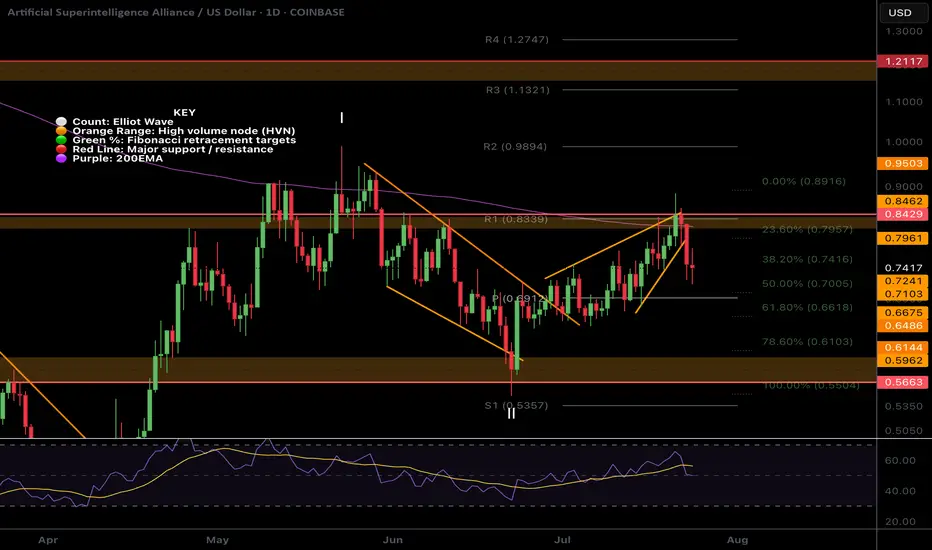
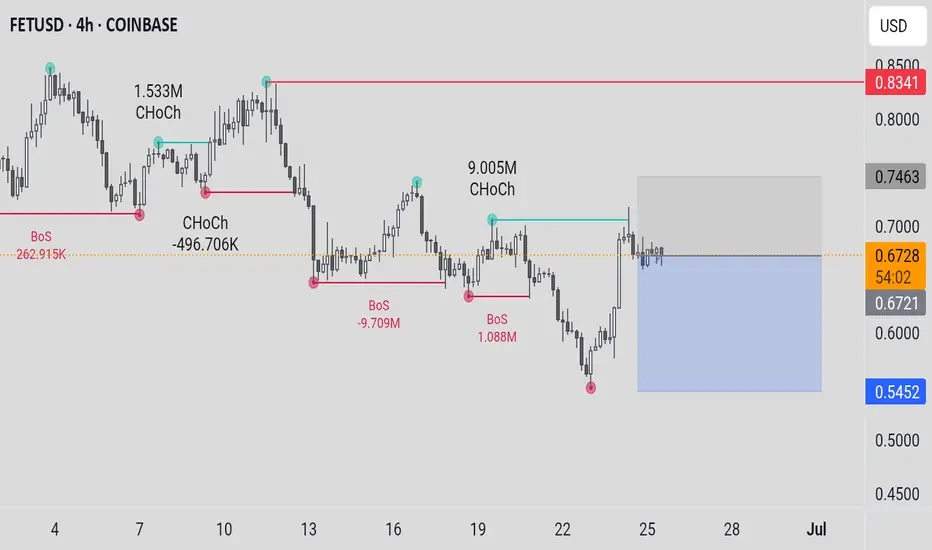
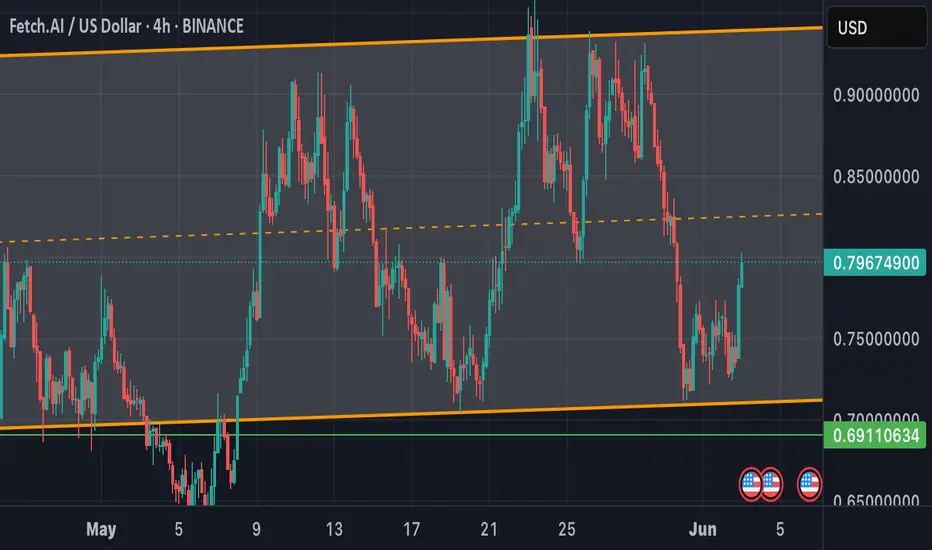
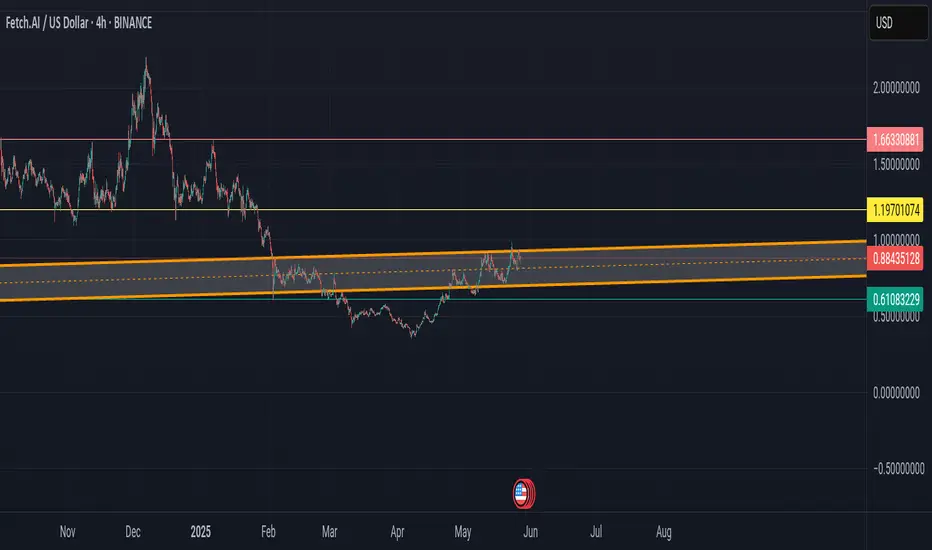
FET 4H – Approaching Key Downtrend Breakout LevelFET is trading just below its long-term descending trendline, a level that has capped multiple rallies since mid-2024. Price action is tightening, suggesting a potential breakout or rejection in the coming sessions. Momentum is neutral on the Stoch RSI, leaving room for either direction. A confirmed breakout above $0.77 could target $0.88–$0.90, while rejection would likely see a pullback toward $0.68 support.
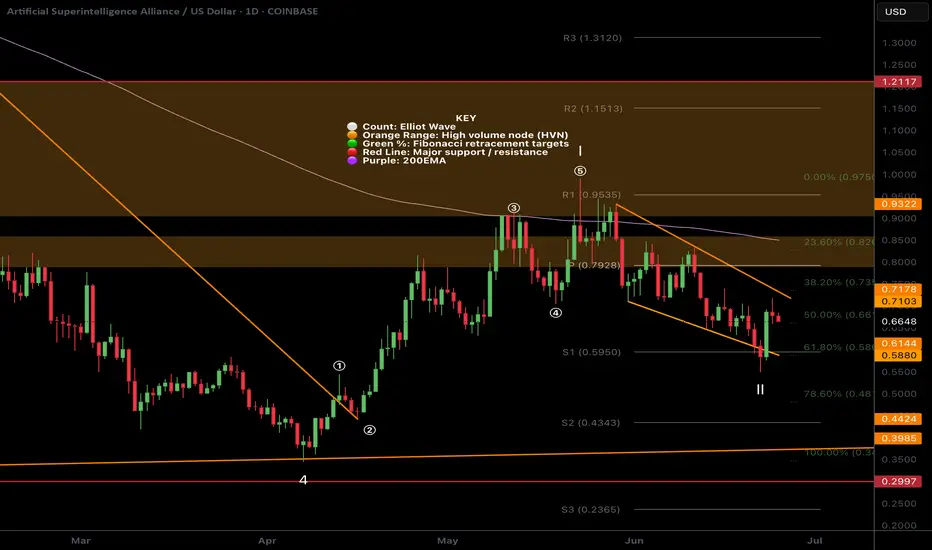
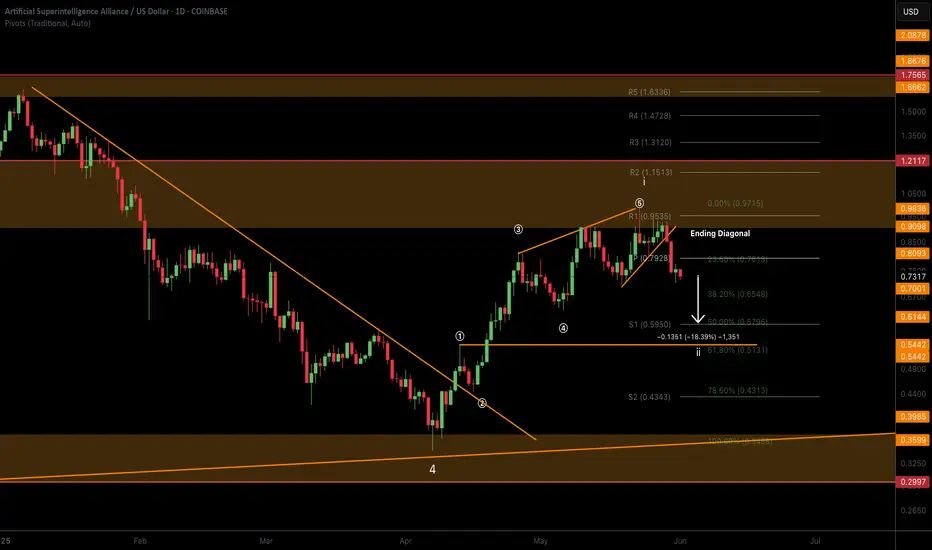
$FET local ending Diagonal and wave 2 near completion?NYSE:FET was rejected for the 4th time at the daily 200EMA! Each time the probability of a breakout increases.
I have adjusted the High Volume Nodes for accuracy.
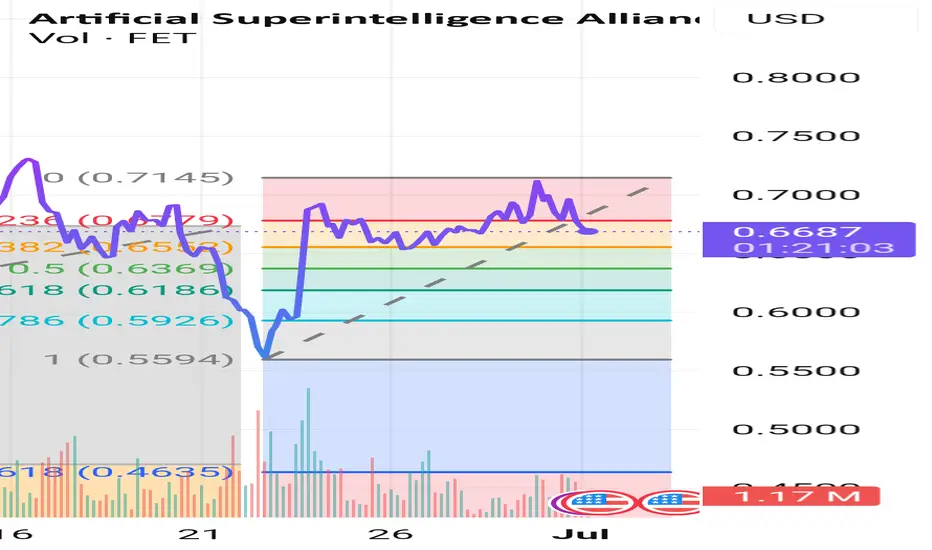
Locally Fetch appears to have completed a motif wave up with an ending diagonal for wave 5. Wave 2 is expected to find support at the daily pivot and .618 Fibonacci retracement before attempting a breakout of the daily 200EMA once more.
A move below wave II will invalidate this analysis.
Safe trading
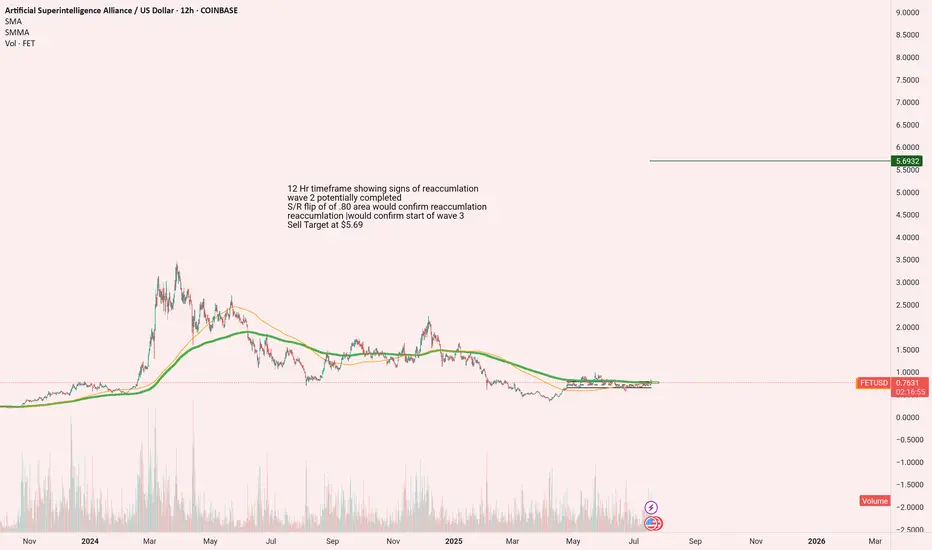
LONG FET - Reaccumlation IMO12 Hr timeframe showing signs of reaccumlation
Wave 2 potentially completed
S/R flip of of .80 area would confirm reaccumlation
reaccumlation would confirm start of wave 3
Sell Target at $5.69 if 0.80 area is flipped to support
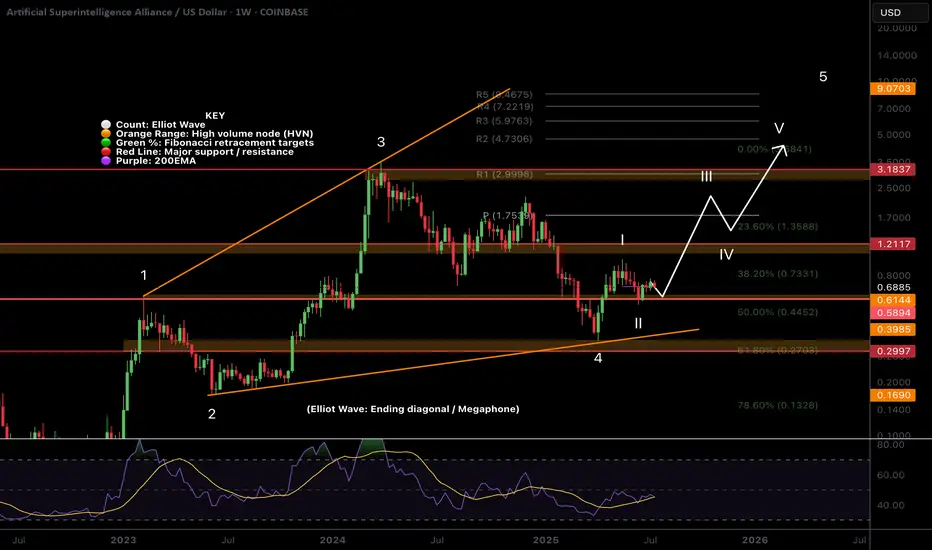
$FET Does Zooming out look better?NYSE:FET has been underperforming lately and the local chart looks trash so I wanted to zoom out to give us all some context on the larger picture which hasn't really changed.
Price appears to have completed wave II at the High Volume Node (HVN) support and 0.5- 0.618 'Golden Pocket' Fibonacci retracement and wave 3 is underway but finding local resistance.
Pivots are warped due to the strength of the move last year so wouldn't count them as reliable so focusing on support and resistance. The megaphone pattern is clear and the next area of resistance when FET starts moving is the $1.2
Weekly RSI is decreasing and is attempting to cross bearishly. If Bitcoin has a significant pullback I would expect new lows for FET at this rate. I have a neutral stance at this point.
Analysis is invalidated below $0.546
Safe trading
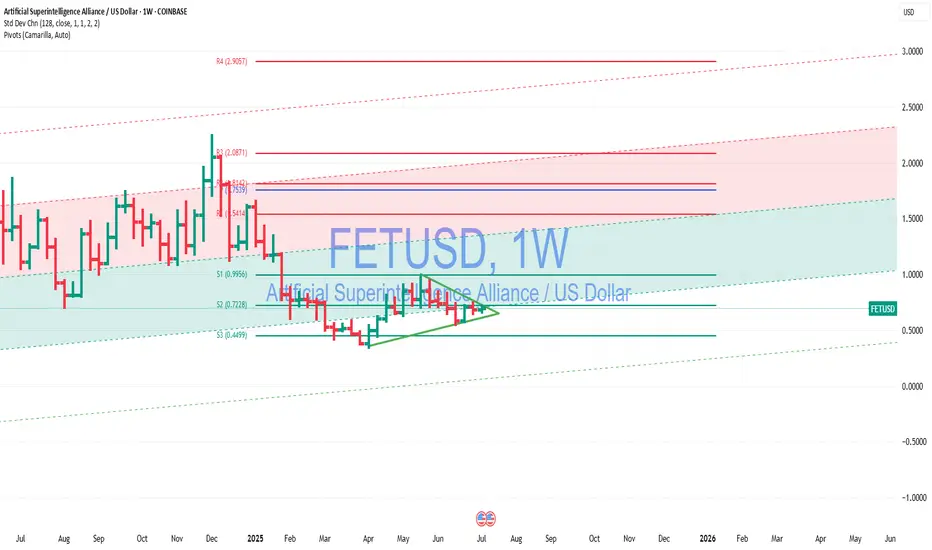
FET ABOUT TO BREAKOUT?Hello fellow traders as we can see here on the chart I believe FET has hit its bottom and about to push further and breakout to the upside. We have a bullish pennant forming on the weekly chart. We have fallen and come back above the S3 pivot. Stochastic resetting and MACD rising. I am a mean reversion trader so for me minimum on this trade is $1.30. After this assuming the breakout continues then $2 and $3. Stop loss below that invalidation point being 0.3439 on the Weekly chart. Points of resistance are 0.96C and $1.50. If Alt coin season arrives before this breakout I will update the trade with further price targets. As always NFA, trade the higher time frames Daily, Weekly, Monthly this is where smart money trades!. Use proper risk management. Best of luck to everyone. Open to feedback and criticism :)
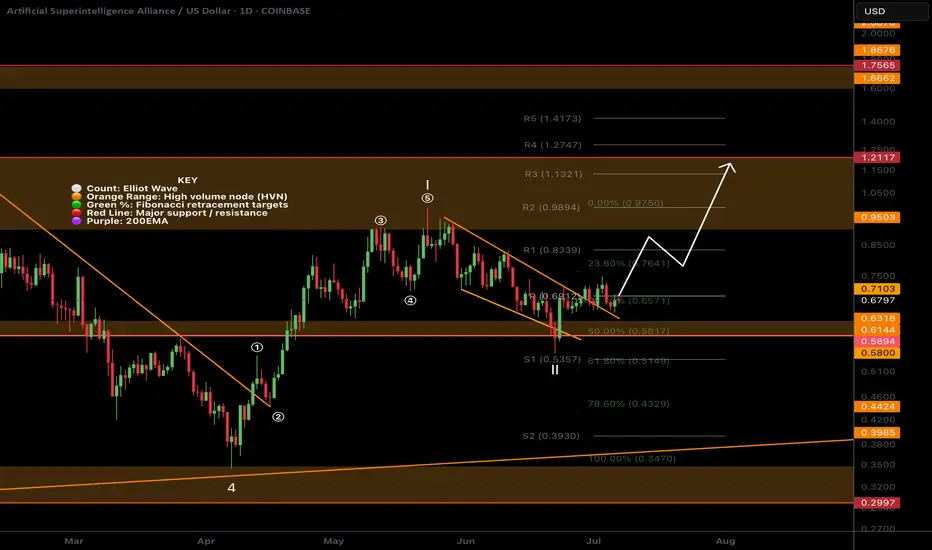
$FET Ready for the next move up?NYSE:FET looks ready for the next move up with a similar analysis to many other alts I have shared.
It is breaking out of descending resistance after testing the .618 Fibonacci retracement and High Volume Node (HVN) as support. Price broke above the daily pivot and is now swinging below, a recovery above the local swing high will be a bullish signal to go long with a wave 3 target of the R3 daily pivot and major resistance HVN at $1.13.
Analysis is invalidated below $0.54
Safe trading
Fetch way five up two waves down?Fetch looks to consolidate down to the .618 fib level .63? fetch topped out at .72 not quite break out 7.4.. Looks like .72 was the high or will a bounce of support and go on a wave five break out?
FETUSDTCryptocurrency Futures Market Disclaimer
Trading cryptocurrency futures involves high risks and is not suitable for all investors. Cryptocurrency prices are highly volatile, which can lead to significant gains or losses in a short period. Before engaging in crypto futures trading, consider your risk tolerance, experience, and financial situation.
Risk of Loss: You may lose more than your initial capital due to the leveraged nature of futures. You are fully responsible for any losses incurred.
Market Volatility: Crypto prices can fluctuate significantly due to factors such as market sentiment, regulations, or unforeseen events.
Leverage Risk: The use of leverage can amplify profits but also increases the risk of total loss.
Regulatory Uncertainty: Regulations related to cryptocurrencies vary by jurisdiction and may change, affecting the value or legality of trading.
Technical Risks: Platform disruptions, hacking, or technical issues may result in losses.
This information is not financial, investment, or trading advice. Consult a professional financial advisor before making decisions. We are not liable for any losses or damages arising from cryptocurrency futures trading.
Note: Ensure compliance with local regulations regarding cryptocurrency trading in your region.
FET Wave 2 Complete?NYSE:FET (Fetch.ai) appears to have completed a wave 2 pullback and looks set for the next move up towards $1.1
Price swung below the bottom of the wedge, tested the S1 daily pivot and 61.8 Fibonacci golden pocket. It quickly recovered with a bullish engulfing daily candle negating the 3 previous days bearish price action.
A close above the top wedge line and daily pivot will be the signal to go long again.
Analysis is invalidated below $0.54 and that will bring up a downside target of $0.34 which is the ascending macro support from June 2023.
Safe trading
Is Fetch heading for long term support?Looks like fetchHe's heading for long term support about the .50 which is the fifty percent retracement level. After this, will it bounce back the .090 or higher.
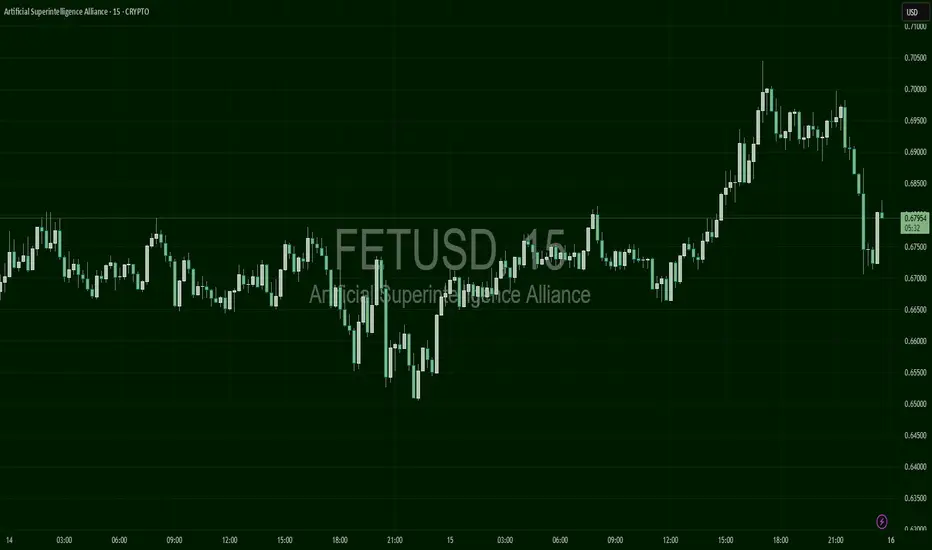
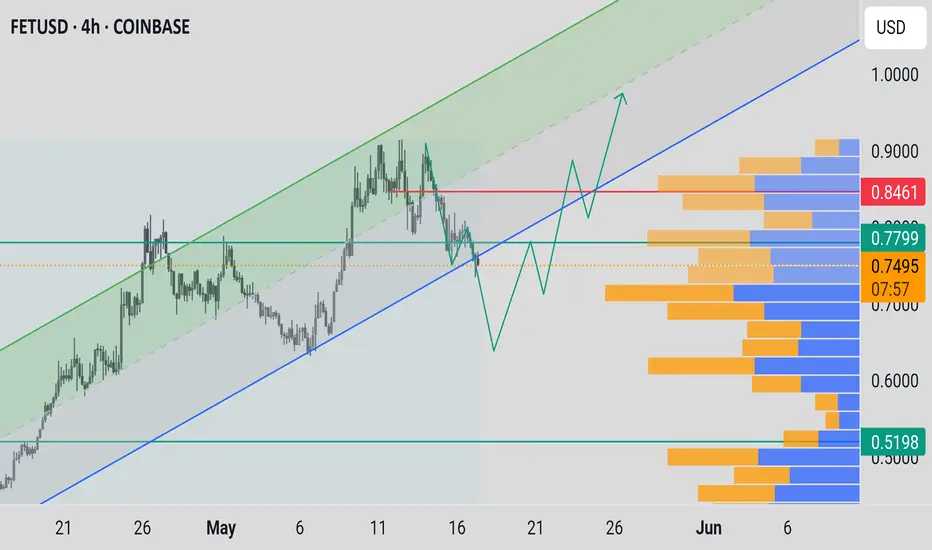
FETUSD – Post-Breakout CooldownFetch showed a period of quiet sideways movement before breaking out sharply toward $0.70. The rally was followed by a rejection and pullback near resistance, currently stabilizing above $0.675.
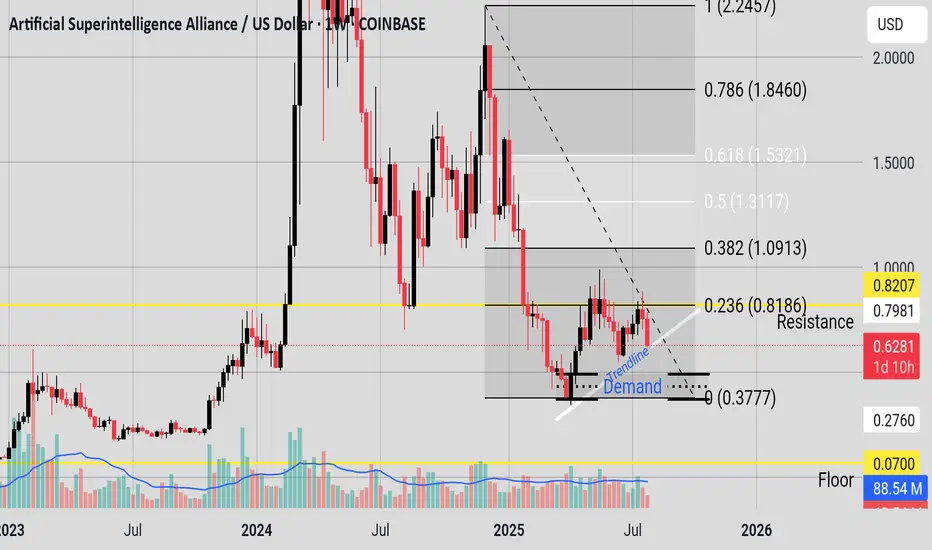
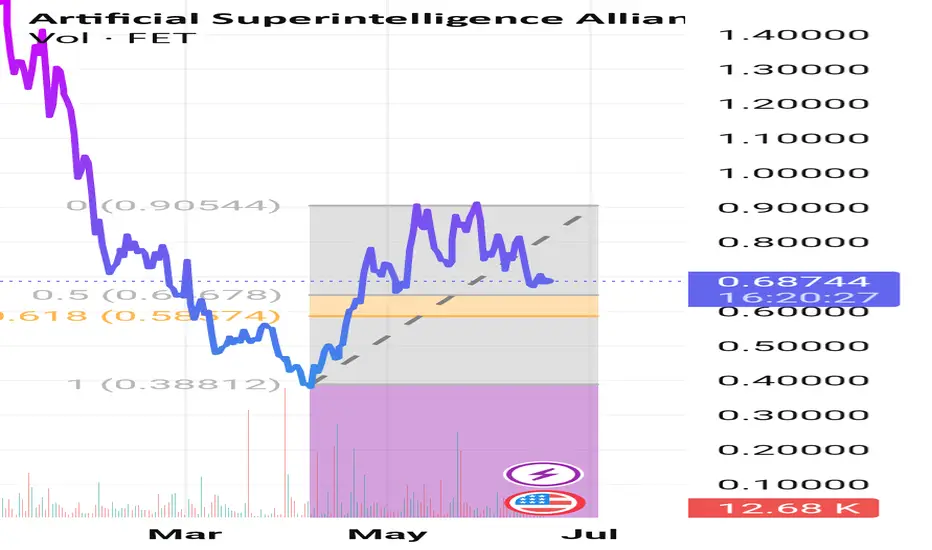
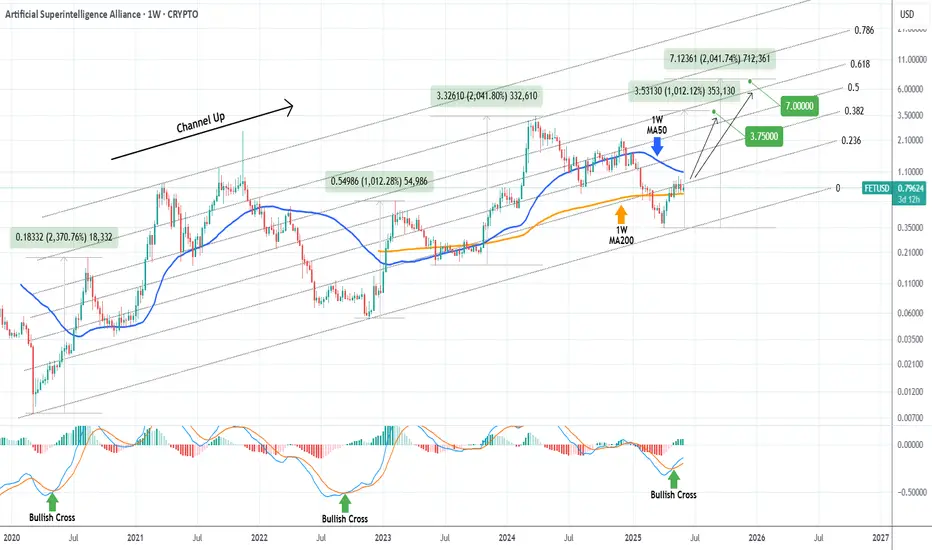
FETUSD is an excellent buy, targeting at least $3.75Artificial Superintelligence Alliance (FETUSD) or otherwise known as FETCH.AI has been trading within a multi-year Channel Up and right now is on its latest Bullish Leg and quite possibly the last for this Cycle.
Given that all similar Bullish Legs that started with 1W MACD Bullish Crosses that low, grew by at least +1012%, we expect a minimum Target for this Cycle at $3.75. If it follows the more aggressive +2041% rise of 2023/ 2024, we can even see $7.00 but that is the more optimistic scenario.
-------------------------------------------------------------------------------
** Please LIKE 👍, FOLLOW ✅, SHARE 🙌 and COMMENT ✍ if you enjoy this idea! Also share your ideas and charts in the comments section below! This is best way to keep it relevant, support us, keep the content here free and allow the idea to reach as many people as possible. **
-------------------------------------------------------------------------------
💸💸💸💸💸💸
👇 👇 👇 👇 👇 👇
FETAI SURGING TO 2$ canadian by summer. Perfectly bouncing in the support resistance bull climb dating back to when the coin first came about BUY NOW
Fet (Daily) Elliot Wave ii underway after ending diagonalFetch appears to have completed a motif wave (1) with an ending diagonal after finding a bottom at the major support high volume node (HVN) macro wave 4.
Wave 2 has not retraced as deep as other alt coins showing strength in the move up. The downside target is just above the wave (1) swing high, the 0.618 Fibonacci Retracement.
Wave 3 should be a powerful move up taking price into all time high.
Failure to hold this support could see price heading back to fresh lows and testing the $0.35 HVN once more.
Safe trading
Fet.ai will be 10$ cad eoyWith Ai advancing in tech and crypto, with the potential of crypto and Ai.. this is a winner of a coin.
Been volatile BUT stable.
Support in the channel it dates back to 2021.
Buy zone .80/.87 looking for 1.16/1.60 usd or cad equivalent for small profit take
FETUSDTSET UP BUY LIMIT FEDUSDT 📈📝🚨🚨
DISCLAIMER:
what I share here is just personal research, all based on my hobby and love of speculation intelligence.
The data I share does not come from financial advice.
Use controlled risk, not an invitation to buy and sell certain assets, because it all comes back to each individual.
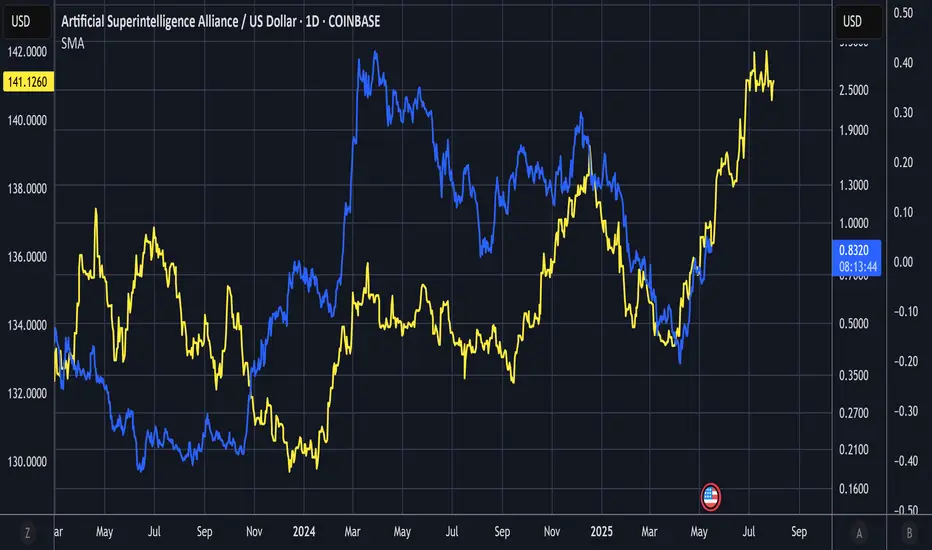
FET Vs Global Liquidity FETUSD (Blue) / Global Liquidity (Yellow)
Global liquidity if offset by 78 days.
Could be a significant uptrend in the pipeline.
Not advice.
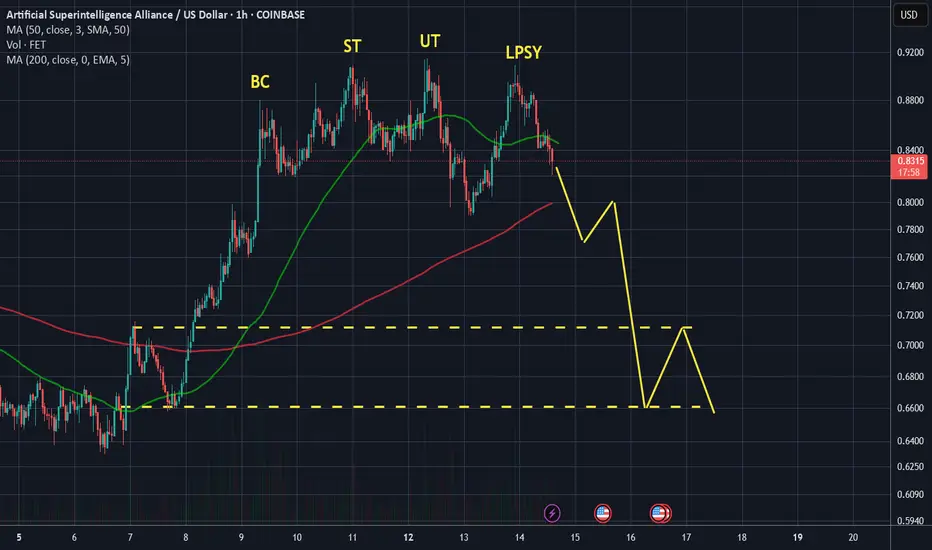
Wyckoff distribution on FET/USDI noticed this Wyckoff distribution pattern that has formed on the 1h time frame for FET/USD and it convinced me this might be a good time to step out and wait.
The crypto market has been going sideways since last week now and we didn't really get a strong rebound after the selloff a few days ago. Even with the positive Macro news it's starting to feel like there's just not enough buyers around right now to push BTC and everything else to higher highs. My advice is to be cautions now and wait for a correction, then enter at more favorable prices.
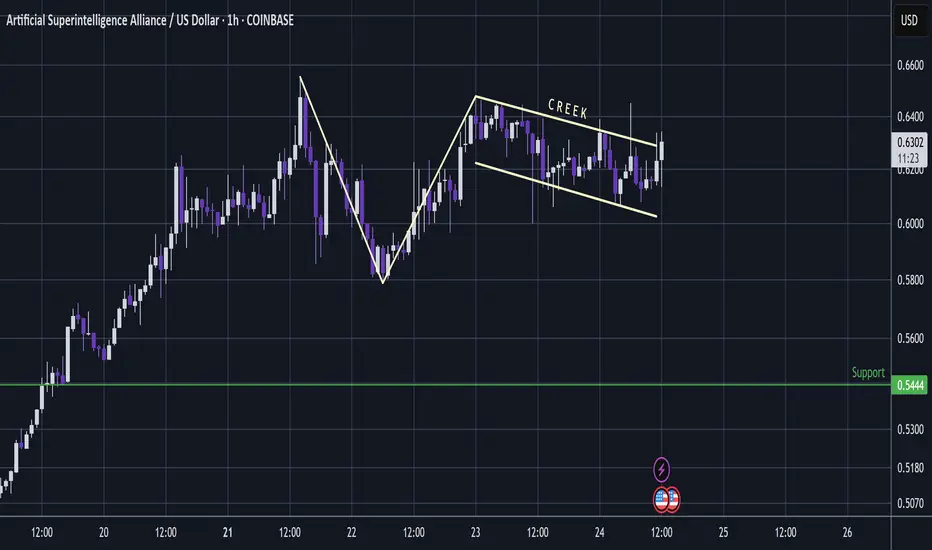
FET - Next Pump Comin SoonFET
Looks like a 3 wave correction with shallow and cause building 3rd wave that you could call a Wycoff Creek.
Could be a great buy right here; looks set to pump again soon.
FET apparently is a super big deal in AI and it has a super long name to boot.
This coin really does pump hard.
If you can buy the dip right then it can be a great ride.
This was a deep dip back in the 2023:
And the first solid dip in this wave up was as the 2 week candle closed a hammer within a 1:1.618 Golden Window.
And this is a nice opportunity here before this coin becomes a runaway train again.
Not advice
FETUSDI sold every single FET I had at around 2.50s in May 24 and I've not been really interested in it since then, apart from a few short term traders. It's always been a terrible asset to trade frequently, a pain to wait for it to do its thing and then everything happens in a matter of few weeks. As if it's not enough, the merger made it even less attactive.
Anyway, this chart is from December and finally it's in my buy zone. If the qFVG doesn't hold, then i think it'll go down to htf golden pocket for a 98% retrace from ATH. The team behind is relentlessly building and making partnerships, so i think its time can come again.
