$FET Long Term Forecast #FET Long Term Forecast
When NYSE:FET , MIL:OCEAN and SEED_DONKEYDAN_MARKET_CAP:AGIX merge into CSELK:ASI next week, I don't expect there to be much deviation from price. Especially given NYSE:FET holders are going to get 1:1 for $ASI.
It all depends on where CSELK:ASI lands in the wave up, which is supposed to be in the next week.
A more bullish interpretation goes for triple digits, but the alternation looks good from 2 and 4 in duration and form convincing me we're completing a wave 3.
Good luck.
FETUSD trade ideas
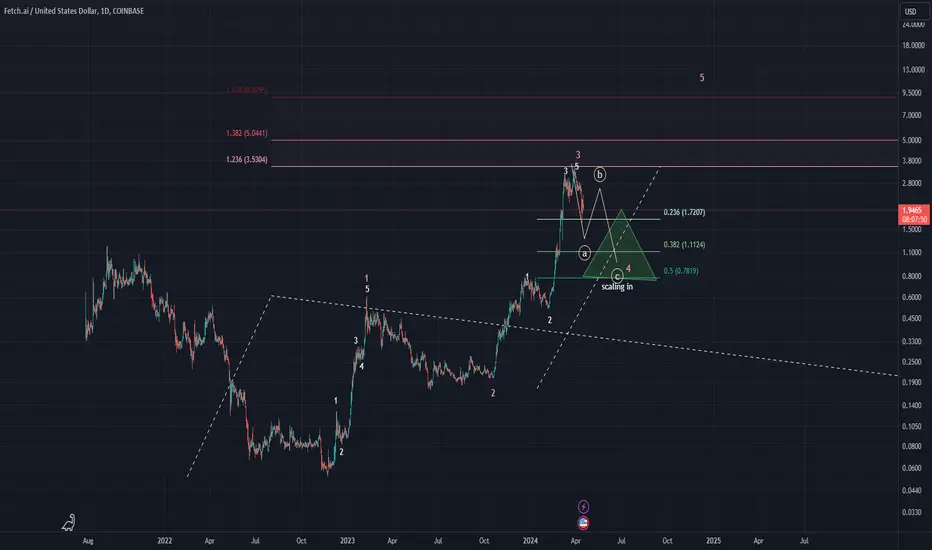
#fetch.ai #fet Long-Term targets, until end of 2025
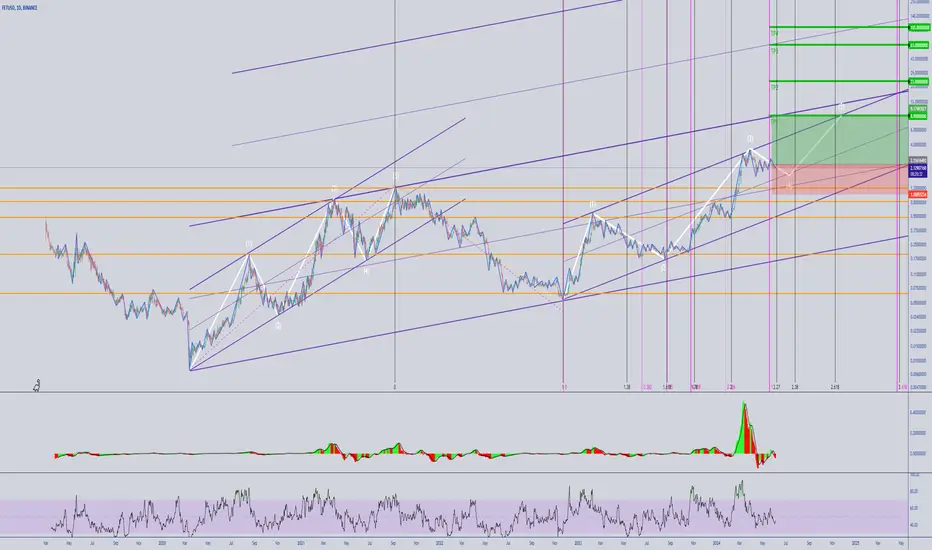
According to Elliott's wave count indicated on the chart, the rise from 2020 to 2021 took place during a five-wave, where either wave 1 is bigger than a five-wave or wave A is bigger than a three-wave.
Considering the possibilities ahead, we can estimate the possible goals of Link until the end of 2025 as follows:
TARGET1: 8.9$
TARGET2: 23$
TARGTE3: 63$
TARGET4: 103$
ENTRY: 2.4-1.3$
STOPLOSS: 1$
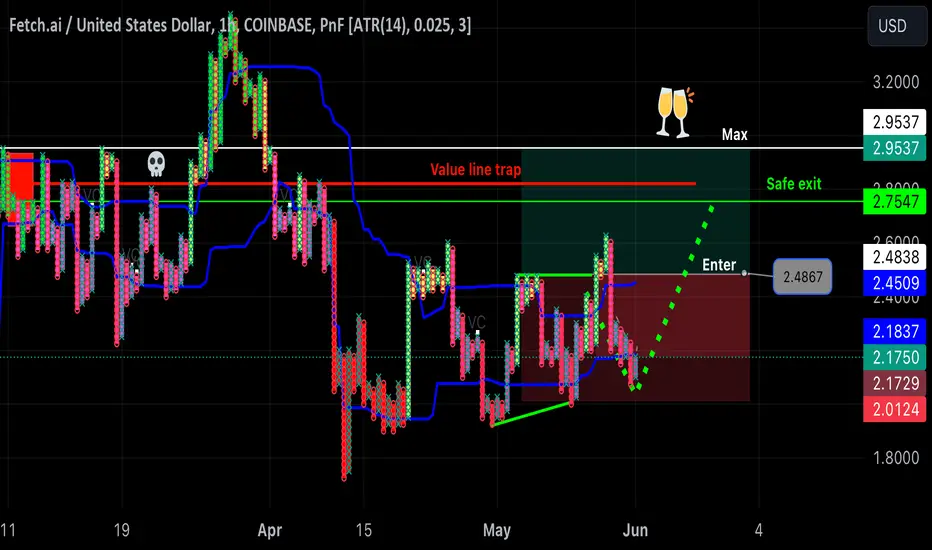
FET Target $2.95 You can buy now or at entry, up to you. ATR KROLL STOP has declared a NOW entry. This indicator is hard to use but it becomes easy to use. I’m sure many don’t use it. If you study it: it works magic. It has a pattern. It took me months to understand it in good and bad times.
Smart money contraction is on a 6min TF.
Double bottom found with point and figure chart type. If you dare mix it with Heiken Ashi, you might get deceived.
If you blind fold yourself to the FET price and just chill and stick to this point and figure, you’ll stay motivated because it has a long longer timer than Heiken Ashi.
FET Still Looks GoodExtreme contraction in price volatility and volume. Crypto environment still looks fine. Still need a follow through move on increased volume, but I like this setup even more now than before.
LONG FETWith the upcoming merge of AI coins to ASI and the chart flow it's looking strong for a switch into bullish action soon. Hopefully breaking ATH to the $4 mark+ by mid June/July
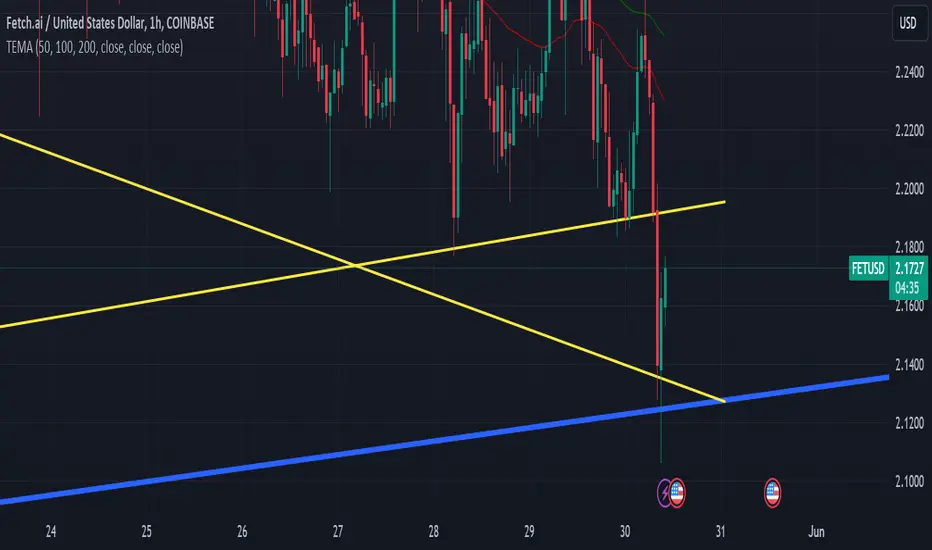
FETUSD Bear FlagLooks as tho FET is making a bear flag. And looking across the ALT coin market. Most coins are looking as they're about to retrace to a higher low. Once that is done. We should see a retest of highs and even breaking out to new ATH #FETUSD
FET looks goodPicture perfect setup. Huge prior advance, 2+ month digestion, extreme volume contraction, volatility contraction.
Obviously dependent on the overall crypto bull market to continue, but if BTC and ETH go, expect FET to be a high-beta play in the crypto space.
FET setting up for a strong moveBINANCE:FETUSDT is setting up for a great opportunity. I'd like to see it clear the blue VWAP anchored to the March high. I'll likely take an entry on breakout and a 2nd on a retest.
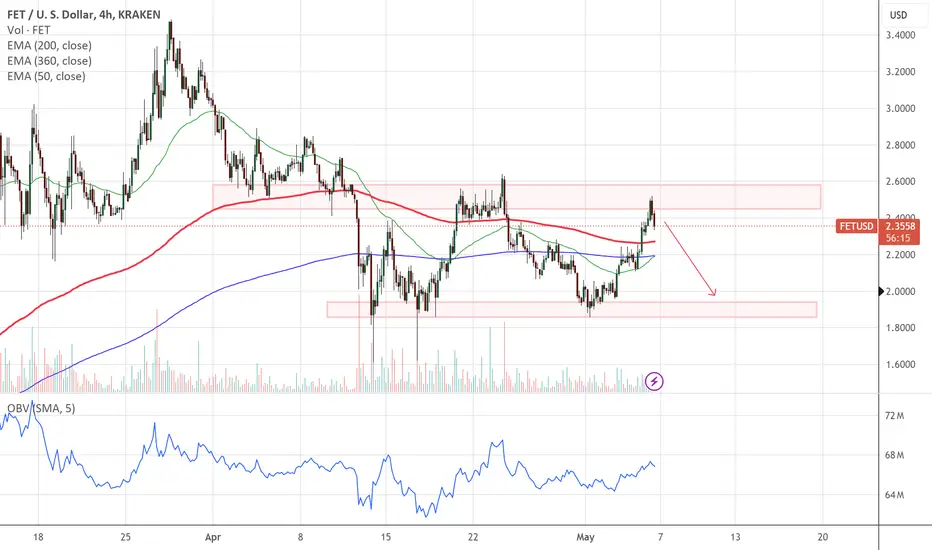
FETUSDT - back to demand zoneIf H4 rejection here confirmed and if EMA200 does not provide support again, we could see FETUSDT trading back below 2$.
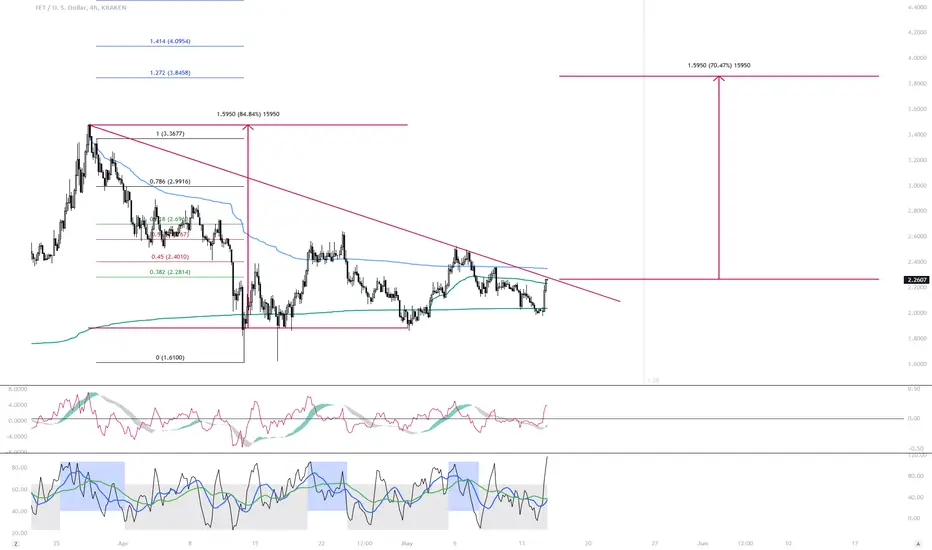
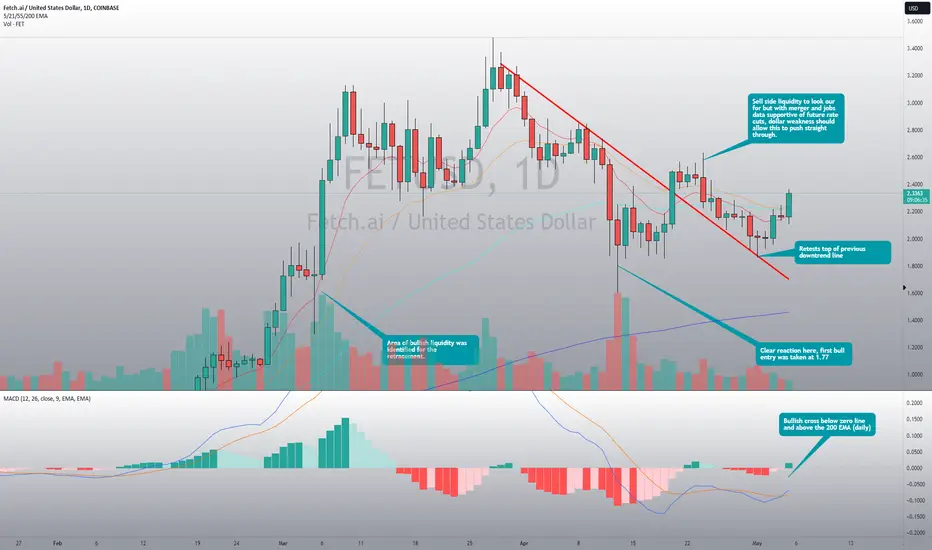
FETCH to go parabolic after retest of local highs at $3.5We have had several key things happen here which are supportive of a retest of previous highs at 3.5 and potential further expansion into the rest of the year.
First take profits were back in March after bullflag created only a minor new high at 3.5. Take profits occurred at $3.
Reinvestment occurred at 1.77 into the previous bull liquidity zone, unfortunately, this did correspond with the Iran/Israel strikes but that's when the market decided to provide those opportunitist fills. I follow my system and not my feelings but I dearly hope the situation improves in the middle east.
We now have new bullish confirmation, strong bullish price action on the retest of the previous downward trend line after breaking out on Saturday 20th April.
MACD bullish cross from below zero line whilst daily price is above 200 EMA. Merger upcoming on the 24-26th will spurr Wallstreet into action and bullish momentum leading into this event will create an explosion in price.
This project and the synergies created by the merger make it one of the top contenders to see exponential growth during this bull run. My prediction is that once retail truly understand the scope and potential here, we will see a market cap comparable to Doge during 2020 - 2021. Exp (70-80 Bn dollars market cap.)
However, as we know retail knows very little about crypto and simply follows the crowd. The memecoin price action confirms this to be true so patience is key here whilst the mid-IQ participants catch-up to the informed investors.
I intend to pay attention to the ongoing AI narrative, the sentiment around the US economy and DXY, whilst also continuing to look for opportunities to add to the existing position as we can expect significant volatility going forward.
Next year poses significant challenges, likely to see a moderate recession globally and given the 18 year housing cycle is due to close next year, there may lack potential to continue the bull run beyond 2024.
This is all opinion and speculation, none of this is to be taken as financial advice and I do not encourage crypto speculation and investment.
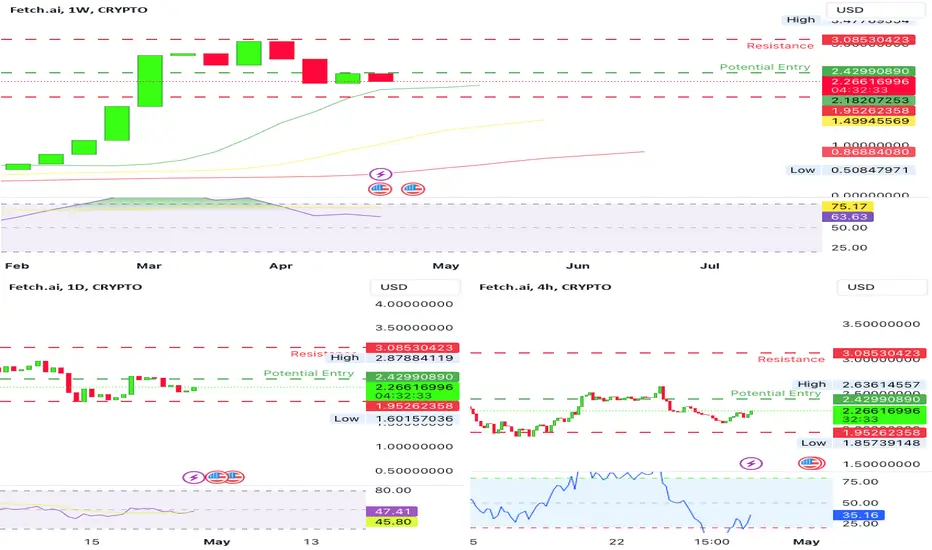
Fetch.ai Technical Analysis:Fetch.ai Technical Analysis:
1. What is Fetch.ai?
Fetch.ai is a decentralized artificial intelligence (AI) and machine learning (ML) network that aims to connect devices, data, and services in a decentralized, trustless manner. It leverages blockchain technology to enable autonomous economic agents (AEAs) to perform tasks, such as data sharing, machine learning model training, and decision-making, without the need for centralized control.
2. Facts about Fetch.ai:
- Decentralized AI Network: Fetch.ai operates as a decentralized AI network, allowing AI agents to communicate and transact with each other directly without intermediaries. This enables efficient resource utilization and facilitates complex interactions in various sectors, including finance, healthcare, and supply chain management.
- Autonomous Economic Agents: AEAs on Fetch.ai's network are autonomous entities capable of acting independently to achieve specific goals. These agents can negotiate and execute contracts, collaborate with other agents, and adapt to changing environments based on real-time data.
- Interoperability: Fetch.ai focuses on interoperability, enabling seamless integration with existing systems and platforms. This allows for the creation of diverse applications and services that can leverage the capabilities of Fetch.ai's decentralized AI network.
3. Technicals:
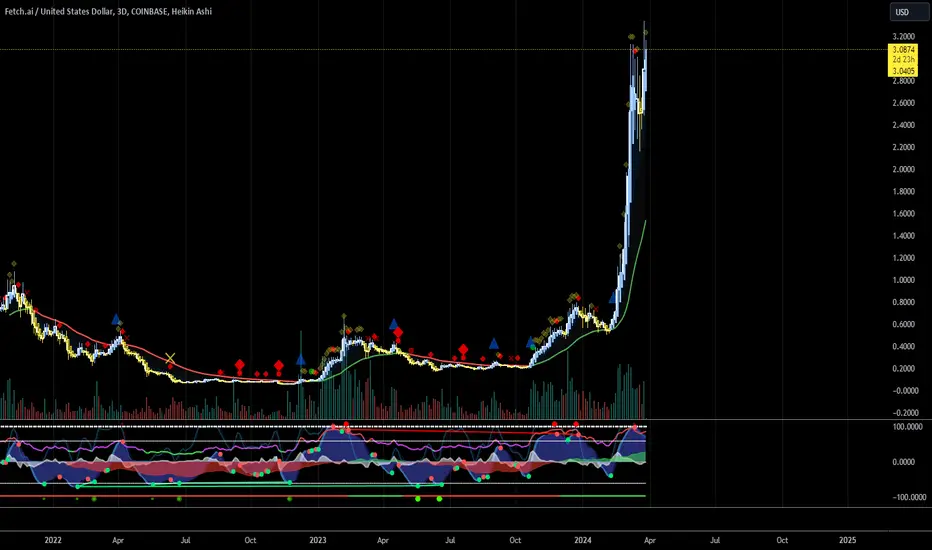
- Monthly RSI at 70, Weekly at 63: The Relative Strength Index (RSI) measures the magnitude and direction of recent price changes, indicating overbought or oversold conditions. A value above 50 suggests bullish momentum. With Fetch.ai's RSI at 70 on the monthly chart and 63 on the weekly chart, it indicates a strong bullish trend in both timeframes.
- Alligator Method: The Alligator is a technical analysis tool developed by trader Bill Williams. It consists of three smoothed moving averages, typically set at 34, 13, and 5 periods, representing the Jaw, Teeth, and Lips of the Alligator. When the lines are arranged in a specific order (Green over Yellow over Red) and the "mouth" (the space between the lines) is open upwards, it signals a strong uptrend in the market.
- Daily Near Support with Potential Entry: Support refers to a price level where buying interest is expected to be strong enough to prevent further price decline. If Fetch.ai is near a support level on the daily chart, it suggests a potential entry point for traders looking to enter a position.
Fetch.ai is a decentralized AI network that connects devices and services using blockchain technology. Looking at the current trends, Fetch.ai shows a strong bullish sentiment based on its RSI readings. The Alligator method confirms this bullish trend, and on the daily chart, the network appears to be near a support level, presenting a potential entry opportunity for traders.
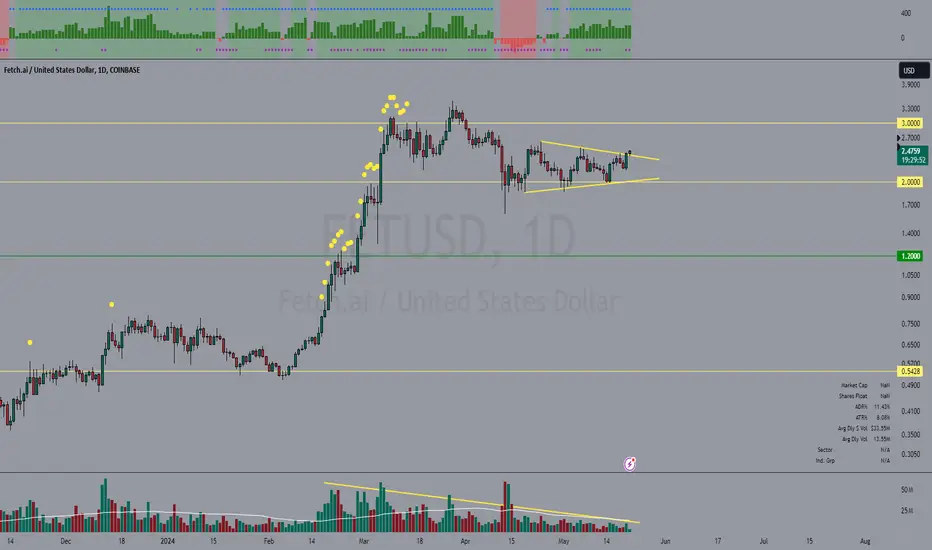
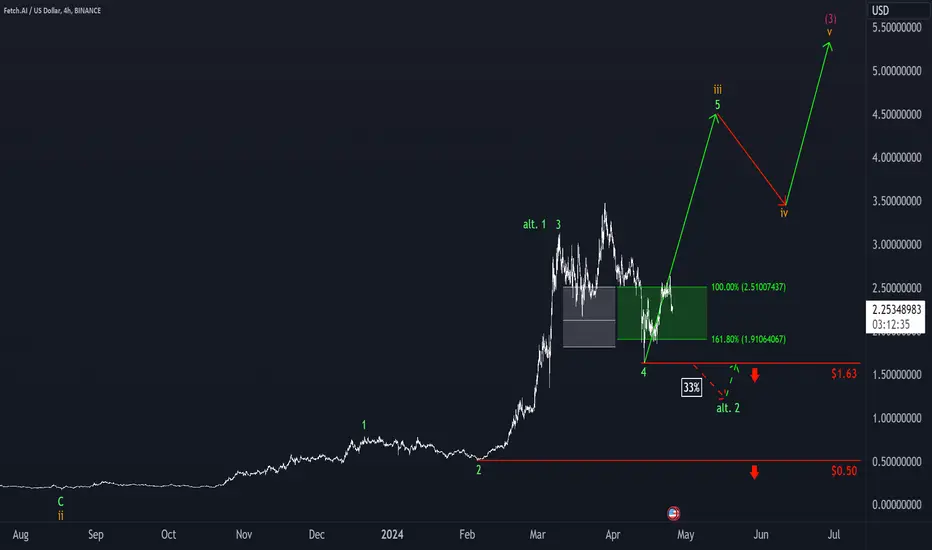
FET: Bounced Off 🪃FET attempted to break out of our green Target Zone ($1.91 – $2.51), but bounced back from the upper edge of the range. Primarily, however, we continue to assume that the last sub-wave of the orange-colored wave iii should lead to a significant rise out of the Zone. Only a drop below the support level at $1.63 will alter our outlook. A break of this mark will trigger our alternative scenario (33%), which implies further setbacks with the green wave alt.2.
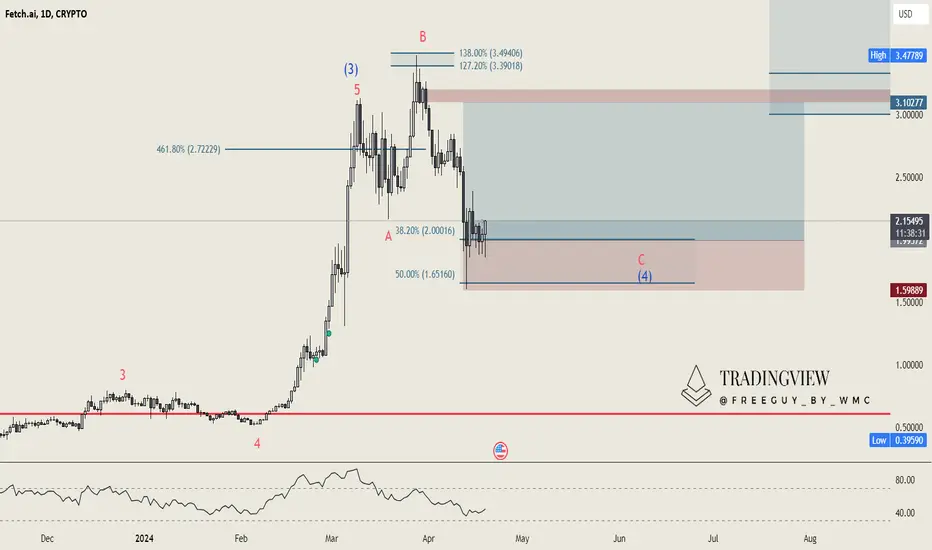
Fetch.AI (FET): Survived a near Stop-Out. Next Stop $3.10?At Fetch, it was extremely close, but our stop-loss was not triggered. So yes, you could say we were lucky; the 50% held up. We believe we have now stabilized and are expecting this rise to $3.10. That's the target for us. As mentioned, we don't expect to fall again and retest this low. However, it wouldn't be impossible to see a smaller dip before we continue to rise.
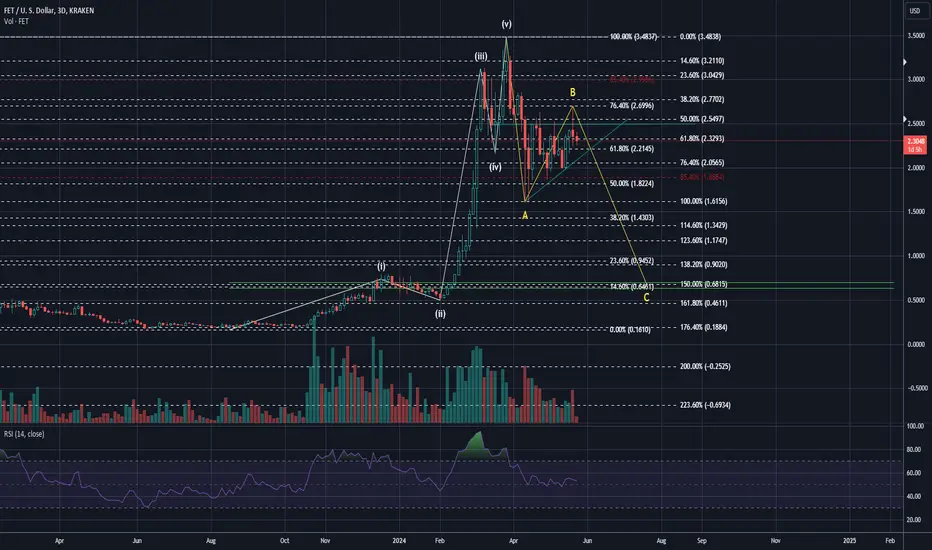
FET 4-5 SetupFetch ai's wave-3 has completed its upward trajectory and is now transitioning into a downward wave-4. You can begin scaling in within the green triangle; the top of the triangle represents the smallest order, while the bottom indicates the largest order. Once wave 4 concludes, I will provide an updated price target for the upcoming wave-5 ascent.
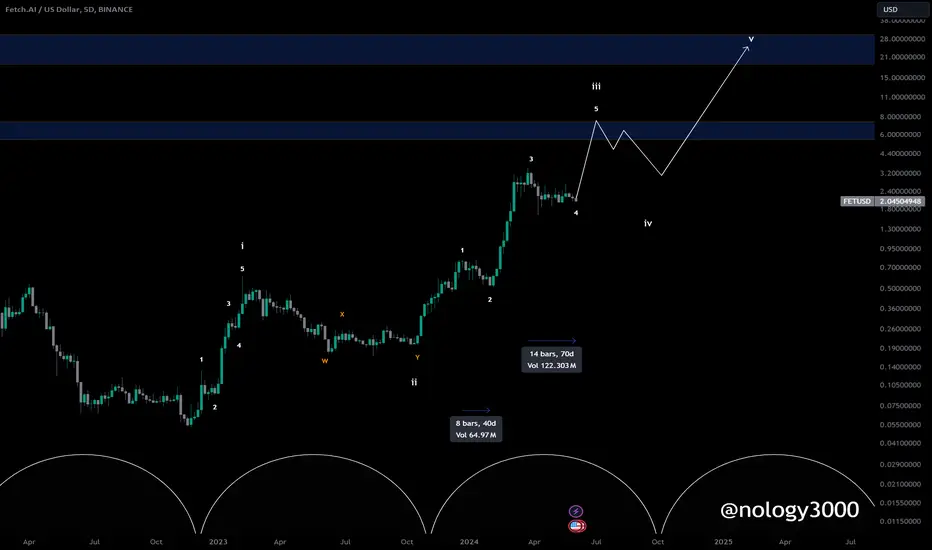
Fetch.ai: Price Surge Fueled by AI HypeFetch.ai, boosted by the AI hype, is charting a 5-wave cycle on the daily chart. We're likely at the conclusion of Wave (3), approaching Wave (4), which is expected to hit the 38% to 61.8% retracement levels. However, it should not reach 61.8% as this would fall below the level of Wave (1). We anticipate the price stabilizing between a 38.2 and 50% retracement. For Wave (5), we expect to surpass the local high of Wave (3) significantly, although the exact target remains to be determined. We will provide updates, but a 100% increase is anticipated.

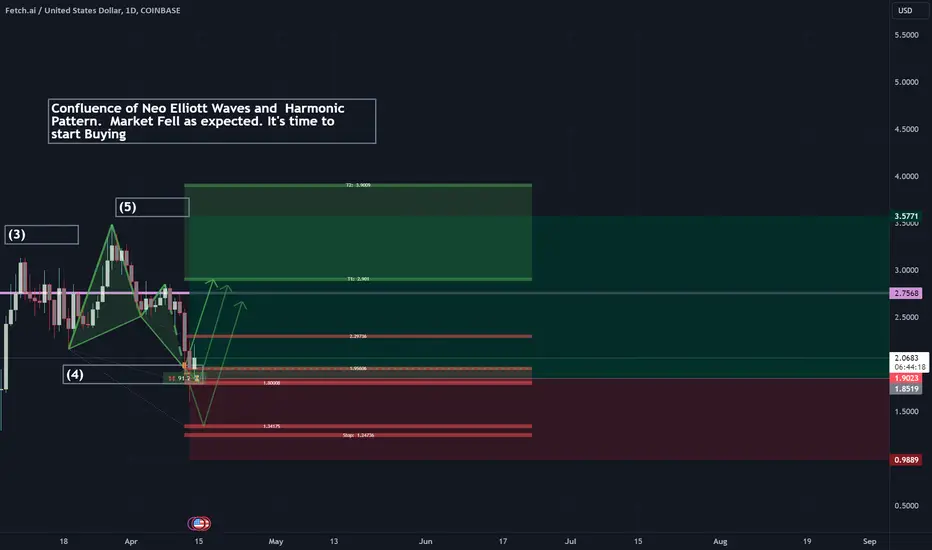
Market Fell as expected. It's time for Impulsive moves UPThere's Confuence of Harmonics and Neo Elliott Waves. Whales did as expected. This was an expected corrective move to the downside. Banks/Funds Whales will make use of the volatility and wipe out more traders. Medium and Long Term trend are UP. Use Trade Management principles.
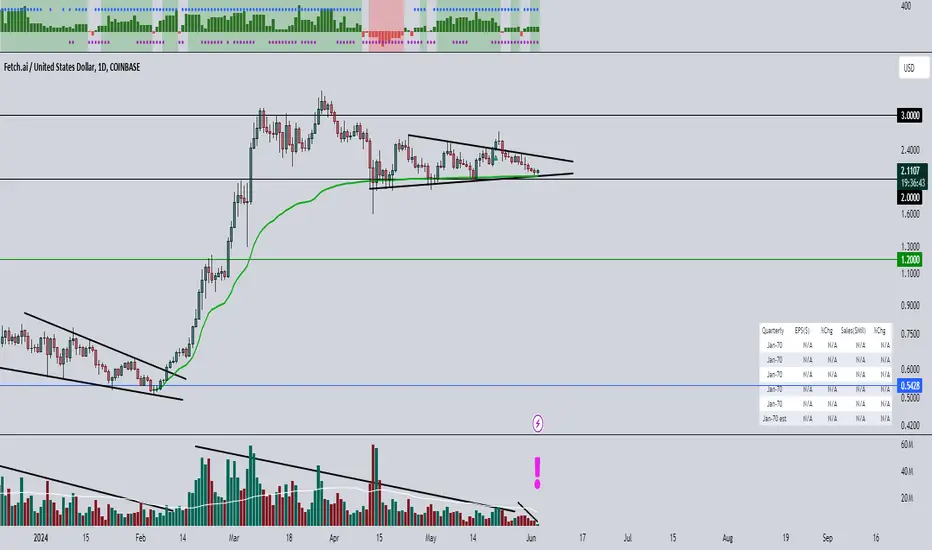
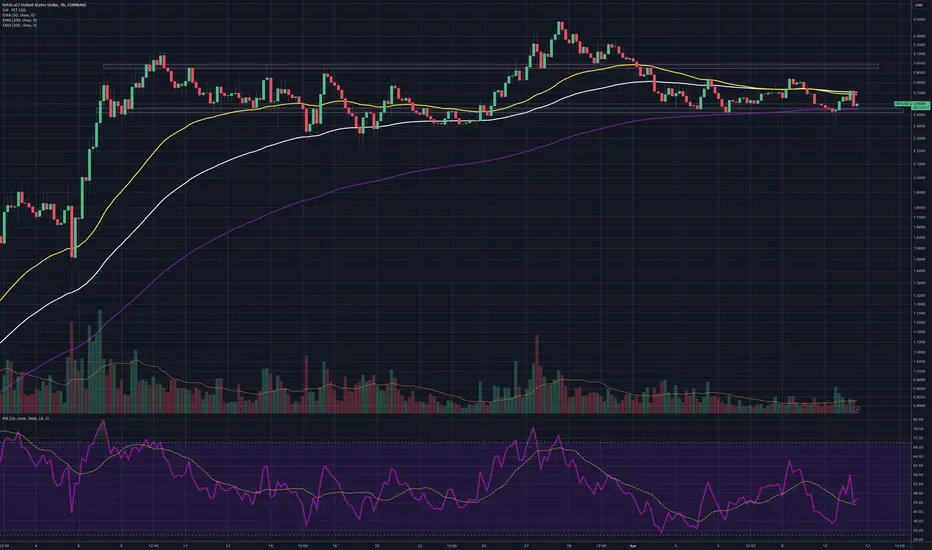
FET stuck inside rangeFET has mostly held inside this range for several weeks. It looked like it had a big breakout but then it came right back down into the range again.
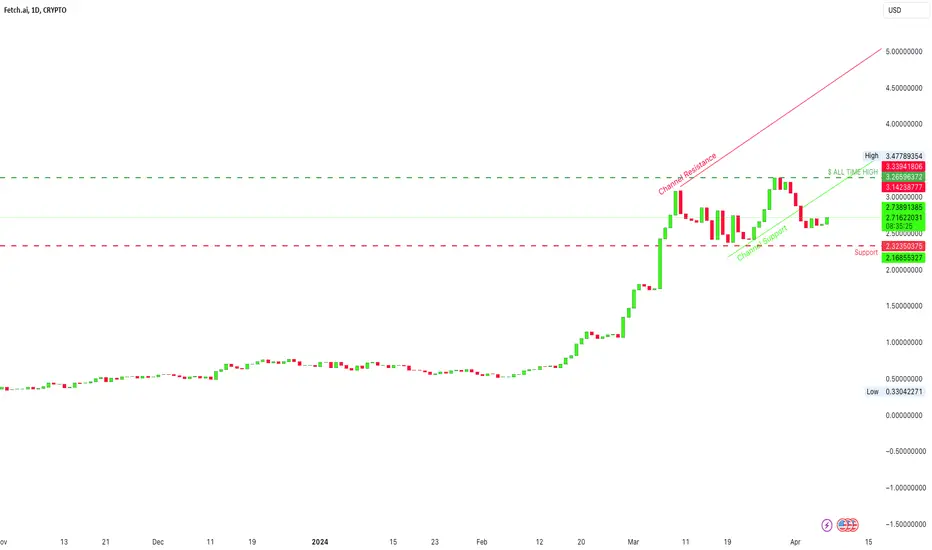
Autonomous Agents: Fetch.ai's Machine Learning PlatformFET is also in a bullish trend with an RSI around 73. It's fallen out of its usual price range but has the potential to surpass its previous all-time high of 3.26596372. Support level is around 2.32350375 and a resistance /ATH at 3.26596372.
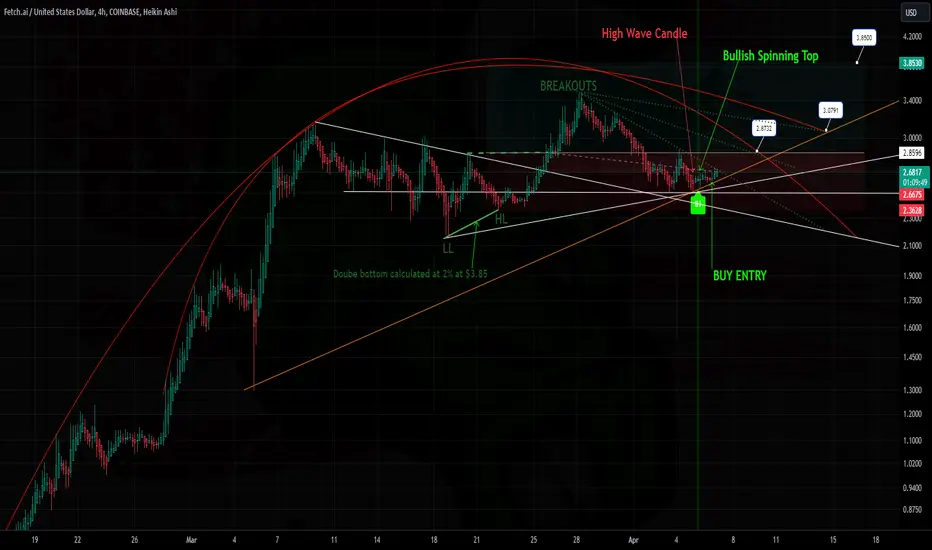
FETCH Price Action Pattern: Target $3.85 HIGH WAVE, INVERTED HAMMER, and SPINNING TOP
Trend line guidance. Double Bottom has confirmed a long position 2% risk-reward ratio leading to a price target of $3.85.
Three breakout green dotted wedge trend lines.
Two curves confirming an estimated price prediction
Follow the trend lines for candlestick guidance.
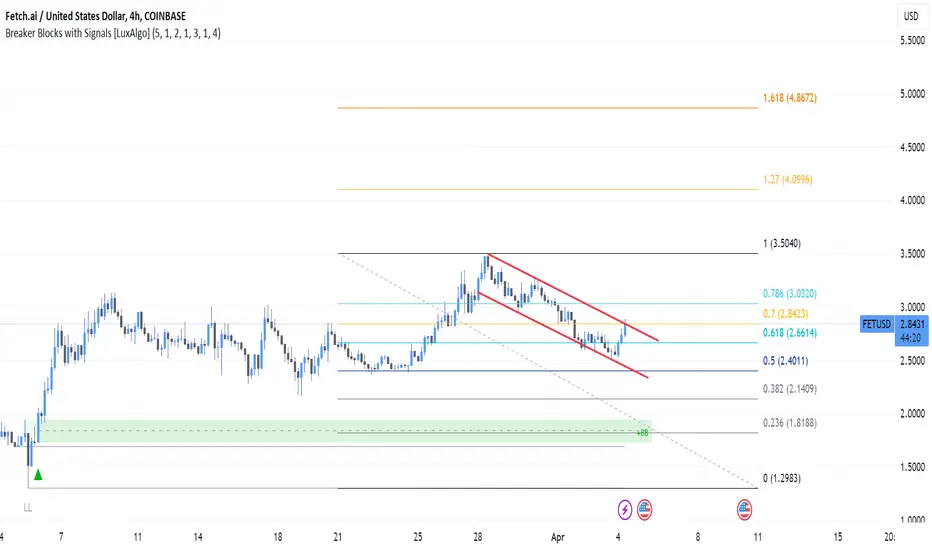
$FET FETCH.AINYSE:FET in a bull flag pattern. Breakout looks imminent on the 4HR. 2 Targets to look out for:
$4(1.27 level) and $4.8(1.618 level)
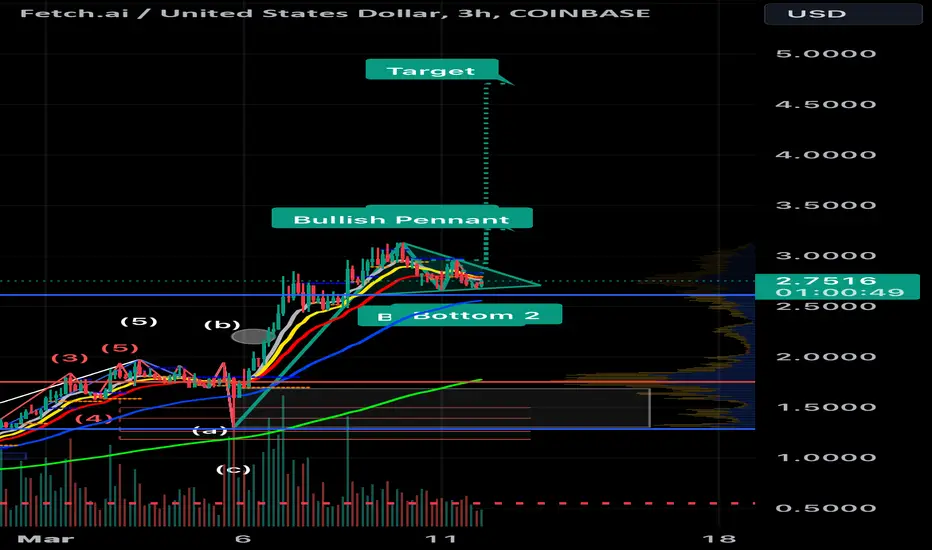
Fetch.ai (FET) Chart Analysis: Observing a Bullish Pennant BreakThe FET/USD 3-hour chart displays a pattern resembling a bullish pennant breakout. If this breakout is confirmed, technical analysis suggests a potential price target of $4.71.
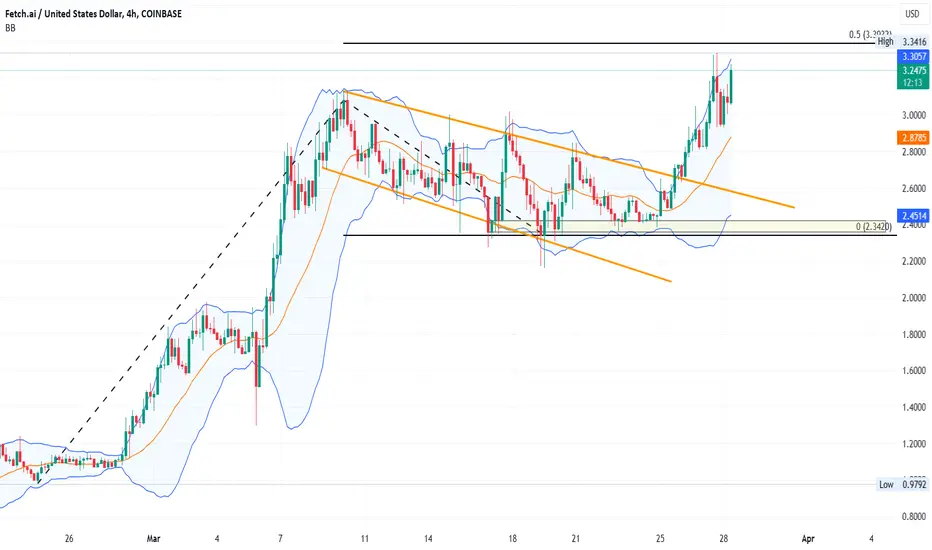
Is $5 The Next Stop for FET?Recent Price Surge: FET sees almost a 20% increase this week, indicating strong market momentum.
Market Cap and Trading Volume: With a $2.602 billion market cap and a 67% rise in trading volume, FET's demand is on the rise.
All-Time High: FET reached a new all-time high at $3.34 but has seen a slight pullback to $3.0993.
Doji Candle Formation: Indicates a pause after a bullish run, with FET showing potential for further action.
Resistance Breakout: FET price action includes a breakout above the overhead resistance trendline.
Fibonacci Levels: Challenging the 50% Fibonacci level at $3.39, with eyes on a move to $4.44.
Rounding Bottom Reversal: Supports a bullish trend continuation in the daily chart.
Bollinger Band Surge: FET challenges the upper Bollinger band, signaling bullish momentum.
MACD Indicator: Shows a potential negative crossover, hinting at supply pressure around $3.39.
AI Sector Buzz: The merger buzz around SingularityNET, Fetch.ai, and Ocean Protocol fuels FET's rally.
Bitcoin Halving Anticipation: Contributes to the overall altcoin market's bullish sentiment, including FET.