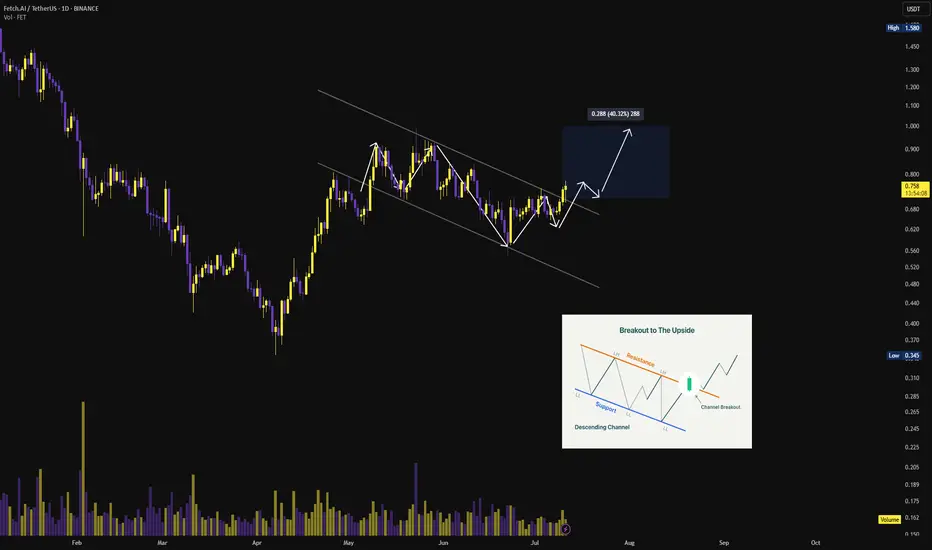
$FET Broke out from the bull flag!!🚨 NYSE:FET is broke out from a falling channel — and it’s about to go FULL SEND! ⚠️📈
It’s pressing above the breakout zone💣
Break above $0.72, and we’re ripping to $0.84 → $1.00 like it’s programmed. 🔥
🤖AI season heating up. Chart structure loaded.
💥The breakout candle has come. Be early — or
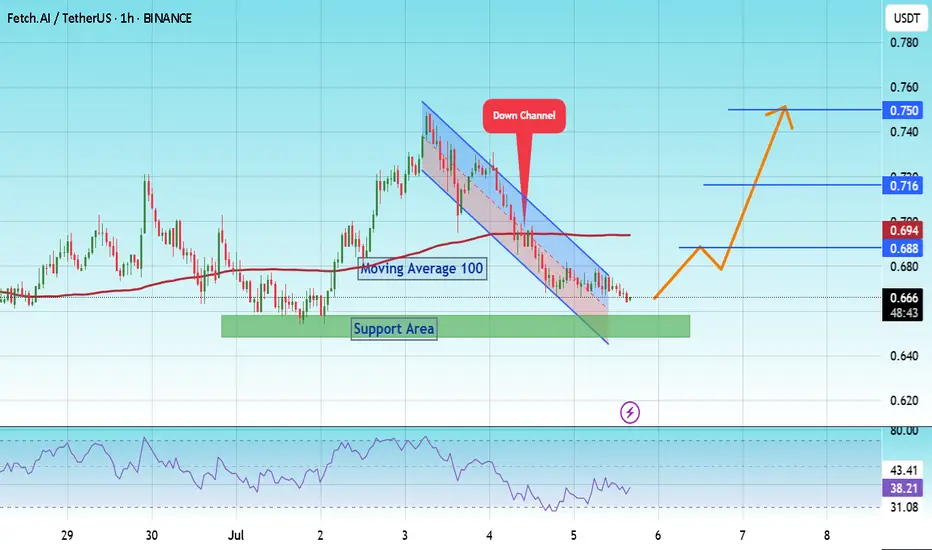
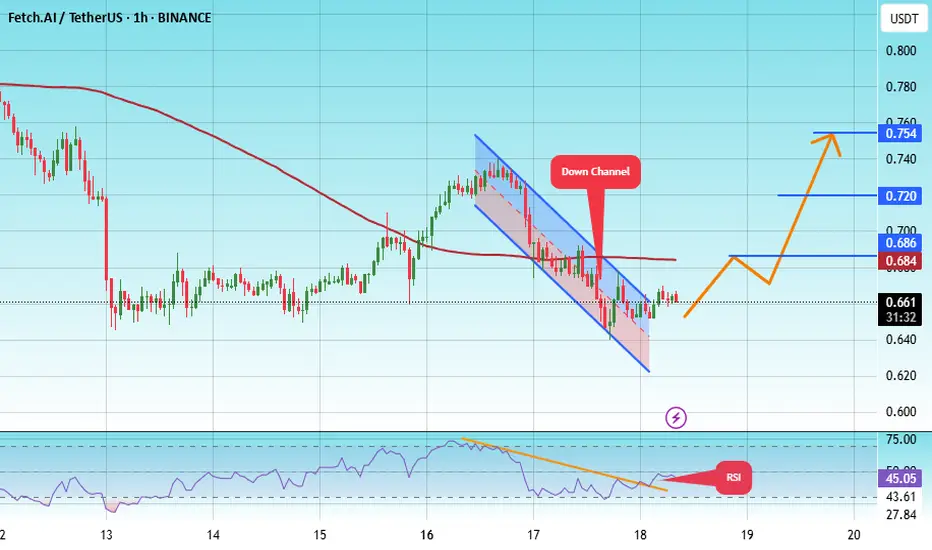
#FET/USDT Preparing for a Major Rally ?#FET
The price is moving within a descending channel on the 1-hour frame and is expected to break and continue upward.
We have a trend to stabilize above the 100 moving average once again.
We have a downtrend on the RSI indicator that supports the upward break.
We have a support area at the lowe
Buy Trade Strategy for FET: Backing the Future of AI & BlockchaiDescription:
This trading idea highlights FET (Fetch.ai), a cryptocurrency powering a decentralized network that merges artificial intelligence and blockchain to create autonomous economic agents. These agents are designed to optimize services such as transportation, supply chain, and smart city in

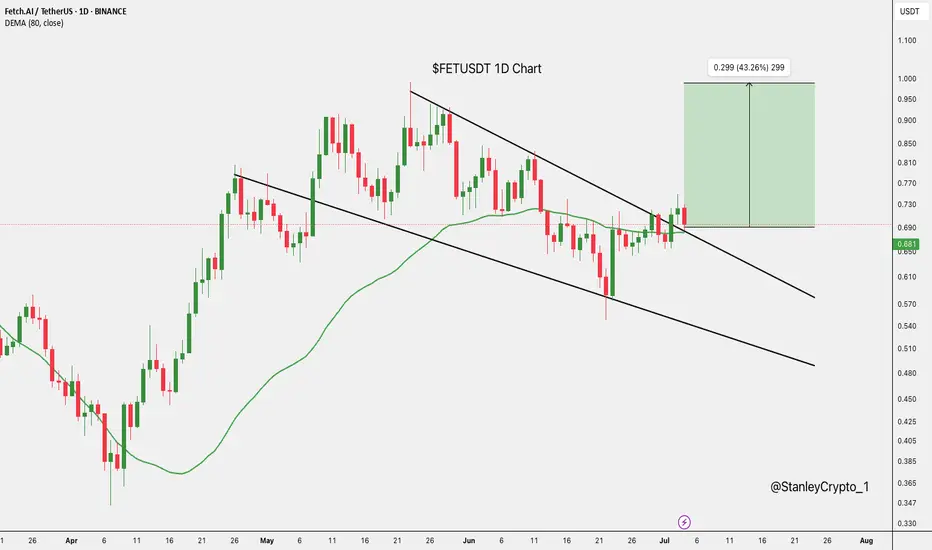
$FETUSDT Support level. NYSE:FET just broke out of a falling wedge, which is a bullish sign.
It’s now holding above the 80-day EMA, a solid support level.
If this breakout holds, we could see a strong move toward $0.988, which is about a 43% increase from current levels.
Keep an eye on it.
DYRO, NFA
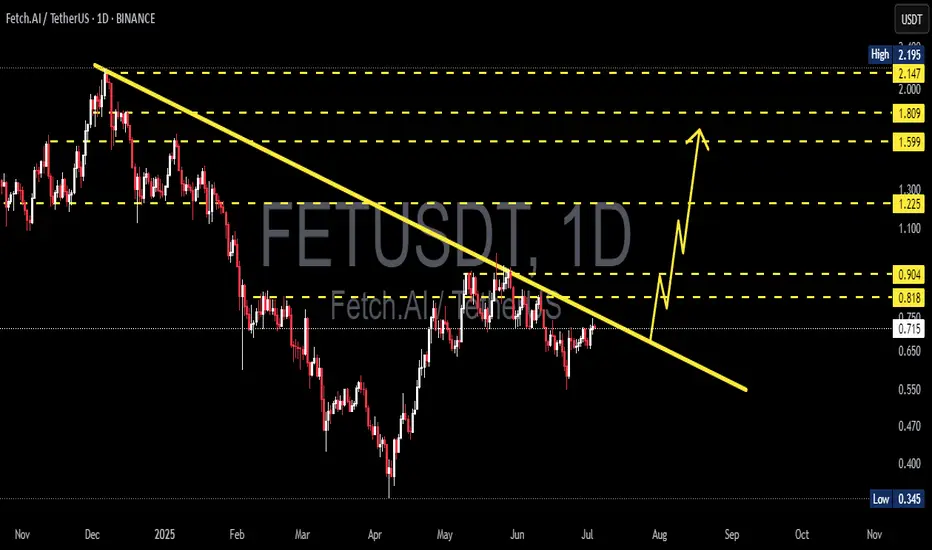
FET/USDT Breakout Imminent? Preparing for a Major Rally!
🧠 Key Pattern: Descending Trendline Breakout
On the daily chart (1D), FET/USDT (Fetch.AI) has been consolidating under a strong descending trendline since its late 2024 highs. Currently, price action is coiling tightly just below this resistance, signaling a potential explosive breakout.
The pric
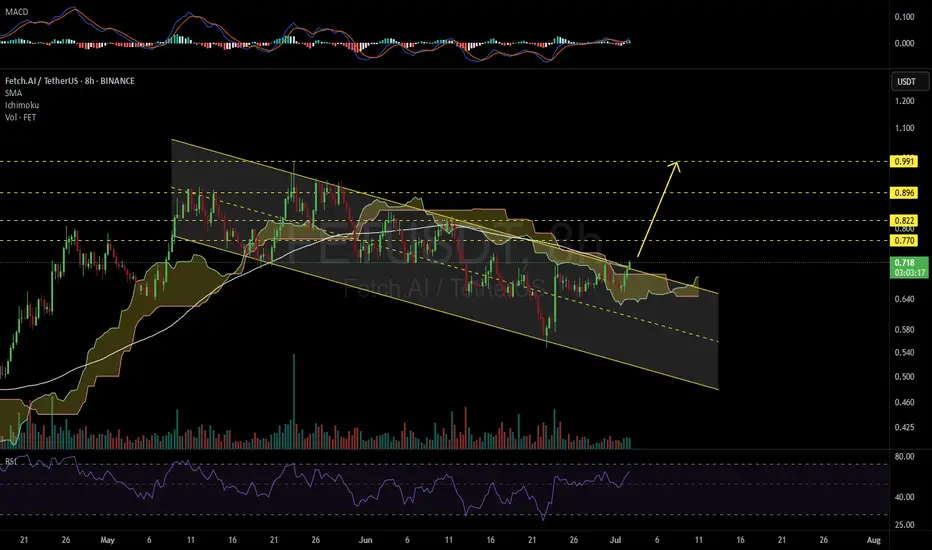
FETUSDT 8H#FET 8H chart is looking promising.
It has broken out of the Ichimoku cloud, and is currently trading above both the descending channel resistance and the SMA100.
If the current candle closes above the channel, we can expect the following targets:
🎯 $0.770
🎯 $0.822
🎯 $0.896
🎯 $0.991
⚠️ As always,
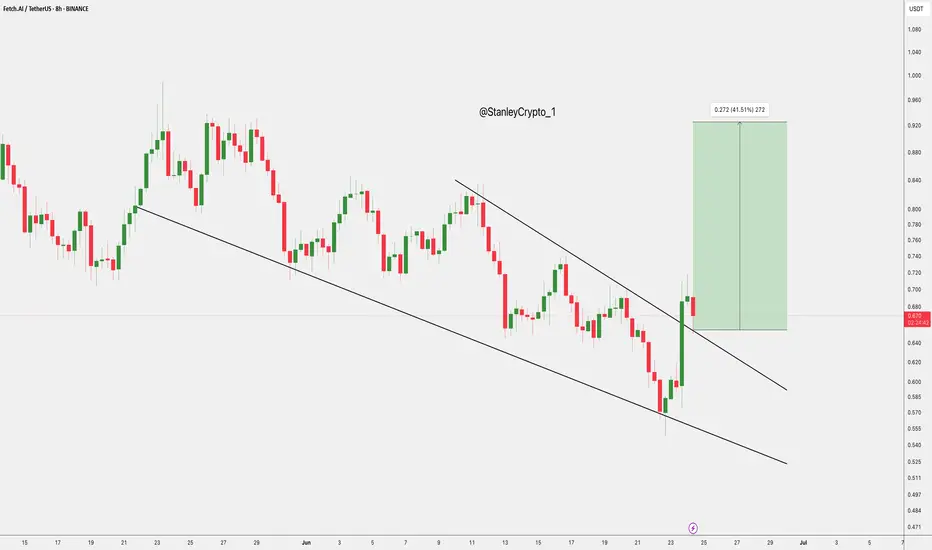
$FET Breakout Targeting 41% GainNYSE:FET has broken out of its descending channel on the 8H chart with strong momentum.
If it holds above the breakout zone $0.66–$0.68, we could see a move toward $0.92, a potential 41% upside.
Watch for a successful retest to confirm the breakout.
DYRO, NFA
#FET/USDT#FET
The price is moving within a descending channel on the 1-hour frame, adhering well to it, and is heading towards a strong breakout and retest.
We are seeing a rebound from the lower boundary of the descending channel. This support is at 0.634.
We have a downtrend on the RSI indicator that is
FET to 1$ this week?NYSE:FET Has broken out of the bull flag!✔️
This has so far come +40% and now looks certain to test the benchmark level next!
Potential Target should be 1$ atleast! This has a potential of going 50x from 1$ as well but we discuss that later when the time comes✍🏻

See all ideas
Summarizing what the indicators are suggesting.
Oscillators
Neutral
SellBuy
Strong sellStrong buy
Strong sellSellNeutralBuyStrong buy
Oscillators
Neutral
SellBuy
Strong sellStrong buy
Strong sellSellNeutralBuyStrong buy
Summary
Neutral
SellBuy
Strong sellStrong buy
Strong sellSellNeutralBuyStrong buy
Summary
Neutral
SellBuy
Strong sellStrong buy
Strong sellSellNeutralBuyStrong buy
Summary
Neutral
SellBuy
Strong sellStrong buy
Strong sellSellNeutralBuyStrong buy
Moving Averages
Neutral
SellBuy
Strong sellStrong buy
Strong sellSellNeutralBuyStrong buy
Moving Averages
Neutral
SellBuy
Strong sellStrong buy
Strong sellSellNeutralBuyStrong buy
Displays a symbol's price movements over previous years to identify recurring trends.