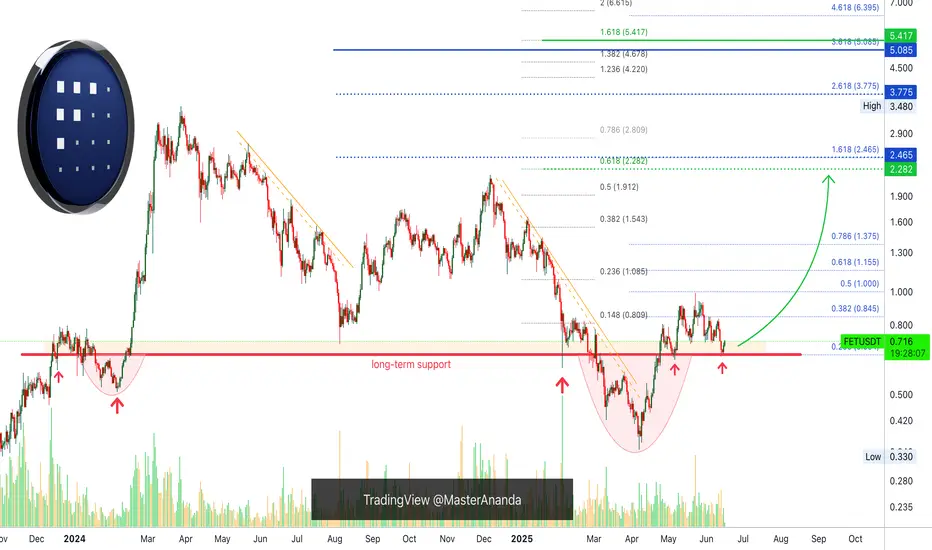
FetchAI New All-Time High —656% Profits Potential MappedSupport here is well defined, it is a long-term situation. Resistance in late 2023 and early 2024; resistance in late April 2025; support in early May and mid-June. This is the red line on the chart.
In early 2024 there was a small rounded bottom pattern below this long-term support line. After res
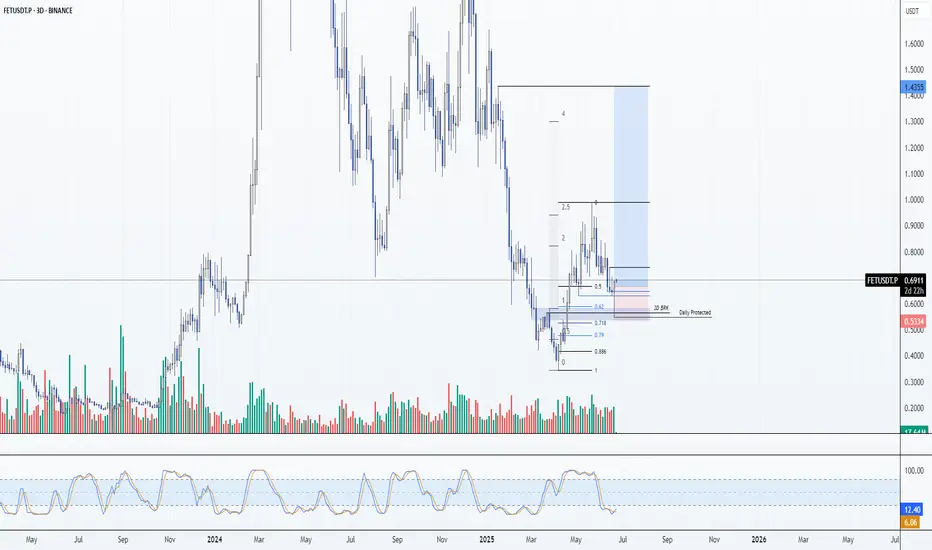
FET: Spot Long 24/06/25Trade Direction:
FET: Spot Long
Position Strategy:
-Risk approx 1% spot
- Layered bids down to 0.636 with first filled here at market 0.692
- Avg entry if all are filled will be 0.668
Reason for Entry:
- Strong multi-timeframe support confluence:
- 3D breaker block
- 3D fair value gap
- Weekly fai
FET BINANCE:FETUSDT.P
A comprehensive update for FET$ (Artificial Superintelligence Alliance) until June 2025:
Recent developments and funding:
$55M Funding: TRNR (parent company of Fetch.ai (Fetch.ai) ) closed a funding round with participation from institutions such as ATW Partners and DWF Labs, w
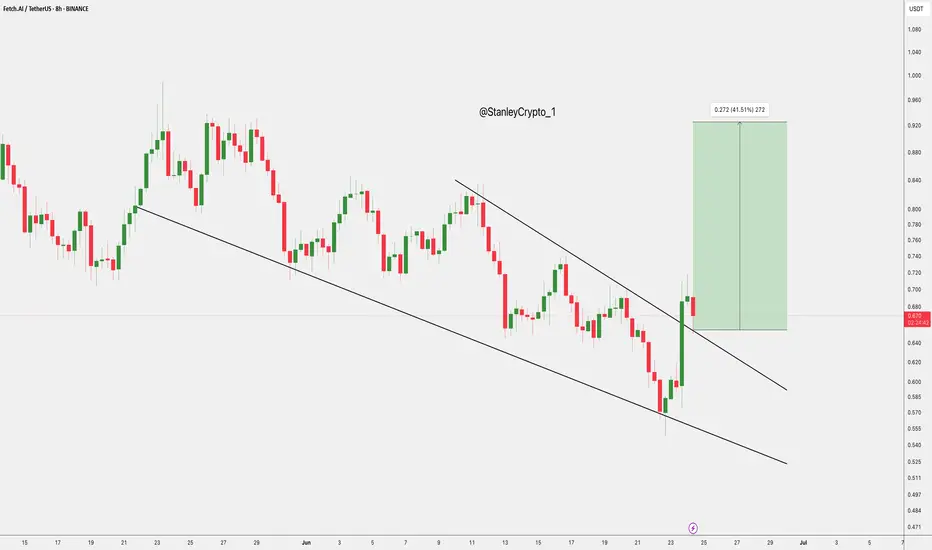
$FET Breakout Targeting 41% GainNYSE:FET has broken out of its descending channel on the 8H chart with strong momentum.
If it holds above the breakout zone $0.66–$0.68, we could see a move toward $0.92, a potential 41% upside.
Watch for a successful retest to confirm the breakout.
DYRO, NFA
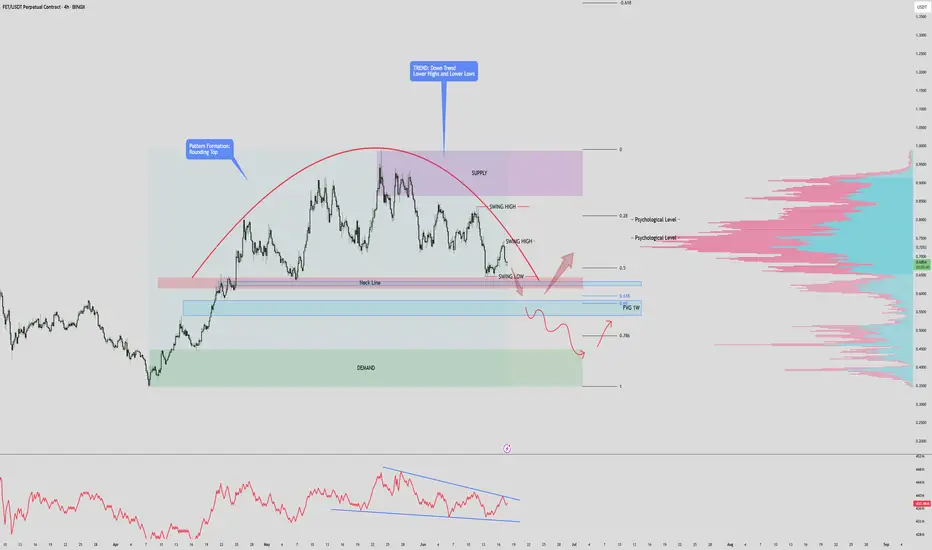
$FET 4Hr Time frame DUMP before PUMP? $1 Recovery!FET/USDT – 4H Time Frame Analysis
Pattern Formation: A rounding top is clearly visible, suggesting weakening bullish momentum and potential trend reversal.
Trend Structure: Price is forming lower highs and lower lows, confirming a bearish trend.
Key Zones:
Supply Zone: $0.85 – $0.975
Demand
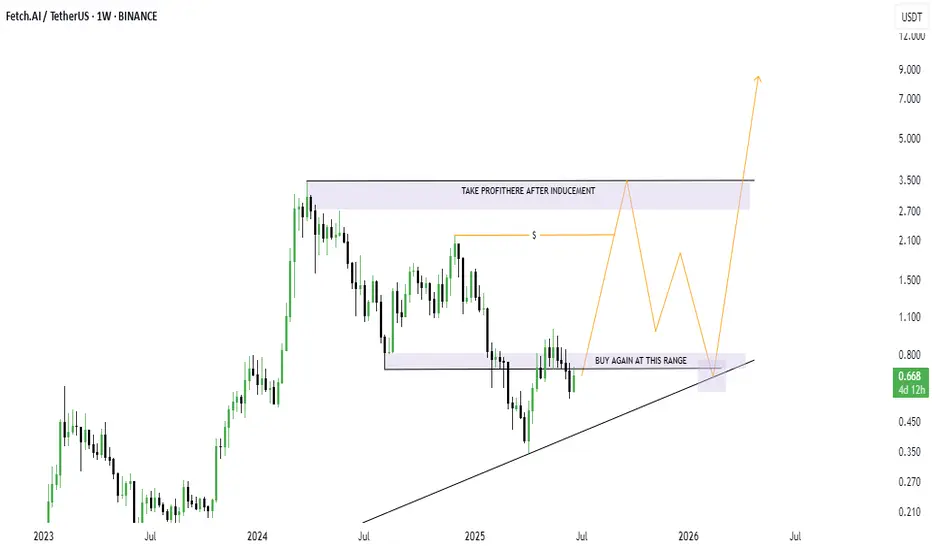
$FET BULLISH TO $6+ MAY HAVE STARTEDNYSE:FET BULLISH TO $6+ MAY HAVE STARTED:I am looking for a candle shift above the blue line to confirm this uptrend.
Take profit once price is above the inducement level and wait for reversal down to our SECOND BUY RANG. This might take FET up $6 and above.
GOODLUCK #FET
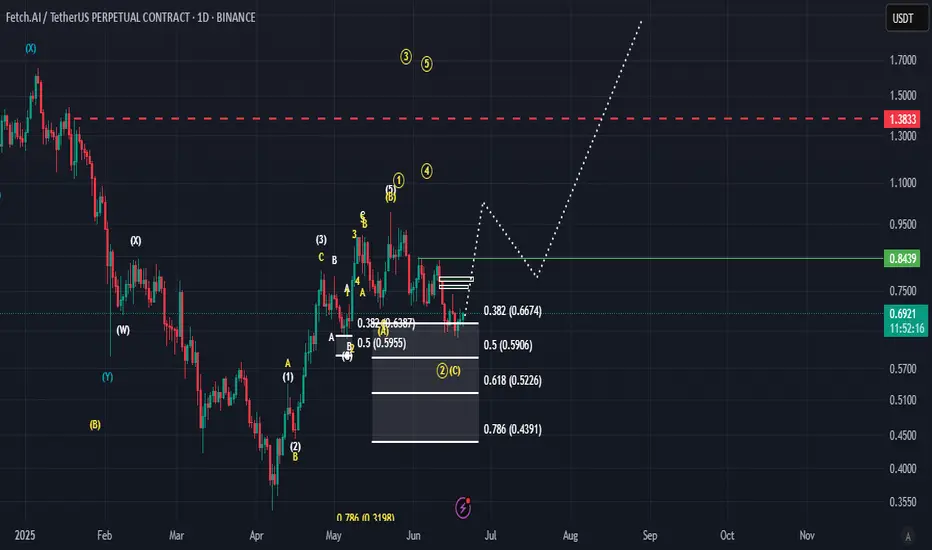
FET: Long 18/06/25Trade Direction:
FET Long
Risk Management:
- 0.5% risk
Reason for Entry:
- Total Market Cap holding key H4 support
- Oversold on multiple time frames
- Recent bullish news of potential ceasefire talks (Iran/Israel)
- HTF Double Bottom
- Daily Orderblock
Additional Notes:
- Will look to hedge shor

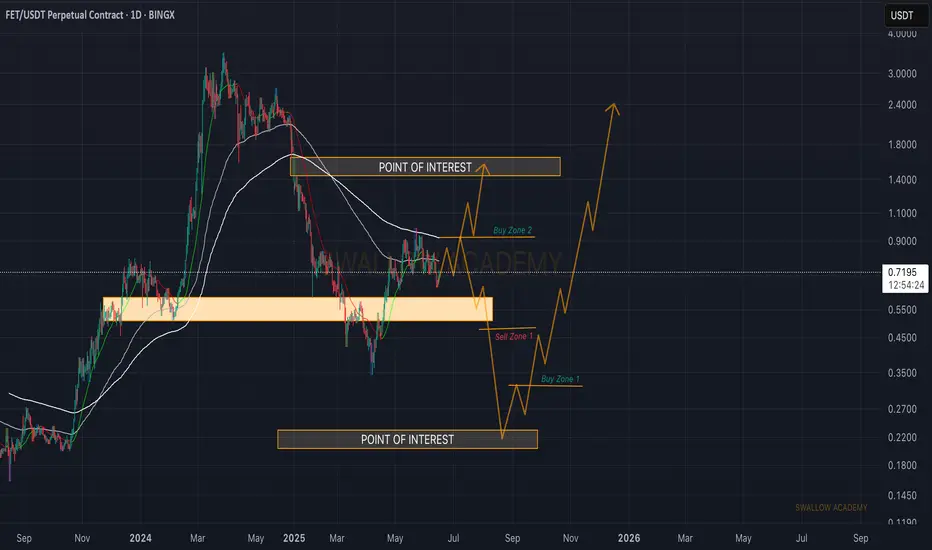
Artificial Superintelligence (FET): Looking For Buy Entry 2We are shifting our focus currently to the 200EMA, where we are expecting the price to reach that area this week; after that, we will be looking for a proper breakout from that region.
In total we still got those 3 entry points we've been aiming for since last time so we wait patiently, not rushin
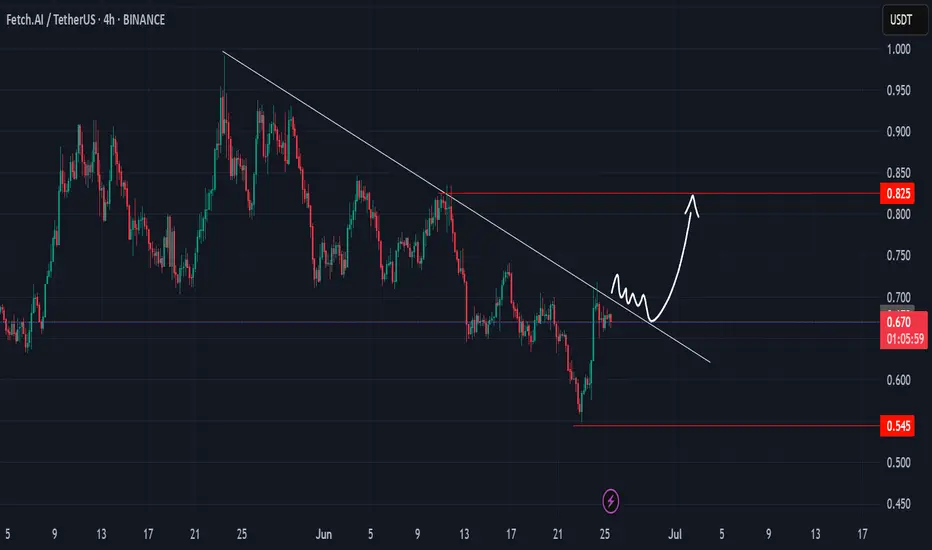
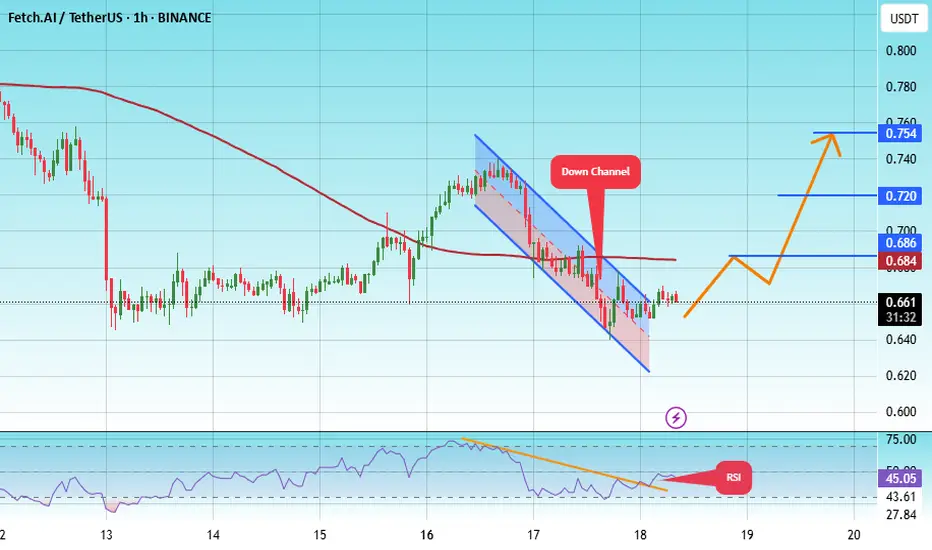
#FET/USDT#FET
The price is moving within a descending channel on the 1-hour frame, adhering well to it, and is heading towards a strong breakout and retest.
We are seeing a rebound from the lower boundary of the descending channel. This support is at 0.634.
We have a downtrend on the RSI indicator that is
See all ideas
Summarizing what the indicators are suggesting.
Oscillators
Neutral
SellBuy
Strong sellStrong buy
Strong sellSellNeutralBuyStrong buy
Oscillators
Neutral
SellBuy
Strong sellStrong buy
Strong sellSellNeutralBuyStrong buy
Summary
Neutral
SellBuy
Strong sellStrong buy
Strong sellSellNeutralBuyStrong buy
Summary
Neutral
SellBuy
Strong sellStrong buy
Strong sellSellNeutralBuyStrong buy
Summary
Neutral
SellBuy
Strong sellStrong buy
Strong sellSellNeutralBuyStrong buy
Moving Averages
Neutral
SellBuy
Strong sellStrong buy
Strong sellSellNeutralBuyStrong buy
Moving Averages
Neutral
SellBuy
Strong sellStrong buy
Strong sellSellNeutralBuyStrong buy
Displays a symbol's price movements over previous years to identify recurring trends.