#FET/USDT#FET
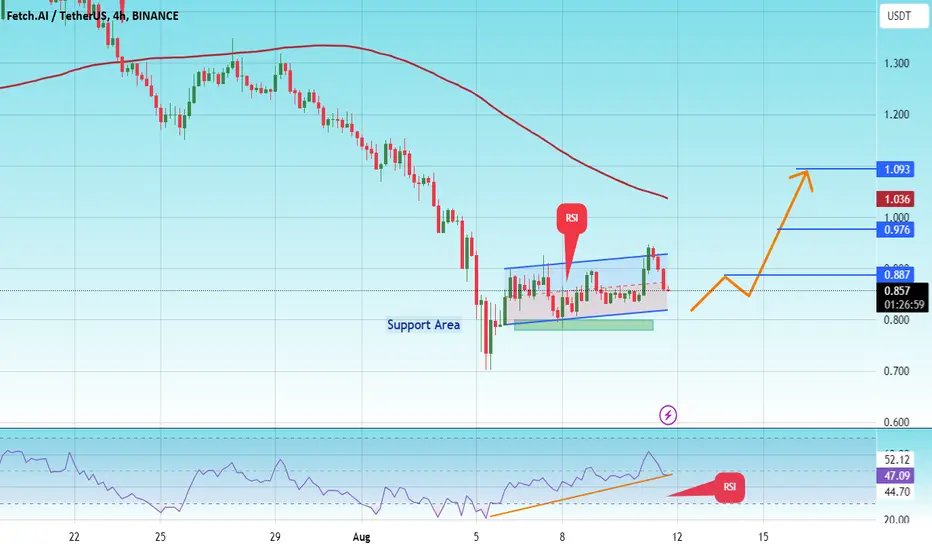
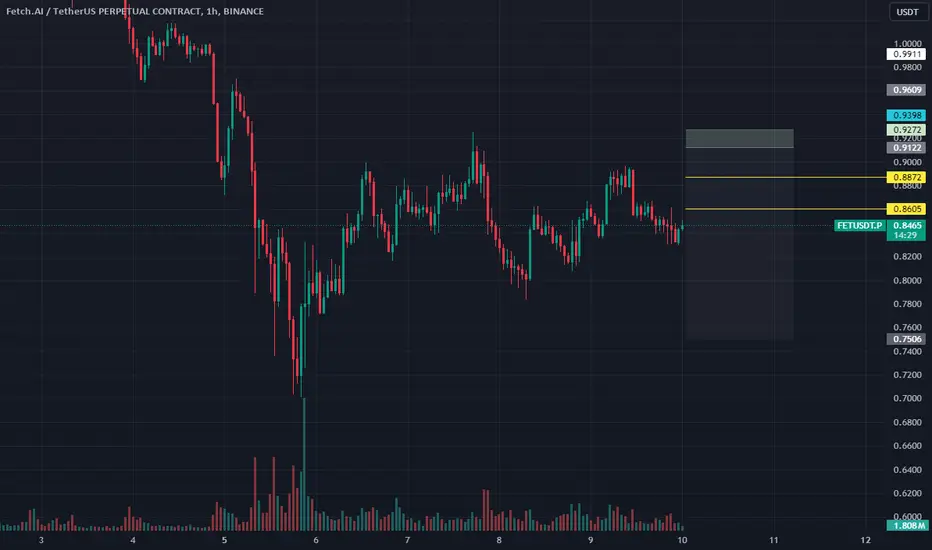
The price is moving in a descending channel on the 4-hour frame and is about to break upwards
We have a trend to stabilize above the moving average 100
We have an upward trend on the RSI indicator that supports the rise by breaking it upwards
We have a major support area in green at a price of 0.800 from which the price rebounded and respected it greatly
Entry price 0.820
First target 0.887
Second target 0.976
Third target 1.09
FETUSDT.P trade ideas
Fetch.ai (FET)A new AI innovation, ChatGPT, is taking the internet by storm. The new software has woken up writers and internet users to what is possible with well designed AI software. like any new technological breakthrough, market participants will benefit, even if from the speculatory crowd looking to place bets through investments. Fetch.Ai, the an open-source network giving access to a machine-learning ecosystem powered by the Fet token and is rapidly expanding its reach by enabling access within the Cosmos ecosystem.
Fetch.ai price today is $0.17 with a 24hour trading volume of 110 million dollar. FET price is up 10% in the last 24 hours and 80% up since last month
It founded in 2017 and launched via IEO on Binance in March 2019, Fetch.AI is an artificial intelligence lab building an open, permissionless, decentralized machine learning network with a crypto economy. The Fetch.AI mainnet went live in Jan 2020. Fetch.ai democratizes access to AI technology with a permissionless network upon which anyone can connect and access secure datasets by using autonomous AI to execute tasks that leverage its global data network. The Fetch.AI model is rooted in use cases like optimizing DeFi trading services, transportation networks (parking, micro-mobility), smart energy grids, travel.. essentially any complex digital system that relies on large scale datasets.
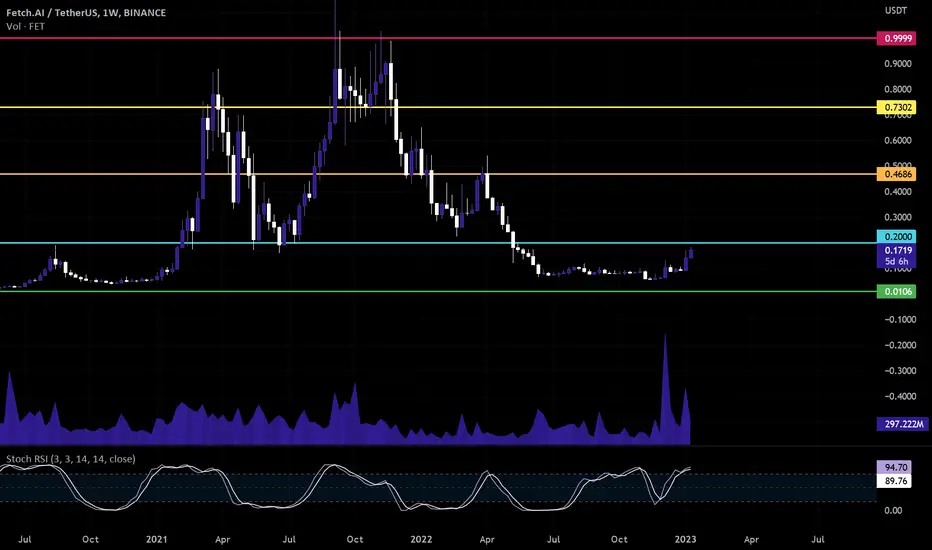
If Fet breaks 0.2 resistance then 0.23, 0.25 and 0.29$ are next targets but if history repeat itself then August 2020 scenario can be possible too (0.07-0.1 is a dip for fet)
FET BLUEPRINT - ALL SETUP
BINANCE:FETUSDT is still bullish on the higher timeframe but buying now is not advisable because of the risk reward. What you should wait for is the retracement to point 2 area after present price reaches point 1.
But if price fails to reach point 1 and starts to deep from current price then it is best to buy lower after price has taken the PSL (previous swing low) down to the WEEKLY ORDER BLOCK (W. OB) while the STOP LOSS is slightly below it. From there we will have a nice RISK REWARD RATIO.
While I expect price to bounce from the Weekly Order Block, there is no exception that the Stop Loss can't be taken because we have a huge WEEKLY FAIR VALUE GAP and depending on the volume of the bears price can surge down into that W. FVG and there is certainty that price will bounce HARD from there with a long wick after taking all the liquidity that rest beneath it.
So to summarize, there are three entry level where two of them are (W. OB & W. FVG) for BUY/LONG and two Stop Losses respectively while the third one is at POINT 2 with it Stop Loss at the PSL.
The POINT 2 entry level is mainly for those who are already in any FET position seeking to know where to trail profit while the other two entries is for those who are for those interesting in a good positioning for a nice RISK REWARD.
I will be updating this chart as every level unfolds so make sure to follow and turn on notification to stay updated.
OTHER ANALYSIS
BINANCE:ENSUSDT
BINANCE:CYBERUSDT
BINANCE:BTCUSDT
BINANCE:FTMUSDT
MEXC:AZEROUSDT

FET limit longSo we clearly broke out; we have momentum here and that means I want to take more alt long trades on lower time frame retraces, I will share a couple of setups below.
Yeah, there is that small chance that we fall down below (again close a daily below 60k etc) but if that happens, tough shit. that's markets and trading anyway, you gotta take a chance when you see momentum and if you hit 1-2 stop losses so be it. if you don't take a chance when you see spot volumes like this, you will never make money trading perps.
The idea is enter strong alts retesting some ltf emas or liquidity zones and take a chance for a next wave up from there. We will try to keep stop loss tighter and also only manual closes upon candles because we don't want the criminal wicks to eat our portfolio

Maximizing Gains: A Strategic Guide to Buying FETUSDT on SpotIn this article, we dive into the strategy of buying FETUSDT on the spot market, offering insights into timing, risk management, and market trends. Learn how to capitalize on the unique opportunities presented by FET, a rising star in the crypto space, and USDT, a stablecoin trusted by investors worldwide. Whether you're a seasoned trader or a crypto newbie, this guide will equip you with the knowledge to optimize your investment and navigate the dynamic world of cryptocurrency trading.

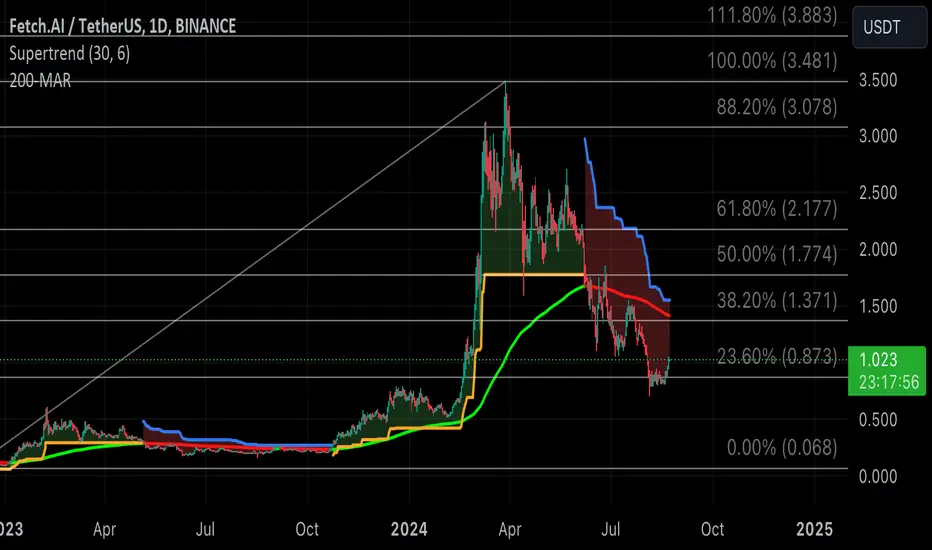
FET - Keep an eye on this!Coming off solid support from January 2024. I'm waiting patiently for 200 day MA bearish red line to flip back to bullish green & the current bearish SuperTrend blue line flips back to bullish gold line. Blast Off Soon
FET longAfter weeks of bleeding, finally utility tokens show some sign of life.
NYSE:FET has great fundamentals, it is a leader of the AI token narrative, and started a reaction from a price level that marked a previous weekly resistance.
Let's hope it becomes a support.
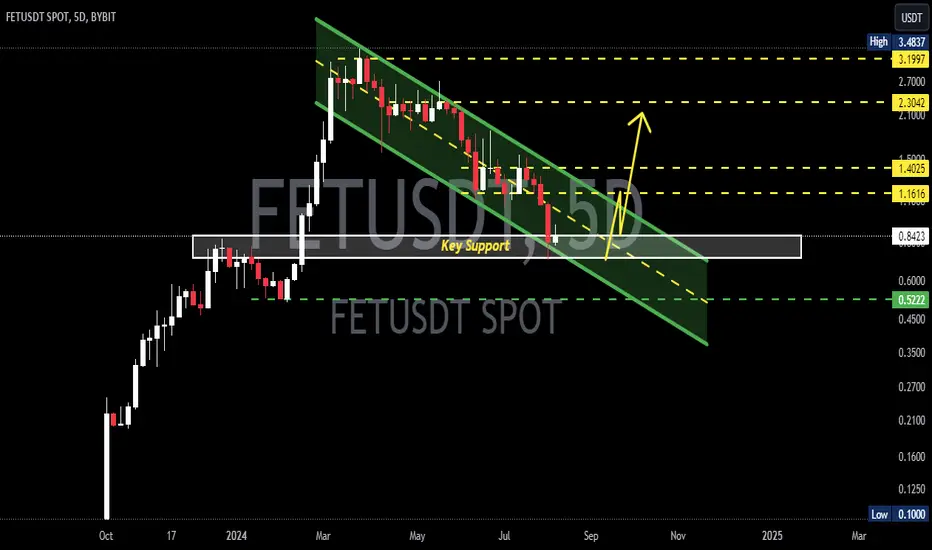
Fetch AI Gartley PatternFetch AI (or ASI, depending on Binance's ticker update) has been in a consistent downtrend from its peak at $3.48. It appears in a bottoming range, forming a classic Gartley pattern.
Key Levels to Watch:
Immediate Test Levels: The price will likely test the $1.00 - $1.18 range soon.
Accumulation Range: Any pullback to the accumulation zone between $0.70 - $0.94 would present a strong buying opportunity.
Targets Upon Breakout:
Target 1: $1.76
Target 2: $2.41
Target 3: $3.10
Risk Management:
Stop Loss: Set at $0.50 to manage downside risk.
A close above the downtrend line will confirm the breakout, potentially driving the price towards the T1 and T2 targets. Keep an eye on any pullbacks into the accumulation range, as these could provide optimal entry points for a potential upside move.

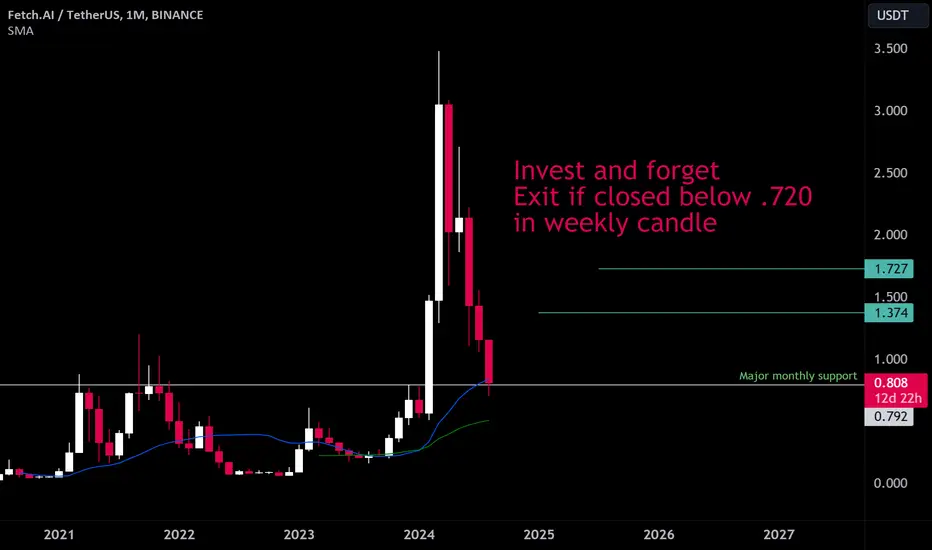
FET Long term Hold for 70-120% GainFET is on major monthly support
if BTC hold 50k
Possibility of this one bouncing here is max
FETUSDT - 1DElliott's five-wave cycle is being completed, and the Fibonacci ratio can be seen between the waves. The price target of around $9 can be reached for it in the form of a bull run in the cryptocurrency market.

Fetch.ai — Risk Of A Huge Drop (Again)!FET has experienced massive bearish pressure since it dropped below its consolidation area in June.
As a result, the token has dropped 60% in two months.
Based on the current chart pattern, the downturn isn't over yet. Contrary, we could see another vast drop soon.
FET currently trades in a bear flag. A break out to the bottom would likely send us to 0.50 levels.
A close below the lower trendline on a higher timeframe should give us a good chance to short, given that the broader market continues in its sideways move.
I will definitely watch this level closely!

FETUSDT bouncing from a major support!!Join our community and start your crypto journey today for:
In-depth market analysis
Accurate trade setups
Early access to trending altcoins
Life-changing profit potential
Hello everyone,
Let's analyze Fetch.AI (FET) both fundamentally and technically.
FUNDAMENTAL ANALYSIS:
Fetch.AI is an AI lab creating an open, decentralized machine learning network with an integrated cryptocurrency economy. Their platform democratizes access to AI technology by providing a permissionless network where anyone can connect and securely access datasets. Autonomous AI on this network performs tasks that utilize a vast global data network. Fetch.AI's model focuses on applications such as enhancing DeFi trading services, optimizing transportation networks (like parking and micromobility), managing smart energy grids, and improving travel systems—essentially, any complex digital system dependent on extensive datasets.
TECHNICAL ANALYSIS:
FET has undergone a significant 80% correction from its all-time high but is currently finding support at $0.712. This level is crucial for the coin's recovery.
Technical indicators are showing bullish signs:
Strong support levels: Price is holding above the 200 EMA on daily and 50EMA and 100EMA on monthly charts.
RSI nearing oversold: The RSI indicator is approaching the oversold zone, suggesting potential buying pressure.
Entry: $0.636 - CMP
Target: $4.5 - $5.6
If the $0.625 support breaks, a deeper correction towards $0.18 - $0.25 is possible, offering a potential accumulation opportunity.
Like And share the content.
Happy Trading!!
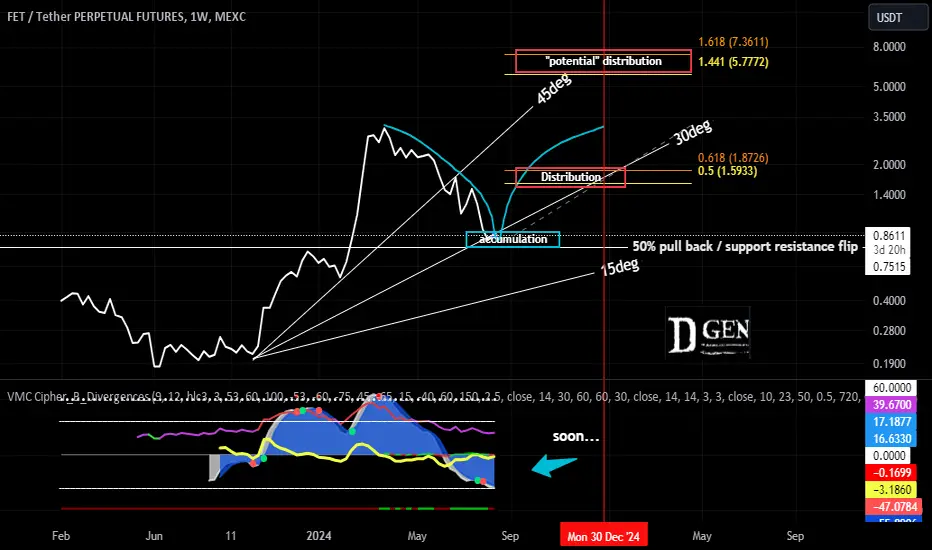
FET Re-Accumulation Time?It has been a while since taking any serious interest in crypto as things cool off.
Enough time, enough discount, new interest...
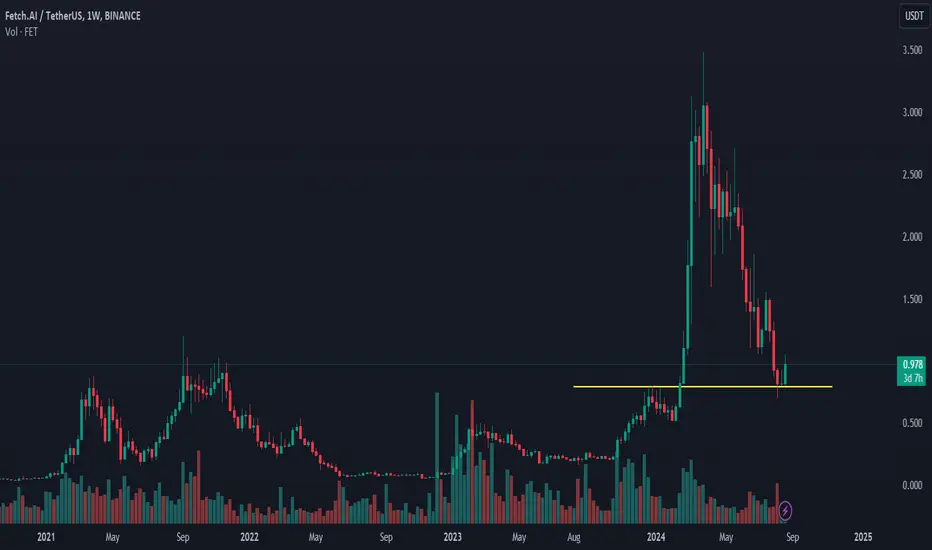
This is a weekly line chart of FET. Looking at the price action there has already been a typical but always hated 50% pull back to the lows.
This 50% pull back magically aligns with its last major broken resistance for a hopefull support resistance flip.
Looking at momentum and the curvature of the price action we can see it has reach max velocity in time for percentage of value loss. This is the point where we typically see a reveral. The culmination of the curve.
Measuring rate of change in our typical 15degree intervals we can see we are also ina time area for a typical reversal.
Momentum oscillator on the weekly is also in the seriously over sold area with momentum slightly just begining to shift to the upside.
Trading Plan: These are "signals" of a high probability buying oppertunity for at least a relief rally. There is a loss of momentum at critical support. Current plan is to DCA as price action confirms allowing to accomodate one more potential serious price drop. There is certainly room for another drop and would create an even better buying oppertunity BUT the current price is equally likely to hold as support.
FET Technical Analysis in Weekly TimeframeHello everyone, I’m Cryptorphic.
For the past seven years, I’ve been sharing insightful charts and analysis.
Follow me for:
~ Unbiased analyses on trending altcoins.
~ Identifying altcoins with 10x-50x potential.
~ Futures trade setups.
~ Daily updates on Bitcoin and Ethereum.
~ High time frame (HTF) market bottom and top calls.
~ Short-term market movements.
~ Charts supported by critical fundamentals.
Now, let’s dive into this chart analysis:
FET is down 80% from its all-time high and is currently holding support at $0.712. If this support holds strong, the price is likely to rebound to $3-$4.
The RSI is close to the oversold zone and is forming a hidden bullish divergence, indicating a bullish signal for FET.
Key levels:
- Accumulation: $0.460 to CMP
- Primary Resistance: 21 EMA at $1.424
- First Target: $3-$4
- Higher Target (Long-term): $10-$12
DYOR, NFA.
Thanks
#Crypto #FetchAI

These AI 786 backtests look great for $PAAL & $ASI $FETBoth of these AI 786 backtests look great for $PAAL & CSELK:ASI NYSE:FET
Channel and cyclic lines put both coins above double digits.
Will you fade the AI narrative this cycle?

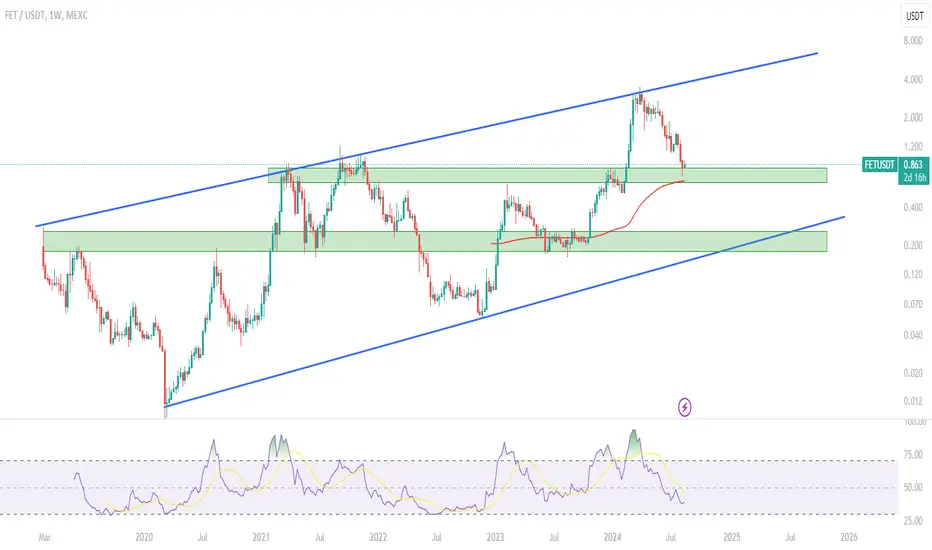
Support and resistance levelsFetch.AI has reached the support level in the $0.70 to $0.74 range after a downtrend. This strong support level may play a crucial role in stabilizing the price and preventing further decline. However, there are not yet sufficient signs to confirm a trend reversal, and market reaction in this area should be closely monitored.
Support and Resistance Levels:
Support Levels:
$0.74 Level: This is a key support level, with the price currently fluctuating near it.
$0.70 Level: This lower support level may act as a backup if the $0.74 level is broken.
Resistance Levels:
$0.888 Level: This level acts as the first significant resistance, and breaking through it could indicate a return of buyer strength.
$0.948 Level: This higher resistance level, if surpassed, could further strengthen the upward trend.
FET is currently in a support zone that could act as a balance area. However, to confirm a trend reversal and the start of a new upward movement, the price needs to break through the key resistance levels at $0.888 and $0.948.

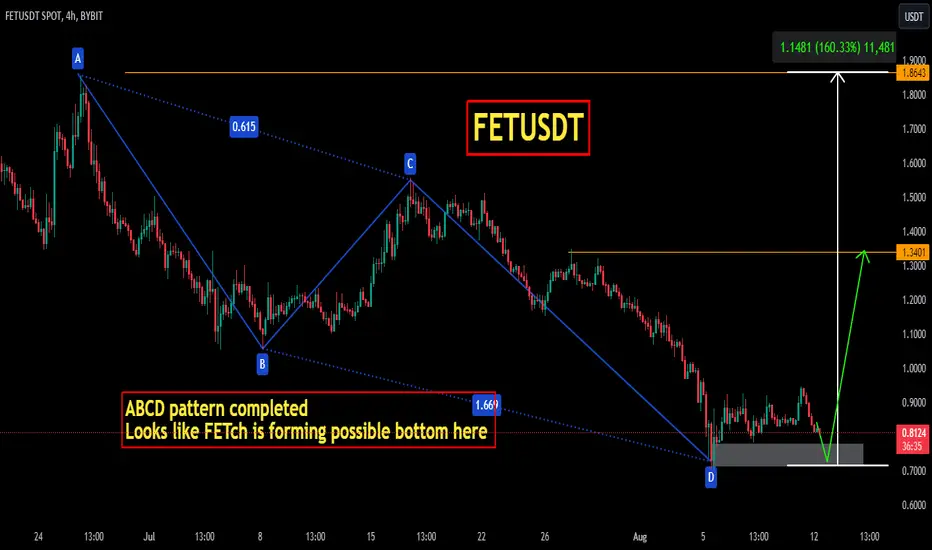
FETUSDTFETUSDT is trading in strong bearish trend and consistently printing LL LHs. and is about complete ABCD pattern at strong daily support level. And it looks like FETUSDT forming a local bottom here .
If the bullish rally starts from here , the next possible target could be 1.3500 followed by 1.800
FETUSDT 5DFET ~ 5D
#FET If you have conviction on this token, you need to pay attention to this key support. A bounce from here would halt further declines. or if this support block is lost, COINBASE:FETUSD Will retest the price of $0.6-$0.5
FETUSDT.PJust want to share about my oppinion , dyor guys if you have diffrnt view , tell me on the chat!
FETUSDT.PJust want to share about my oppinion , dyor guys if you have diffrnt view , tell me on the chat!

FET - Bouncing back from the support zoneBINANCE:FETUSDT (1D CHART) Technical Analysis Update
FET is currently trading at $1.29 and showing overall bullish sentiment. The price has hit the support zone and held strong. We are seeing a clear bounce back from the support, which is a bullish sign and a good opportunity for a long trade.
Entry level: $ 1.303
Stop Loss Level: $ 0.910
TakeProfit 1: $ 1.487
TakeProfit 2: $ 1.644
TakeProfit 3: $ 1.876
TakeProfit 4: $ 2.329
TakeProfit 5: $ 3.336
Max Leverage: 3x
Position Size: 1% of capital
Remember to set your stop loss.
Follow our TradingView account for more technical analysis updates. | Like, share, and comment your thoughts.
Cheers
GreenCrypto

#FET READY FOR 500% GAINBuy and Hold for 2-6 Months
Target is $5 sooner or later your money is waiting..
#FET NYSE:FET #AI

Let's try this again - FET ShortFET has hit a 6.85 just as it did in its last market cycle top. I think that from here there is a chance that it dumps down to the 2.618 area as an initial dump. This is approximately around $1.22.
Once this initial dump takes place, it will likely do a nice bounce back upwards, which typically sets up another dump/short opportunity. This bounce will probably take us back up to around $2.50. So a nice long opportunity within a short opportunity. If this plays out as it did last time, you should be able to short down to around 57 cents. So first short - about 60%, counter trend long - 100%, second short op - 73%. That's IF this plays out the same way as it did last cycle.
If we just continue bullish - my next upward target is $4.52.
