FET Long: EWT Analysis +$10 coming? By April 2025?All roads lead to roam.
+ Cycle Parallel Channel
+ Impulsive Parallel Channel
+ Cycle Wave 3 impulse of Wave 5 Primary.
The target is 1.618 to 2 Fibonacci extension.
Last Rally for Cycle Wave 5 topping around Nov/Dec 2025
FETUSDT.P trade ideas

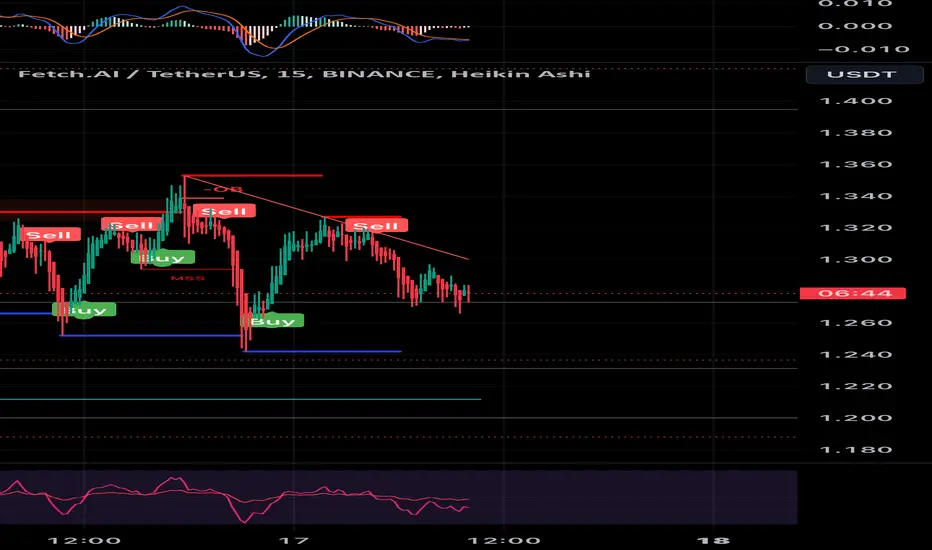
FET Long - Bullish Orderflow.Bullish Orderflow
Weekly inversion
+SFP (swing failure pattern)
3D BiSi (bullish fvg)
1D BiSi (bullish fvg)
Golden Pocket for optimal entry

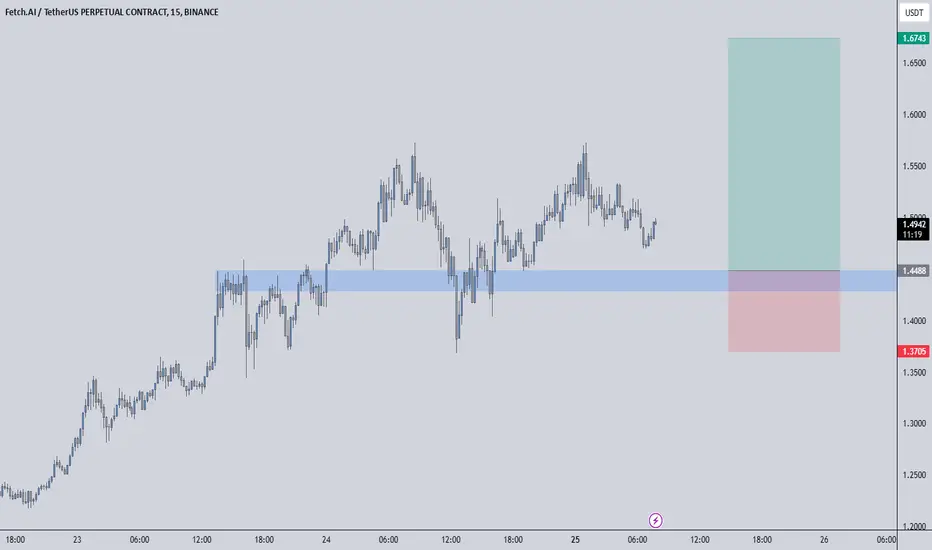
Title: FET Trade Setup – Bullish Bat on 1H with 2.43 R:R ---
---
**Analysis**
This trade idea is based on a **Bullish Bat pattern** forming on the 1-hour chart. Current market price (CMP) provides an optimal entry for a potential upward move.
- **Asset Pair:** FET/USDT
- **Timeframe:** 1H
- **Key Levels:**
- **Entry:** CMP (1.442)
- **Stop Loss:** 1.409
- **Target:** 1.55
- **Risk-to-Reward Ratio:** 2.43
### Risk Management
Well-defined risk with a **2.43 R:R ratio**. Monitor closely
---
### Disclaimer
*This idea is for educational purposes only and is not financial advice. Trading involves significant risks. Conduct your own analysis before making decisions.*
---

Alt Market been super boringUntil Eth makes its run, alt coins tied to it for the most part will continue their boring pattern.
AI hype seems to have died down and Fetch will probably make a run, but a 2-4x on this coin is probably the most we will see. Hopefully I am wrong.
Keeping my eye peeled for the next faction of this market run up.

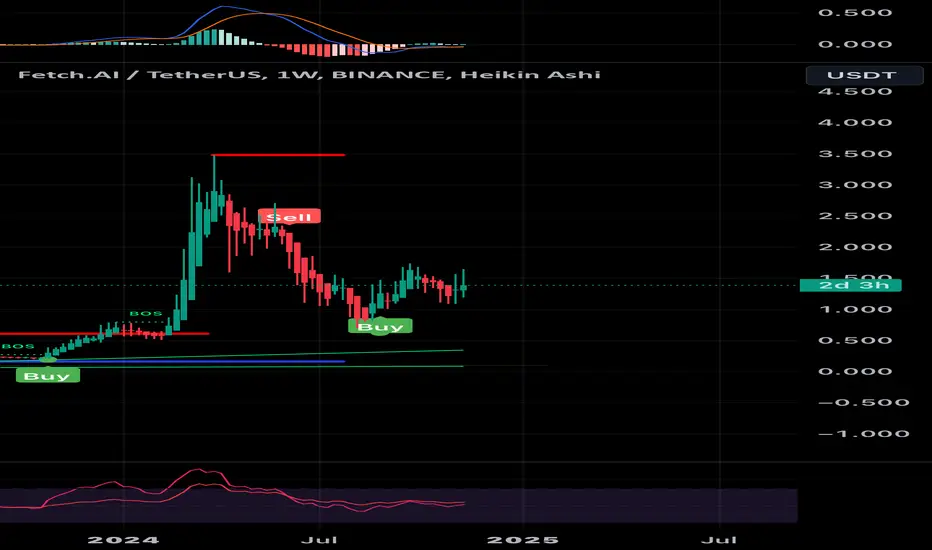
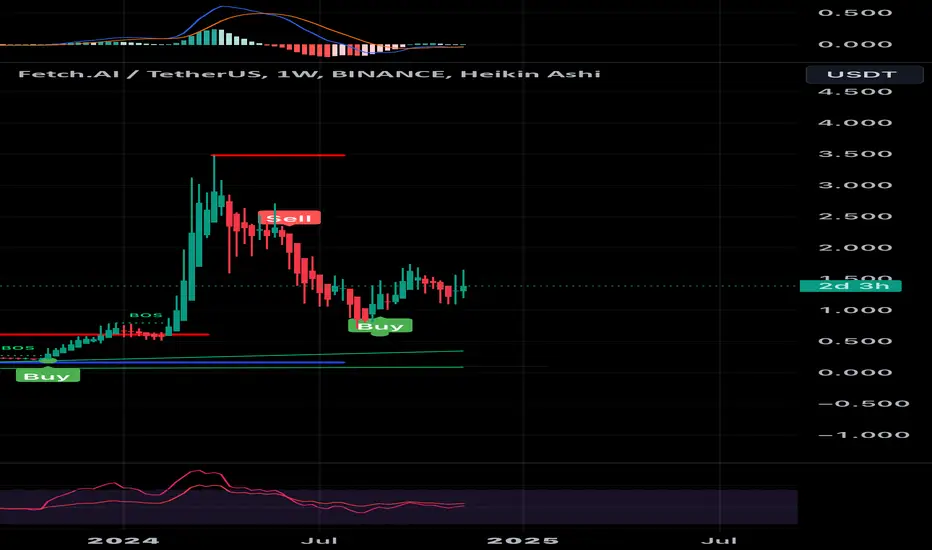
FETUSDT.P It's simple, but it's the best demand zone we have. It wouldn't be foolish to try our luck from here.
Fet has all the AI hype needed to rally in the new market cycle.
My Previous Ideas
DOGEUSDT.P | 4 Reward for 1 Risk much more if you hold it.
RENDERUSDT.P | HTF Accuracy
ETHUSDT.P | Accurate Buyer Zone Identification | High Risk Reward if you hold it.
BNBUSDT.P | Accurate Buyer Zone Identification | High Risk Reward if you hold it.
Bitcoin Dominance | Great Characteristic Detection and Accurate Analysis
Is this even Possible ?! $FET(ASI) to $40 ?🚀 Double Bottom Pattern with Strong Buyers! 🔥
When the second bottom forms higher than the first, it signals that buyers are gaining control, and selling pressure is weakening. 💪
After breaking the resistance, the price target is calculated based on the height of the pattern from the resistance level.
📊 My Analysis:
Resistance: $0.74
First Bottom: 0.014
Potential Target: $42
Everything is Possible in a Mega Bull-run , Get ready for a strong bullish move! 📈✨
Always DYOR !

This chart for Fetch.AI ($FET/USDT)#FET \ USDT
This chart for Fetch.AI ($FET/USDT) signals a strong bullish outlook. The price has been forming a rounded bottom pattern, which often indicates a potential trend reversal and the start of a significant rally.
The breakout above the horizontal resistance confirms bullish momentum, with targets set at:
1 : $2.238
2 : $2.721
3 : $3.276

$FET breakout?I was looking at NYSE:FET from daily it seems is coming under the 200 ema. I noticed the 9ema is about to cross the 20ema, and wants to break the trend. I also see that the coin us oversold. Any thoughts?

FET/USDT Breakout Expected
FET/USDT is showing signs of a potential breakout as it edges closer to a significant trendline resistance 📈. The price has been consolidating within a tight range, indicating a buildup of momentum 💥. A confirmed breakout could lead to a strong upward rally. Keep this pair on your watchlist for critical signals.
Key insights:
1. Testing resistance: FET/USDT is approaching a trendline that has previously held as resistance. Breaking above this level could trigger a sharp move higher 🔑.
2. Volume surge: Watch for increased trading volume during the breakout to confirm strong buying pressure 🔥.
3. Momentum indicators: RSI and MACD are showing signs of bullish strength ⚡, supporting the possibility of a breakout.
Steps to confirm the breakout:
- Wait for a confirmed 4H or daily close above the trendline resistance.
- Look for a noticeable increase in trading volume to validate the move.
- A retest of the broken trendline turning into support adds further confidence.
- Be cautious of fakeouts, such as sudden reversals or wicks above the trendline.
Potential targets post-breakout:
- Immediate resistance:
- Next target:
Risk management:
- Use a stop-loss below the trendline to protect your position.
- Stick to proper position sizing to manage your risk effectively.
This analysis is for informational purposes only. Always do your own research (DYOR) before making any trading decisions. Let me know if you'd like further refinements!
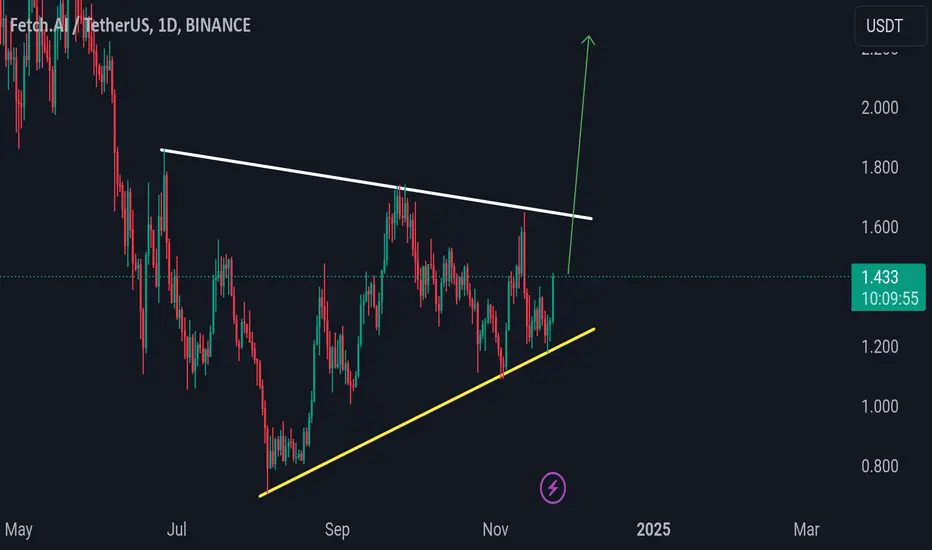

FETFET forming a bullish pennant, which should take the price above $2.
There are EMA resistance working on the trend on several time frames hence I believe it should return to its previous buy zone and hopefully take out the sell side liquidity
Follow me for more content
TradeCityPro | FET : Will the AI Crypto Trend Reignite?👋 Welcome to TradeCity Pro!
In this analysis, we’ll examine FET Coin, a prominent AI crypto project that gained substantial traction following the rise of AI models like ChatGPT.
📅 Weekly Timeframe: Consolidation and Correction After a Bullish Run
On the weekly chart, the AI crypto trend led to significant buying volume for FET, driving its price up by 5000% from early 2023 to a new high at $0.283. Currently, the price is in a correction phase.
📈 Throughout its uptrend, the price has followed a trendline. Now that the price has returned to this line, the key question is whether the trendline will hold or break. If a candle closes below this trendline, the trend reversal will likely be confirmed with the break of the $0.852 support level.
🧩 Additionally, the SMA99 has historically acted as a dynamic support, sitting below the candles over the past year. If the price revisits this SMA, it could act as a support level again. However, a break of both the SMA and the $0.852 level would confirm a bearish reversal.
📊 On the RSI, the critical level of 37.74 has prevented further declines twice already. A break of this support would signal a loss of bullish momentum.
🌱 Conversely, if the RSI surpasses 55.17, bullish momentum and significant buying volumes could return to the market. In the event of a breakout above the all-time high at $2.83, Fibonacci projections suggest long-term targets at $10.225 and $20.235. However, these targets are symbolic and contingent on the trend continuing. If the trend reverses before these targets are reached, exiting positions early would be prudent.
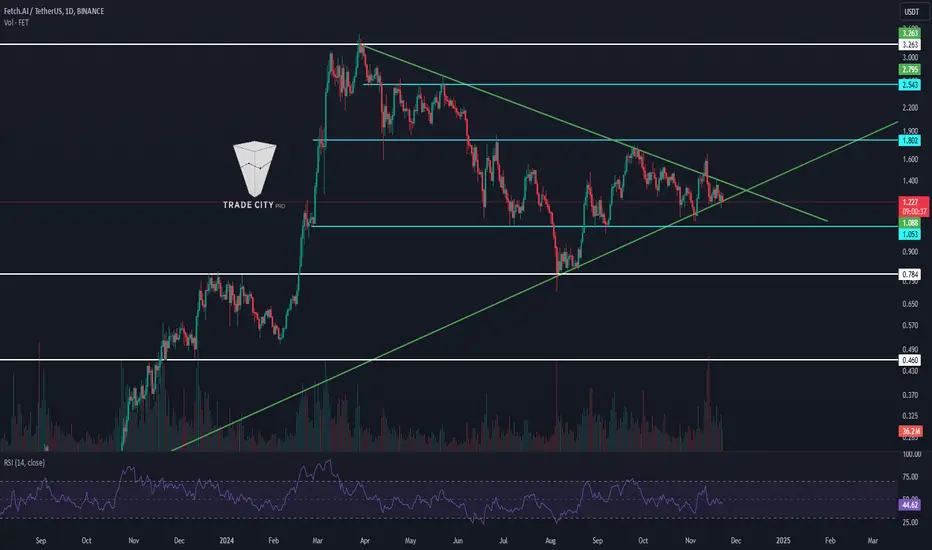
📅 Daily Timeframe: At the Apex of the Triangle
On the daily chart, the price is forming a symmetrical triangle, created by the confluence of a descending trendline and the ascending weekly trendline.
🔍 A breakout in either direction will determine the price movement for the coming weeks. Given the higher credibility of the ascending trendline due to its longevity, the probability of breaking the descending trendline increases.
🔼 If the descending trendline is broken to the upside, expect bullish movement, and $1.802 serves as an ideal trigger for entering spot or long-term futures positions. Resistance levels to watch are at $2.263 and $2.543.
📉 However, if the descending trendline holds and the $1.053 trigger is breached, this would confirm a bearish Medium Wave Cycle (MWC). The next support would be at $0.784.
⚖️ Given the proximity to the triangle's apex, oscillators and indicators may provide unreliable data, so they were not considered in this timeframe analysis.
👑 FET/BTC Pair: Symmetrical Triangle Breakdown
On the FET/BTC chart, a symmetrical triangle has already broken to the downside, with the breakout trigger at 0.00001386 now activated.
🎯 Currently, the trend appears bearish, with the next support levels at 0.00001221 and 0.00001001. If the RSI drops below 30, expect even stronger bearish momentum.
🔑 Conversely, if the resistance at 0.00001886 is broken, bullish momentum and volume may enter the market. In this case, potential upside targets are at 0.00002655 and 0.00006840.
📝 Final Thoughts
This analysis reflects our opinions and is not financial advice .
Share your thoughts in the comments, and don’t forget to share this analysis with your friends! ❤️
FET USDTWaiting for the AI sector momentum. FET is building a nice setup for a huge reversal to the upside. Traditional Inverse head and shoulder is formed. Should be an exciting play to watch. Hope this helpful.

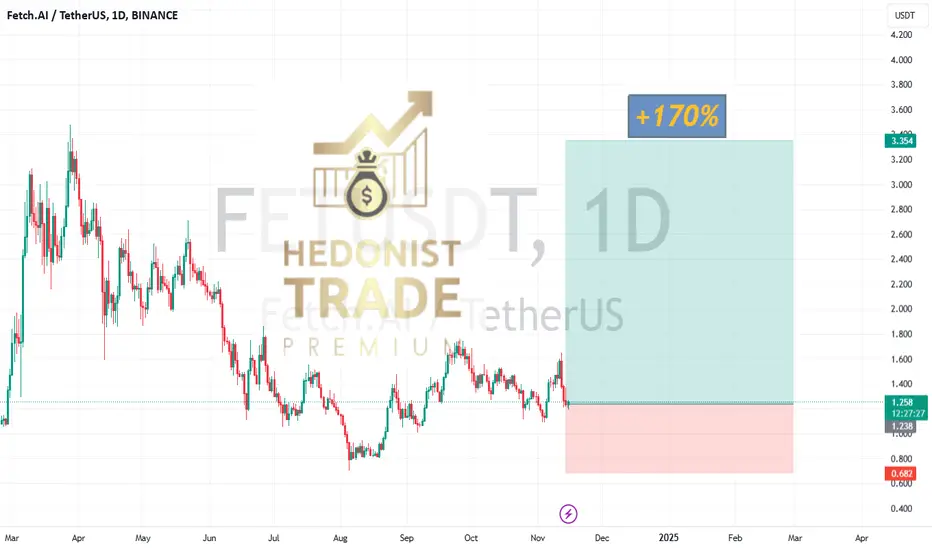
FETUSDT - Aiming for a 170% UpsideFET/USDT is showing a promising setup on the daily chart, as the price has stabilized after a prolonged downtrend. This area could serve as a strong base for a potential upward movement, especially given recent market conditions.
Why Enter This Trade?
Support Zone: FET is trading near a key support level where it previously found strong buying interest. This could act as a launchpad for a recovery.
Trend Potential: The broader market trend for AI-related projects has shown resilience, and FET is positioned to benefit if this sector sees renewed interest.
High Reward Potential: With a target of 170% on the upside, this setup provides an excellent risk-to-reward ratio if the bullish reversal plays out.
As always, discipline is essential. We’re not simply betting on a bounce but positioning ourselves strategically to capitalize on a potential rally if momentum shifts in our favor.
19.11.24 FETUSDT Buy H4 OutlookLooking for a buy after a pullback into 78.6 fib level after a significant run to the upside during September to November.

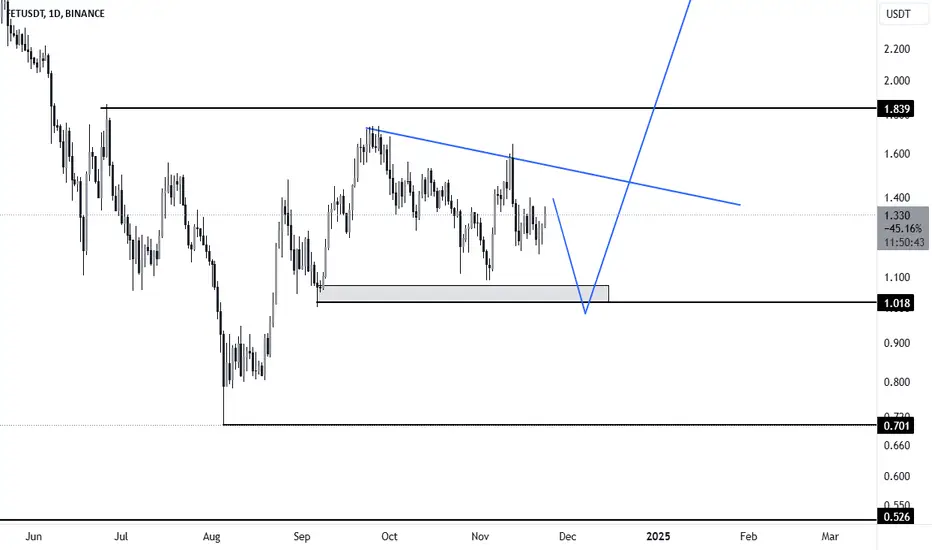
Fetusdt to where?We have downtrend from the last high and now uptrend with correction less than 25% of that high
The uptrend still weak and it could be a small correction for the main downtrend beside the volume has conversion
But we can predict the bottom as long as our SL area is too close to the entry area
So what do ya think guys ?


FET might be a sleeping rocket. Not a financial advice!
FET seems like there might be some action soon.

If you dont sed this you sleepingPreparing for take up.
Please make sure to put your seatbelts on.
8-10 dollar reach here we come
If you dont sed this you sleepingPreparing for take up.
Please make sure to put your seatbelts on.
8-10 dollar reach here we come
FETCH.AI possible route till May25 RSI & MACD pretend to carry the idea of the trend-channel, so that my personal outlook is $18 by May. Fingers crossed.

FET | ALTCOINS | TOP ALT for coming ALTSEASONFETCH was one of my TOP altcoins for 2024, and has seen some more increases since my lst update. (Find the previous update here :)
THIS is the initial introduction to FETCH in January, when I identified this as a good buy for 2024:
I'm optimistic for the remainder of 2024; FETCH and other alts will see great increases as soon as BTC takes a breather and trades sideways for a few days.
_______________________
BINANCE:FETUSDT
