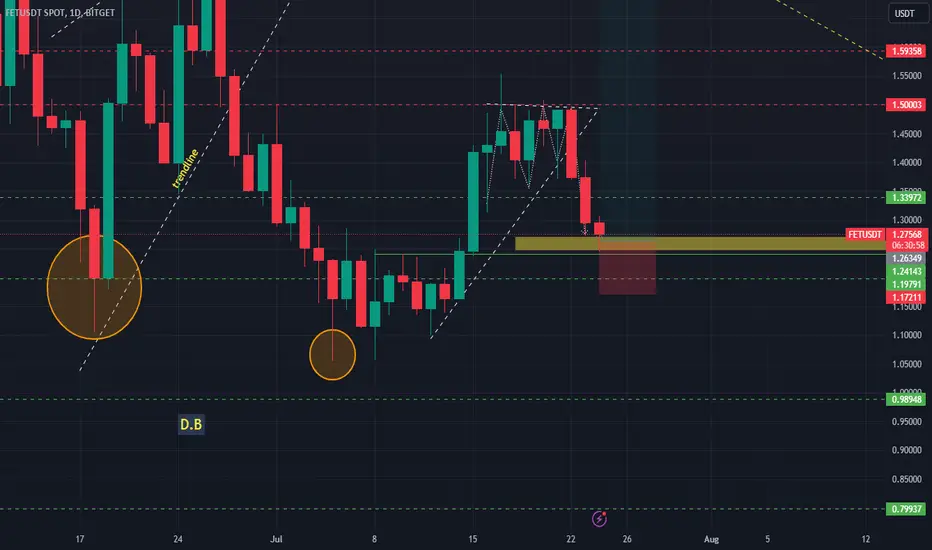
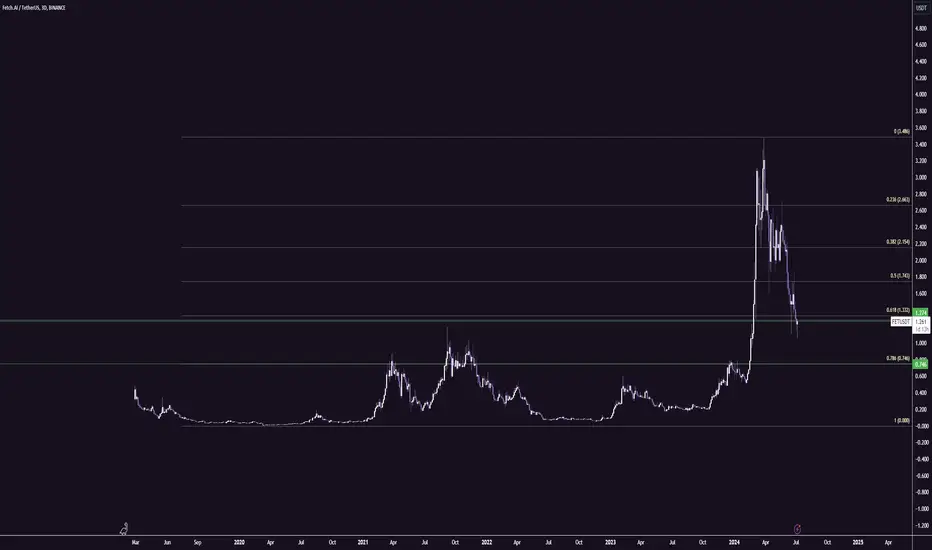
FETUSDT Goes Upward If FETUSDT Close above yellow box which I share on My Idea, It Will follow the Fibonaaci Retrace ment on Daily time frame and Give Massive Gains. BITGET:FETUSDT
FETUSDT trade ideas
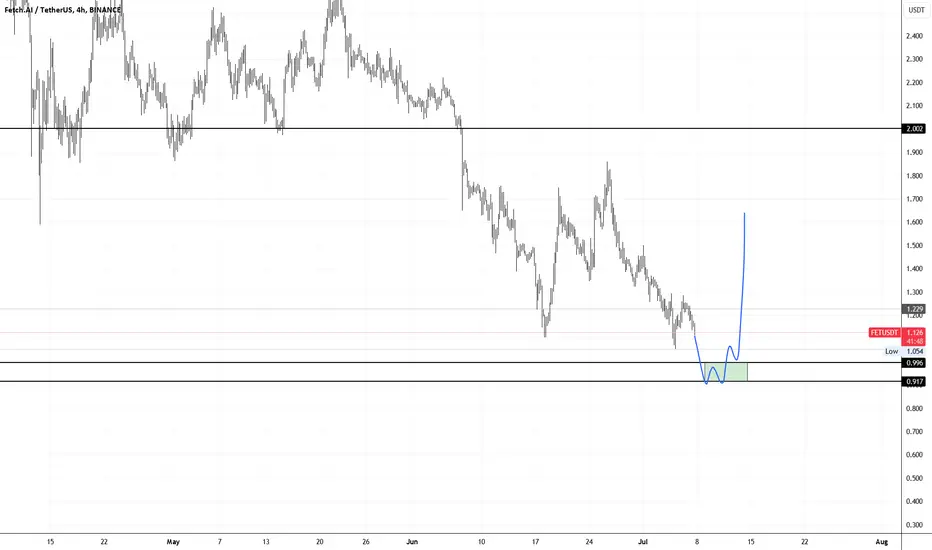
FETUSDT Bullish PennantFETUSDT technical analysis update
FET price has formed a pennant pattern on the 4H chart. It's a bullish continuation pattern. Once the price breaks the pennant pattern, we can expect a bullish continuation in FET.
Buy once the price breaks the pennant resistance line.
Stop Loss: 1.40

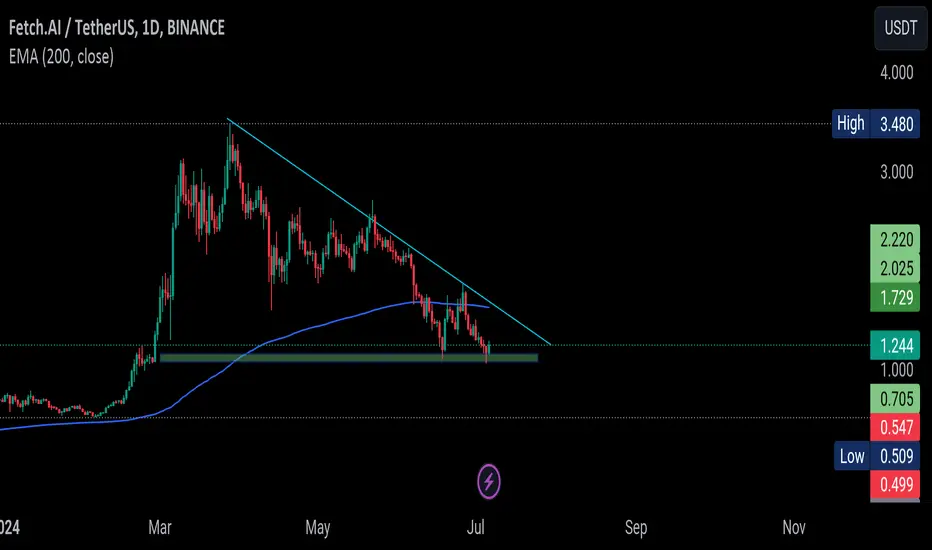
FETUSDT 1DFET ~ 1D
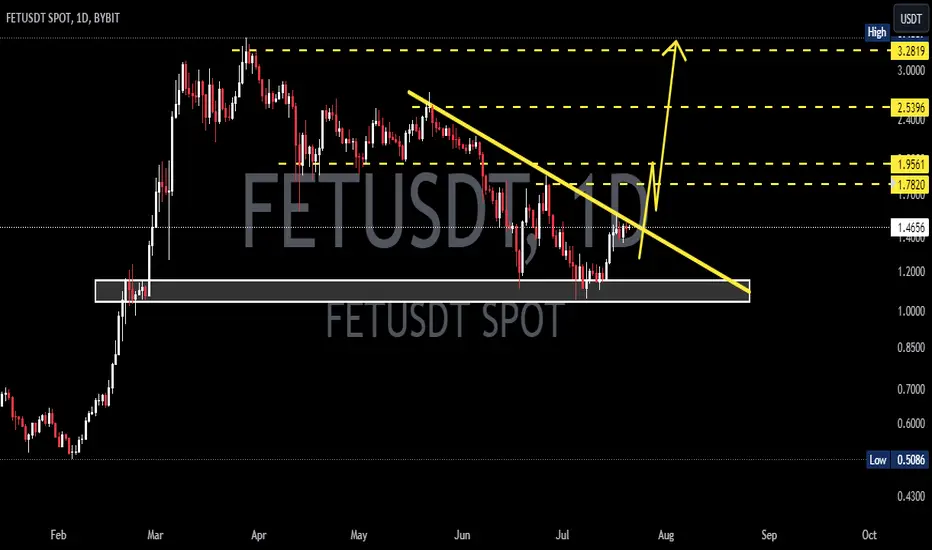
#FET It is only a matter of time for COINBASE:FETUSD to break through this resistance line. Target minimum 15%++ from here.
New Bullish Trend Is About To Start 📈 Perfect Bullish Structure Formed At The Chart ,There Is a Clear Bull Flag By The ABC Corrective Structure And Wave C Shaped Impulsive And Completed At The 1.1$ Area ,Currently The Price Rejected From The 0.618% Fibo Level And Playing Below The Important Trend Line ,The Main Trend Is Extremely Bullish And I Expect a Breakout But Before That Little Correction Below The Trend Line Is Expected

FET AI - SECOND SCENARIO
BINANCE:FETUSDT should be going down to $1.28 from there, I expect a bounce and it bullish continuation because on the daily timeframe which is considered a primary cycle, the volume is still pretty strong.
Unlike the first scenario, this one won't be going much higher but at least $6 is expected so when you get there, don't make the mistake of "oh we are going to the moon" and forget to take profit.
OTHER ANALYSIS

long FET for 2X profitsFET is now in high strong recommended area to buy
the price hit the Fibonacci 0.786 and showed a strong support LVL
also i broke the down trend and i guess I'll format cup and handle pattern before the up trend starts or VIAGRA candles
i recommend u to buy half of the amount at this price LVL and a Limit order with other half at 1.4$
BINANCE:FETUSDT.P

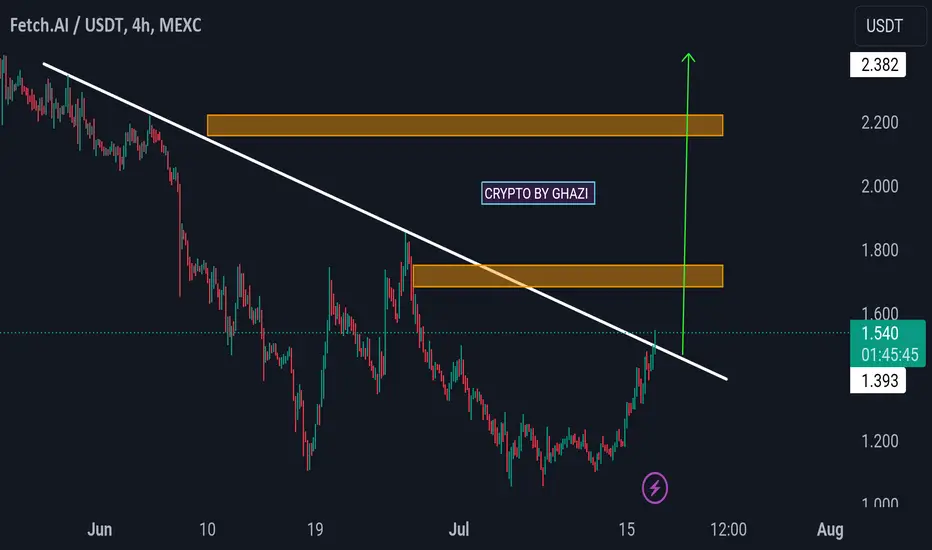
FET/USDT Plan FET/USDT is breaking the trendline resistance on the 4-hour timeframe. I anticipate a successful breakout with a potential 30-40% bullish move in the short term. This is not financial advice, so please conduct your own research (DYOR) before making any decisions.
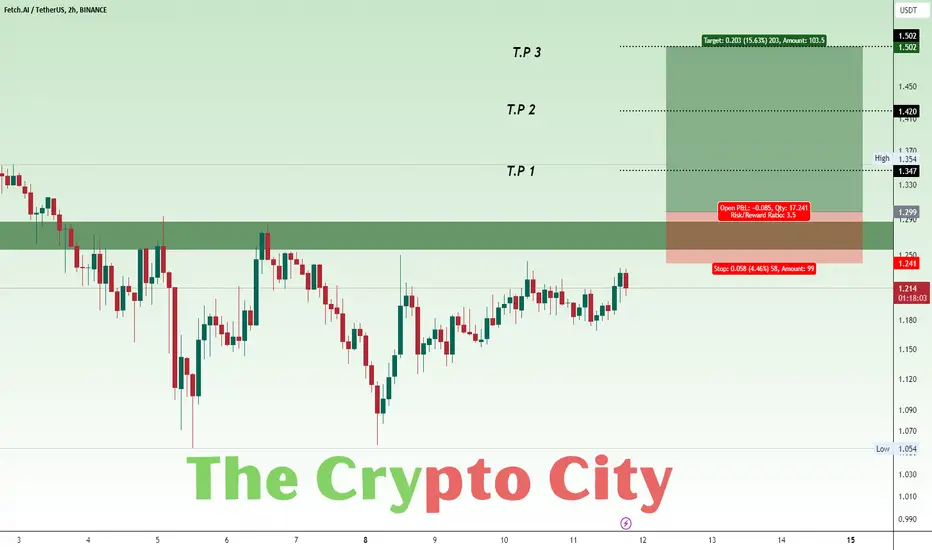
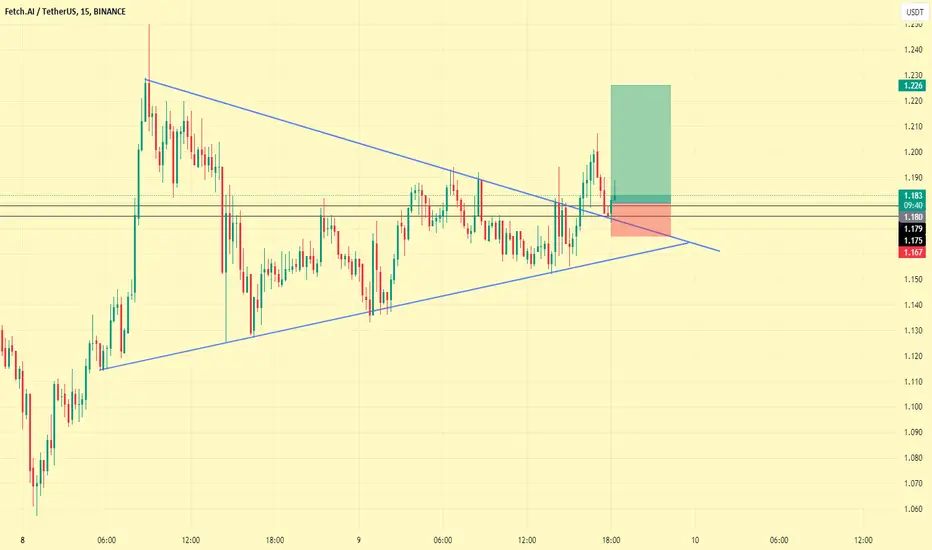
FET USDTFET/USDT Setup. After a confirmed breakout from the marked zone in green, we could take an entry at 1.299 Remember stop loss is your friend. Everything is on the chart.
Entry 1.299
S.L 1.241
T.P 1 1.347
T.P 2 1.420
T.P 3 1.502
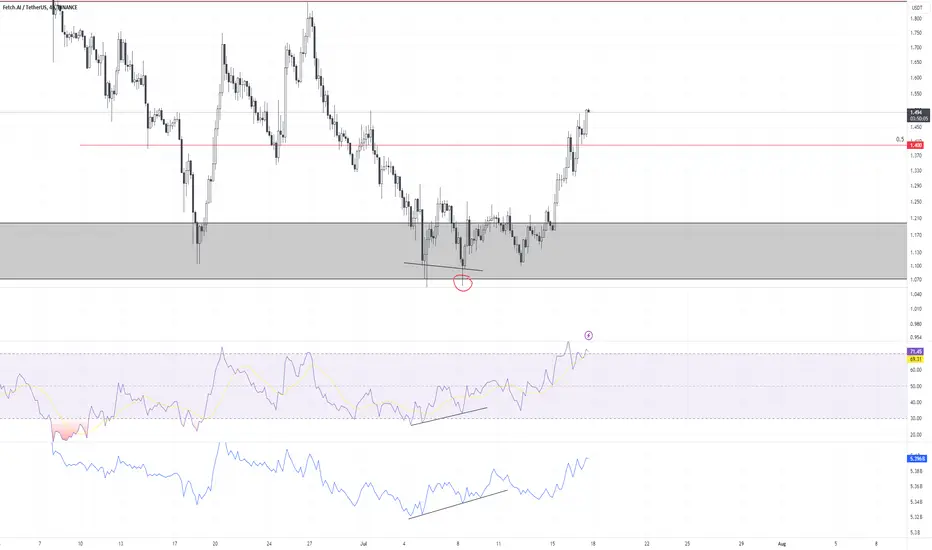
Perfect bullish DivergencePlaced an order at $1.064 once price had already swept the low, price came back down and filled perfectly on the retest. You can see RSI and OBV showing a change in volume and momentum to the upside before price does.
Fet Preparing To Continue Its Bullish Momentum After Healthy CorSeems Like Crypto Market Has Already Completed Its Healthy Correction And Now Ready For Recovery Like Most Of Coins Showing Bullish Momentum Fet From One Of Them Seems Like Ready For Solid Recovery In Coming Weeks Breaking Falling Wedge In H12 Timeframe Incase Of Successful Breakout Expecting Massive Bullish Rally Towards New Ath
Expecting Move Towards 5$ Incase Of Successful breakout

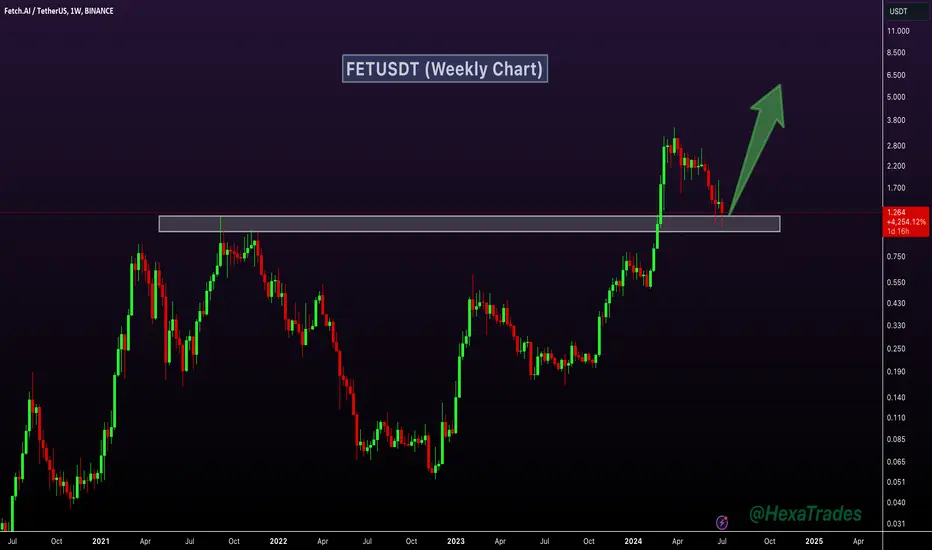
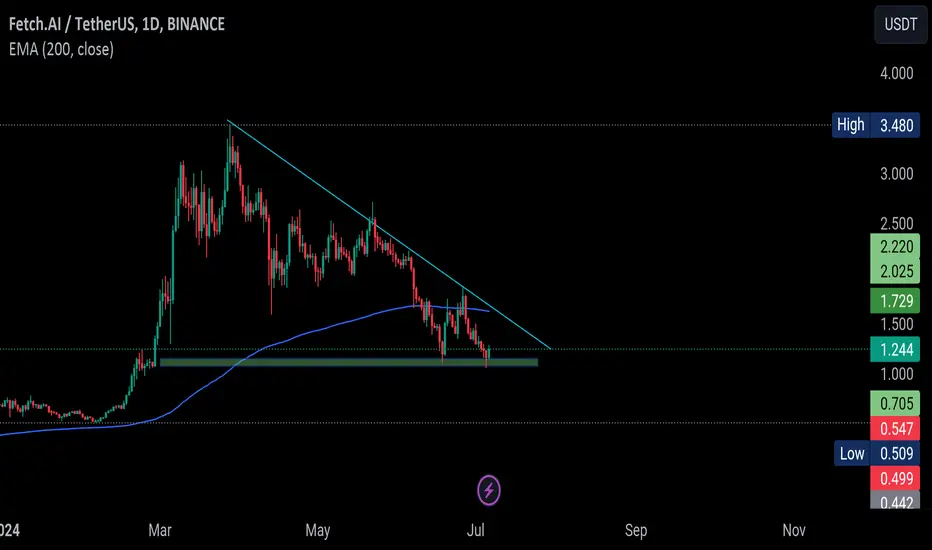
FETUSDT Next Target $5.00!FETUSDT Technical analysis update
FETUSDT's previous resistance is acting as a good support. We can expect a bounce from this support level.
Buy zone : Below $1.25
Stop loss : $0.97
Take Profit 1: $1.50
Take Profit 2: $1.87
Take Profit 3: $3.10
Regards
Hexa
Is #FETUSDT Primed for a Major Breakout?Yello, Paradisers! Are you ready to dive into the latest action on #FETUSDT? Let's break down the crucial moves and key levels you need to watch.
💎Currently, #FET is hovering around the support zone at $1.488, showing signs of a potential upward swing. If it can maintain this momentum, we might see a successful retest of this support level, leading to a break of the descending resistance. This could open the door for a challenge against even stronger resistance zones ahead.
💎The price has successfully completed a retest phase and is now gearing up to surpass the descending resistance. Patience is key here; wait for a clear breakout above the descending resistance level before planning any trades to ensure you’re not caught in a false move.
💎As experienced #FET traders know, navigating the cryptocurrency market is like playing a strategic game. While the current bullish momentum looks promising, it’s crucial to have a Plan B. If #FET fails to maintain its momentum and starts to decline, look for a rally from the lower demand level at $1.368.
💎If #FET drops below this secondary demand level, it’s a signal to reassess your strategy. Be prepared to adjust your bullish outlook and modify your trading tactics to align with the evolving market conditions.
Stay sharp, stay focused, and as always, trade smart, Paradisers!
MyCryptoParadise
iFeel the success🌴

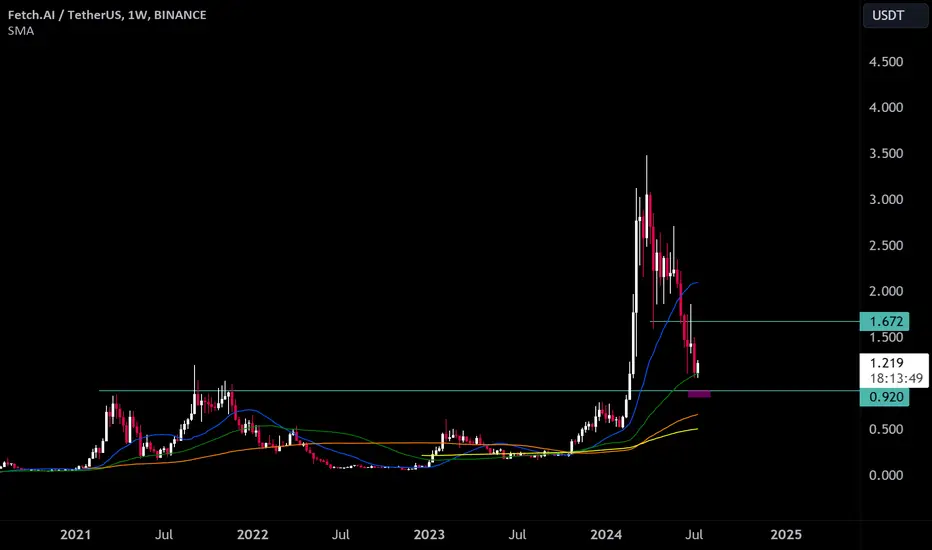
FET - Entering accumulation zoneThis one is hard to base solely on the charts just because Ocean Protocol (OCEAN), SingularityNet (AGIX), and Fetch.Ai just merged into Artificial Superintelligence Alliance (ASI). These aim to be leaders in the AI space and combining could show amazing strength.
Therefore, based on FET's chart it looks like a great accumulation range here's why:
-Holding weekly 50 MA (green MA)
- Double bottom on RSI (yellow line green arrows)
*The last time RSI bottom here was during the FTX collapse
It is possible to go a little lower into the "lower liquidity zone", but even at our current prices is a great time to start the accumulation process in case we do not drop in that zone.

FET Long Updateif BTC Remain bullish.
then this one has its potential for a bounce.
resting on 50WMA
FET is dropping to 0.85 and that's bullishThat is why a retest of NYSE:FET at $0.85 is healthy if it occurs.
Every time NYSE:FET has tested the Monthly 20 MA, it has started a macro rally from there.

Perfect example of Bearish DivergenceBoth OBV and RSI show weakness as price makes a higher high, this is a perfect indication of a trend reversal. OBV (on balance volume) measures buying and selling pressure, RSI (relative strength index) measures the momentum of price. Combining these 2 indicators allows you to identify a change in the market before price does.

FET - 1$ stop huntPretty sure we see FET dipping below 1$ coming days, monday or tuesday, it could then see a relief bounce into 2$, maybe bit lower, but all in all a decent entry with tight risk/reward. Will give this a shot, IF it gives.
Stay safe!
FET LONG
FETUSDT has established a key support level at $1.25, suggesting a potential rebound. With previous resistance now serving as support, it is advisable to consider buying below $1.25 and implementing a stop loss at $0.97. The asset is positioned for higher highs.
Set initial price targets at $1.50 (TP1) and $1.87 (TP2), with a more ambitious target at $3.10 (TP3). Additionally, monitor for the next significant target at $5.00.
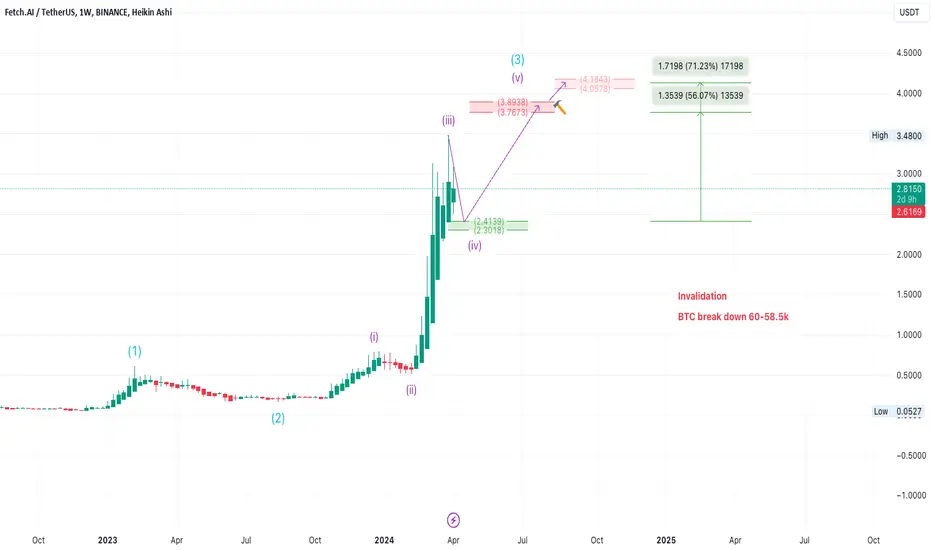
FETUSDT long Spot TradeFETUSDT Elliott Wave Technical Analysis
Mode: Impulse
Position: Wave (iv) of (3)
Direction: Wave (iv) of (3) is still in play
Details: Wave (iv) is still in play which I expected to be end around 2.3-2.4 which will be my entry point.
Next Direction: Wave (V) which will complete the next higher Degrees Wave (3)
Target : the area between 3.75-3.9 with about 60% profit, if break the next target is the area between 4.1-4.2 with 70% profit.
Wave Cancel invalid level: as I see FET follow BTC move, so for this one my invalid level is BTC Daily close below 58.5K
Disclaimer:
This analysis is intended for educational and informational purposes only and should not be construed as financial advice. Always conduct your own due diligence and consult with a professional financial advisor before making investment decisions.
Grabbing some ASI(FET) spots while I still canLoading my spot bags with some more ASI (former FET). Will buy more at 0.746 if we get there.
The alliance is cooking and AI narrative is here to stay. All the merger fud is wearing off and I'm betting on ASI to be the main AI token for this bull.
FET/USDT JUNE - 2024The market correction presents a prime buying opportunity as panic selling sets in. We've been patiently waiting for this moment. FET is now on our radar, with two identified buy zones ready for accumulation!
Remember, this is a spot trade—not a leverage trade. We carefully select and buy our coins in spot, aiming for massive gains without the stress of leverage and the shakeouts happening across the crypto market. While there's potential for further dumps and shakeouts, we're ready to hold our position as long as these two levels hold. However, be prepared for the possibility of losing the last line of support if the situation worsens.
-----------Disclaimer --------------------
This is not financial advice. Please do your own research and consider your risk tolerance before making any investment decisions.
It's crucial to manage your funds wisely. If the market loses the main support area, especially on the weekly chart, be prepared to exit your positions. However, stay alert for potential shakeouts - temporary drops that regain support—which can provide opportunities to re-enter the market.
Remember, the strategy for taking profit isn't about hitting an exact number. Instead, we focus on areas of possible resistance. As we approach these areas, we move our stop-loss orders higher, allowing us to follow the price action toward higher targets. This method helps secure profits as the rally progresses.
Always have a plan for both entry and exit points. By adhering to these strategies, we aim to optimize our trading outcomes and secure massive profits.
Successful trading involves understanding the rules and executing them with discipline. Stay focused, manage your risks, and be ready to capitalize on market opportunities.
Happy trading!
