FET - 1D - $1 - 75% profit - BULL FLAG SIGNALFET is currently in a Bullish Flag pattern en can potentially increase up to $1 as next important resistance level. This could give a potential profit of approx. 75%.
FETUSDT trade ideas

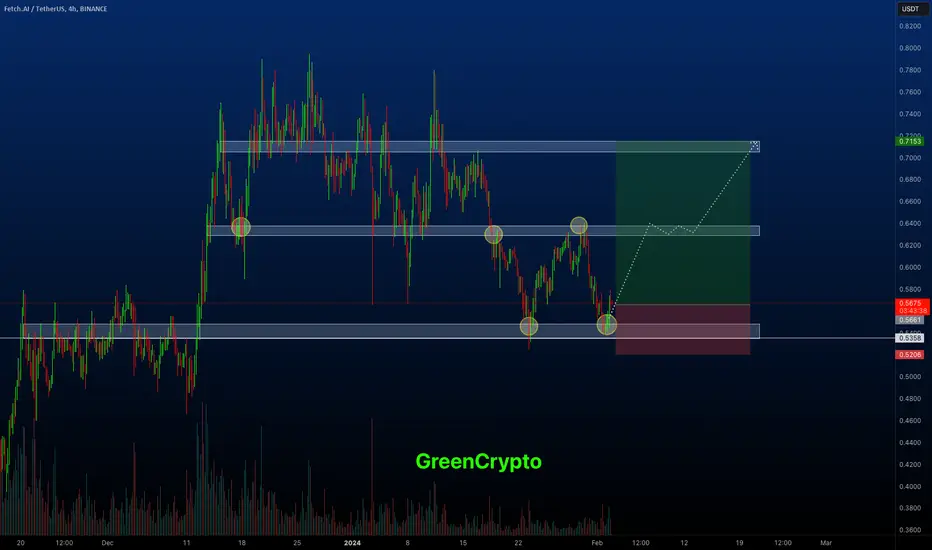
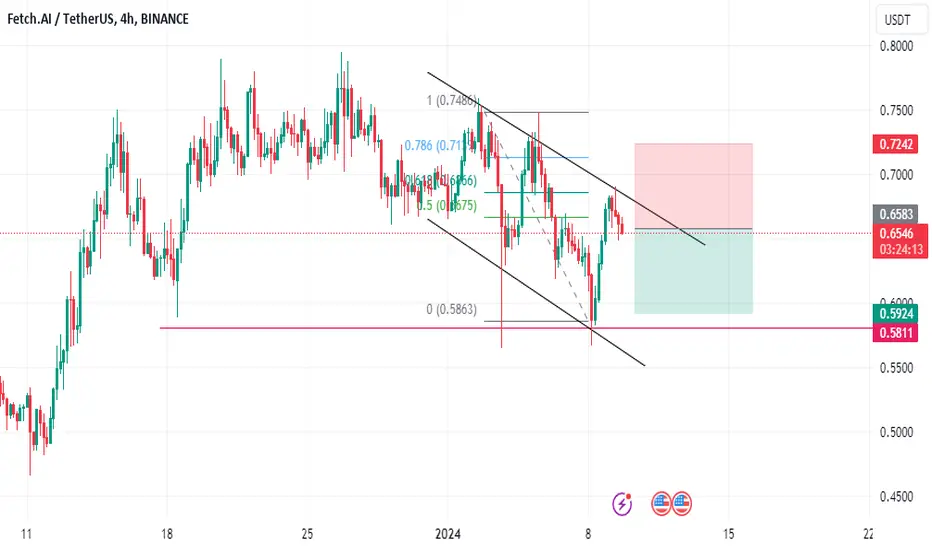
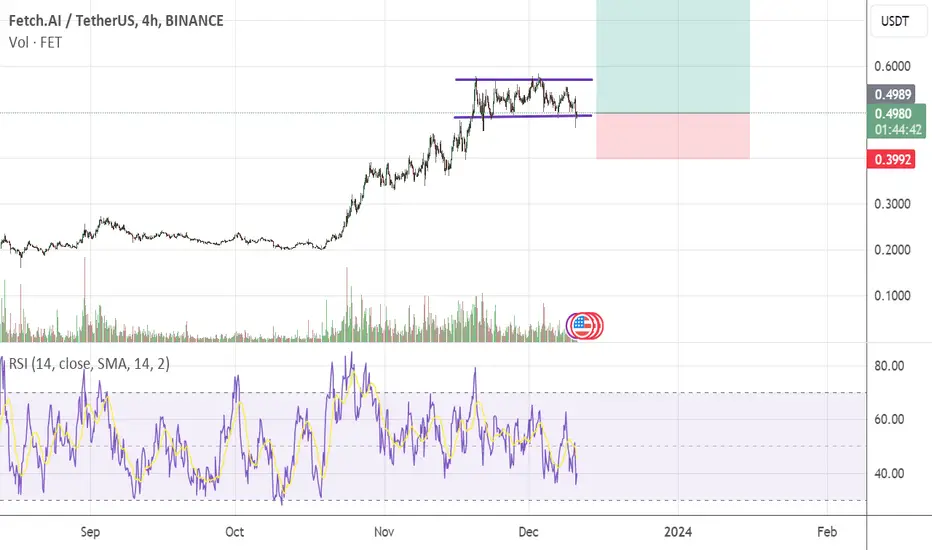
FETUSDT - Heading towards the next resistance line ^BINANCE:FETUSDT (4H CHART) Technical Analysis Update
FETUSDT is currently trading at $0.5686 and currently bouncing back from from support around 0.5358 and we expect it to hit the next resistance at around 0.6400.
Long Entry level: $ 0.5668
Stop loss: below $ 0.5206
Target 1: $0.5993
Target 2: $ 0.6400
Target 3: $ 0.7000
Max Leverage: 5x
Don't forget to keep stop loss.
Follow Our TradingView Account for More Technical Analysis Updates, | Like, Share and Comment Your thoughts.
Cheers
GreenCrypto
Fet started it's juorney to da MoonThis a combination of harmonic and smc analysis of NYSE:FET coin for the coming days in shaa ALLAH , it may be correct 💯 or may not DYOR
Targets and stop loss are shown on the chart
This just an analysis not a financial advise, take the responsibility of managing your money

FET swingNYSE:FET 0.3013$ buy zone as long as price stays above the support then bullish structure is maintained
educational purpose only
nfa

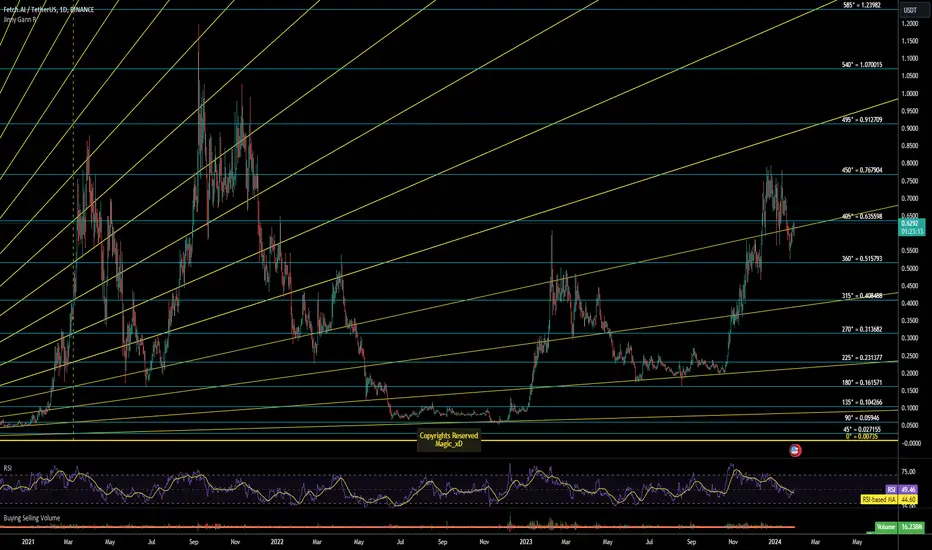
Jinny Gann Levels/Gann FanzJinny Gann Fan Levels are on the Chart possible Trendlines my WAY.
Jinny Gann Fan/Horizontal Lines Works as Support / Resistance.
Important levels for the Big Cycle on the chart.
Trade Wisely.
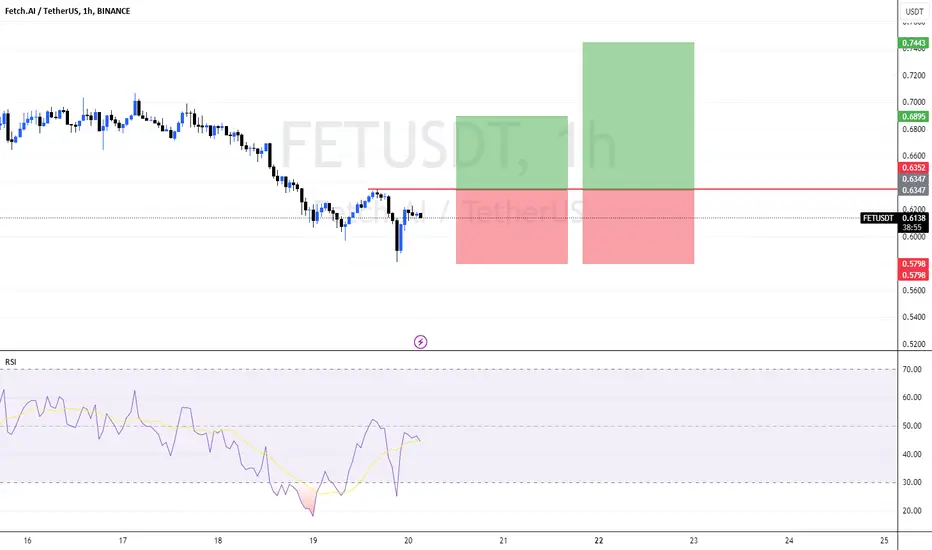
FETUSDT - BULLISH OUTLOOKFETUSDT is currently demonstrating a bullish divergence on the 1-hour (1H) time frame, indicating a potential reversal in the ongoing trend. In light of this observation, a trading strategy can be considered as follows:
Entry: Contemplate entering a long position through a buy-stop order at 0.6350.
Stop Loss (SL): Implement a risk management stop loss at 0.58 to mitigate potential losses.
Take Profit (TP): Set take-profit levels to achieve a 1:1 and 1:2 risk-reward ratio:
TP1 = 0.69
TP2 = 0.745
This trading strategy aims to capitalize on the anticipated bullish reversal signaled by the observed divergence. Traders are advised to stay vigilant for any shifts in market conditions and adjust their strategy accordingly.
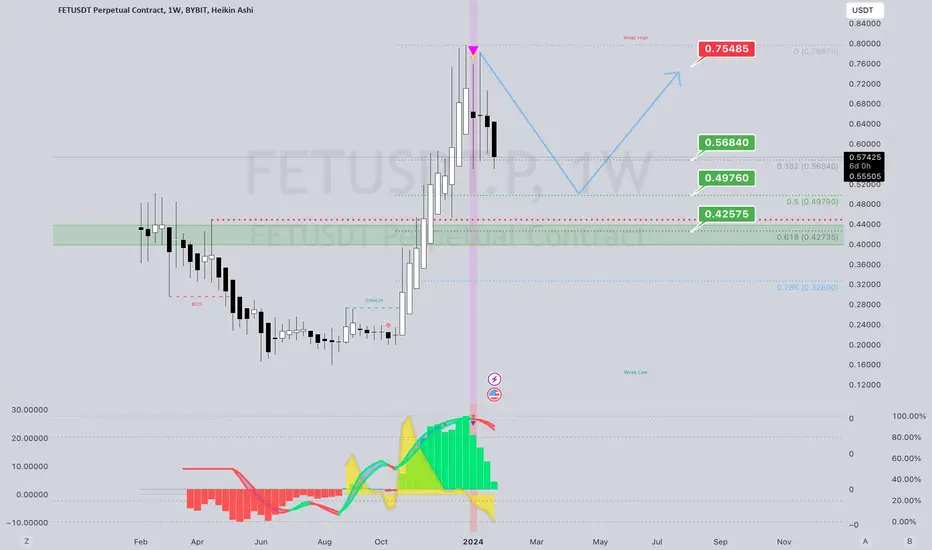
#FET to pull back to my buy zoneFetch.AI, if we get a weekly close below 0.5684, it opens the door for much lower prices.
My first target is 0.4976. I would be accumulating below 0.49 closer to 0.43 level.
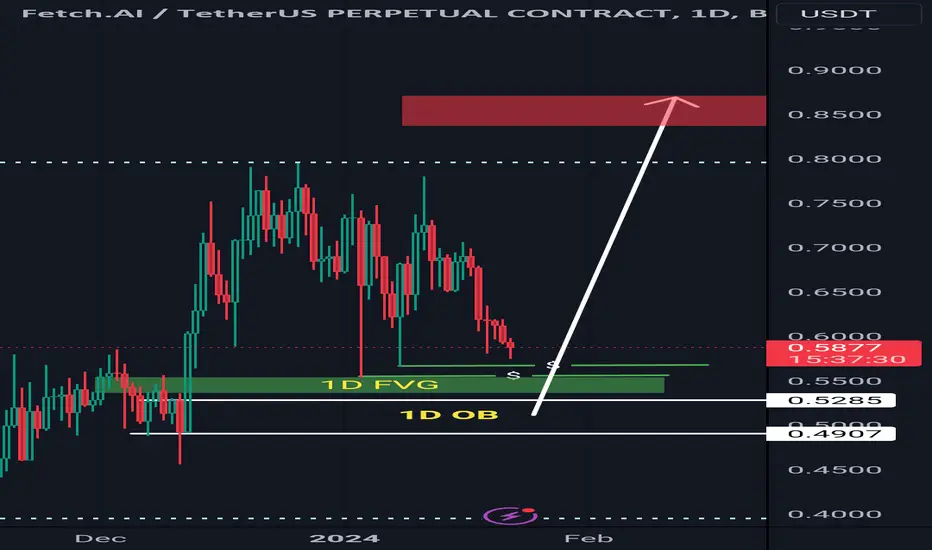
Fet daily chart FET HTF (1D) Analysis.
FET showed very good move in last month and now it's coming at the same impulsive point where it has formed Order block with daily FVG. Where we can see some Bullish Momentum.
And as given in Charts that shows $ liquidity below the WICKS which is also called SSL. Market can grab this liquidity before going up.
It's also a Midterm ( 4+ weeks) Spot Signal for You.
Buy in-between (0.52-0.55) and sell Above 0.650+.
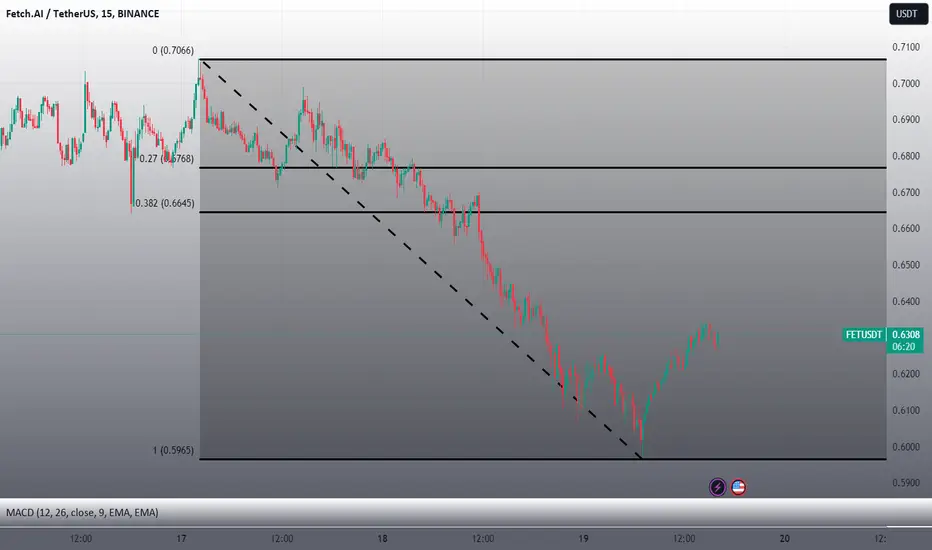
FETUSDT_N27FETUSDT
En: 0.6645-0.6768 (Two positions)
Sl: 0.7066 (1% of your balance)
Tp: 0.5965
Cancel if Tp crossed without opening
#15Min_trade
#N27
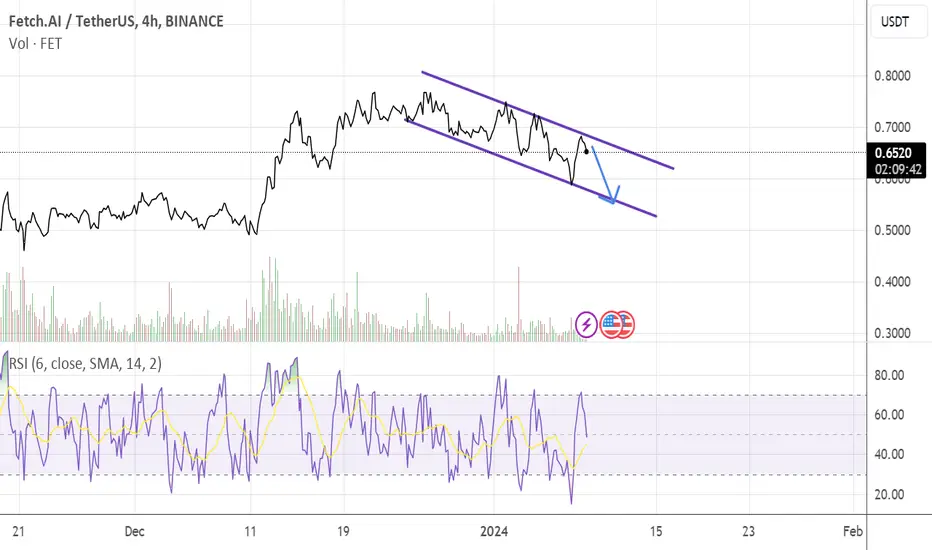
I don't like to shortI hate shorts in crypto, but this is what the action price suggest, a 0.46 price for the next weeks.

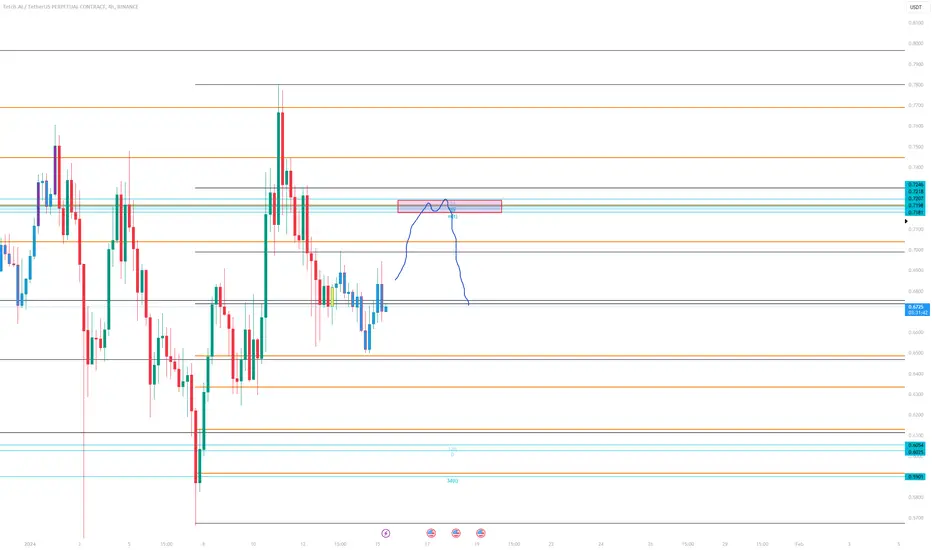
BART modeHey all! seems like we need some correction here, I can see a clear bart there, what do you think?

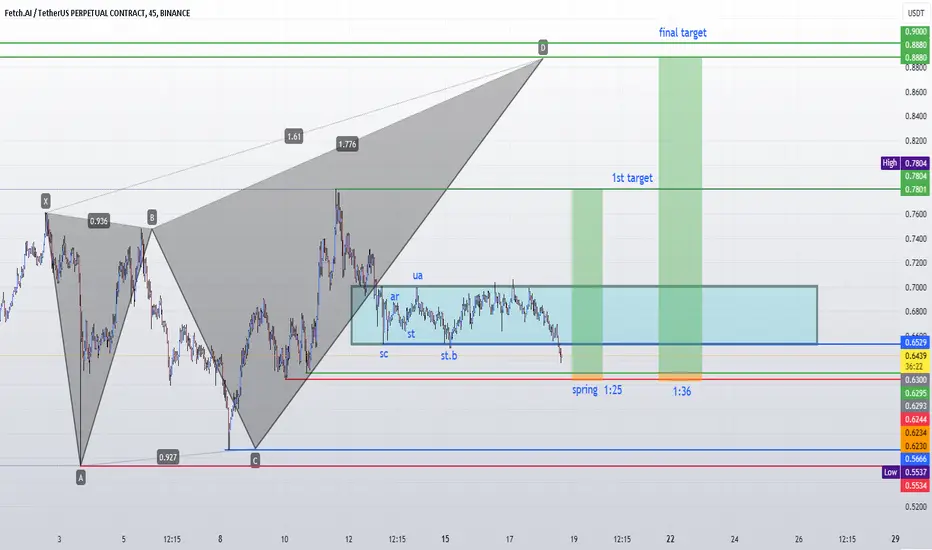
fetusdtfetusdt may complete deep harmonic crab pattern .looking for one more low here .will wait for reaction at the mentioned zone and long .we might have accumulation in play.waiting for spring.coming to the desired area and closing above in the rectangle zone will be a good sign
$FETshort aoi on fet, waiting for div and to see what the king CRYPTOCAP:BTC does. dont wanna fade this coin as its pretty strong, but i would also like to buy lower.
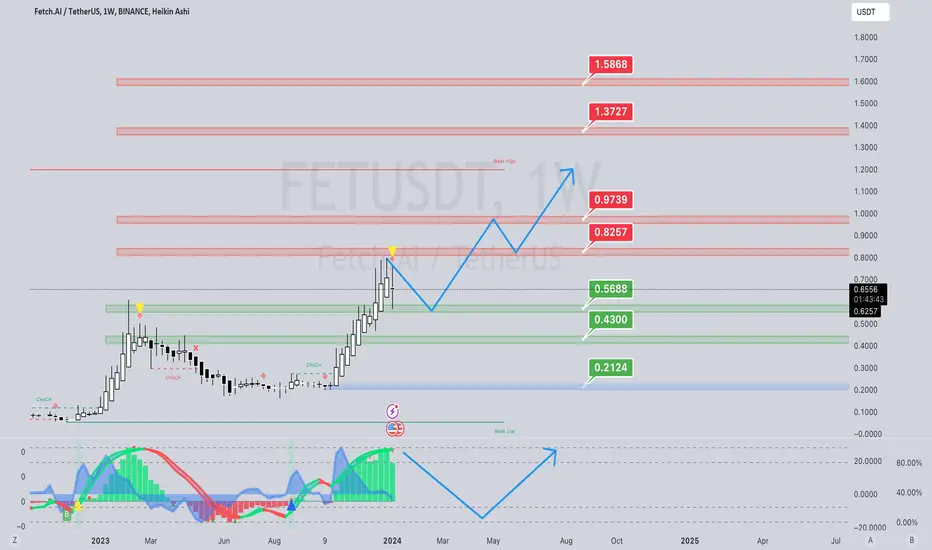
✴️ FetchAI Completes Its 2nd Major Wave (Long Correction Now)FetchAI has been doing great since late November 2022, it produced two major bullish waves while many Altcoins are yet to produce a strong one, some are still trading low near support.
This is a signal that we looked on the Bitcoin trade idea, EMA50.
➖FETUSDT can be seen touching EMA50 from above after major growth.
If we look at early December 2022, once FETUSDT moved above EMA50, it grew consistently never coming close to this level. When EMA50 was tested as support in March 2023, this confirmed a correction plus consolidation phase lasting 8 months.
The same dynamic is true again. In October, FETUSDT moved above EMA50 and never looked back, it grew safely above this level but, on the 3-January 2024, just two days ago, EMA50 was tested as support. Even though FetchAI bounced this test signals the start of a new correction phase, a long one.
This analysis is valid for Bitcoin as well as many of the major Altcoins and/or all those that already produced massive growth.
➖Prepare for the correction... Some will go down while others go up.
At this stage in the game each pair needs to be considered individually, we cannot generalize anymore.
Thank you for reading.
Thanks a lot for your continued support.
Namaste.

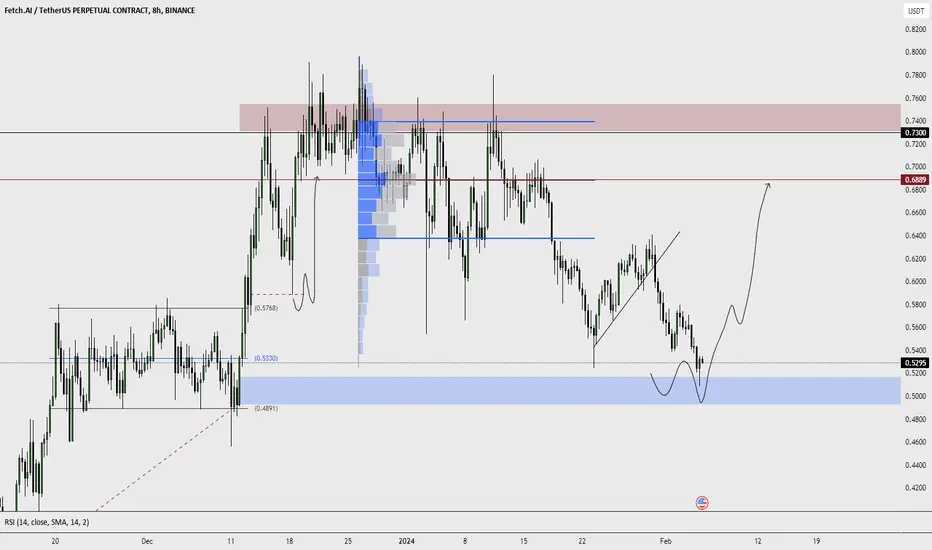
FET/USDT probability of bullish move from support?👀FET Analysis💎 Paradisers, cast your eyes on #FETUSDT, currently weaving a narrative that hints at a bullish revival from its current stronghold.
💎 Amidst the rollercoaster of market ups and downs, #FETCHAI has taken a dip but now seems to be gathering its strength at the support zone of $0.5823. Should #FET successfully anchor itself above this level, we might witness a spirited charge towards the ambitious resistance at $0.8739, painting a bullish streak in its market story.
💎 In the ever-twisting crypto realm, where unpredictability is the only constant, a strategy that dances to the market's dynamic tune is essential. If #FET finds itself in a tussle to maintain its stance in this crucial zone, it's time for a strategic shuffle.
💎 Enter Plan B: a tactical shift that eyes a bullish resurgence from a deeper realm of support at $0.4635. This level is a critical watchpoint, as a slip below could unravel a narrative twist, possibly steering #FET towards a bearish territory. Stay alert and nimble, Paradisers, as we navigate the intriguing odyssey of the #FET market.

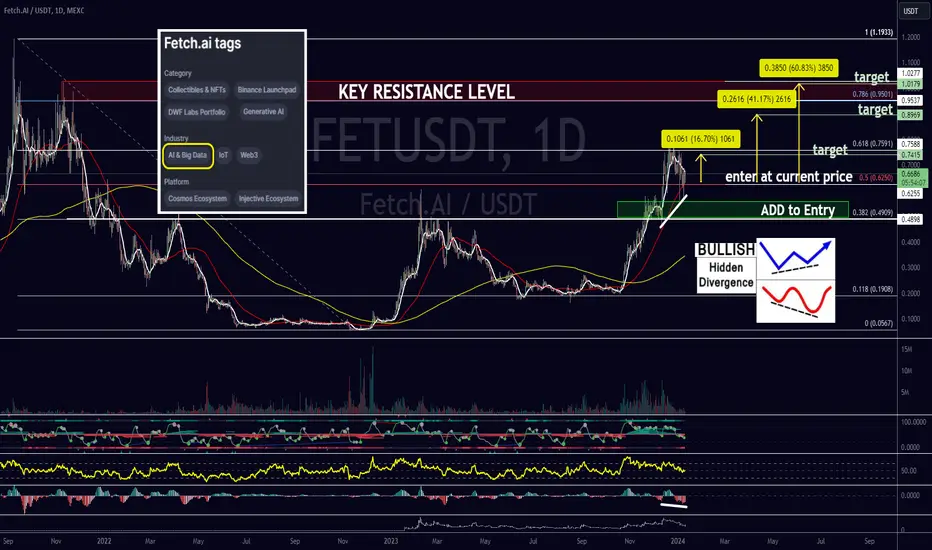
FET with bullish hidden divergenceFET with bullish hidden divergence on the daily time frame
with lower entry on chart
this is a great coin to hold long term but short term targets on chart
This is for ENTERTAINMENT purpose Only.
Not Financial Advise
Always DYOR ( do your own research )
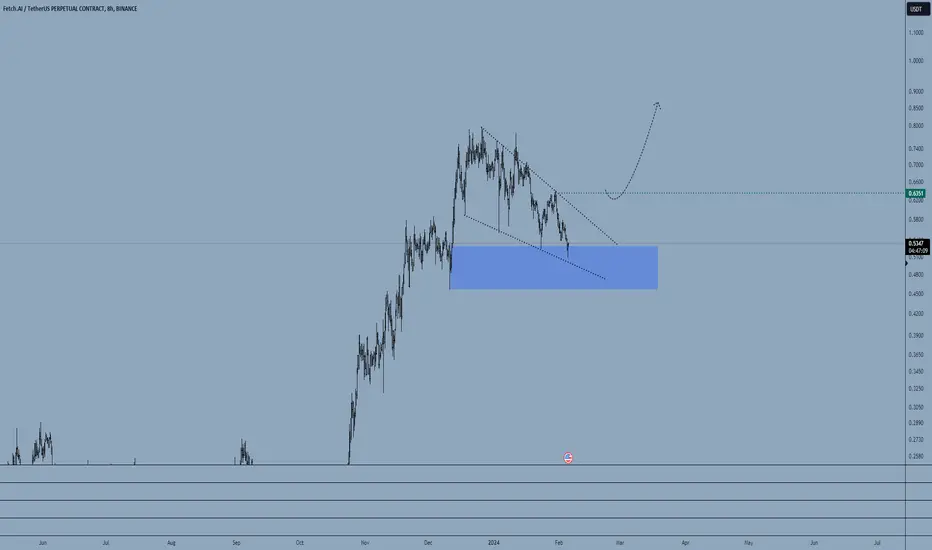
Entry pointThis is a consolidation channel, let's see if we can breake it to go to 0.8-1 dollars from here, make sense to enter in a long position, and dca into NYSE:FET
Entry: 0.5 ish
TP1: 1$
TP2: 3$
TP3: 4$
Short until..Hey! some update for this GEM! still the healthy correction is in place, I'll be waiting a reversal pattern or some sideways movements to re-enter. Seems 0.55 can be a good support to land
Fet long set up - micro analysisFet on the way to hit the 2.618 fib level after the btc pump.
I predict it retaces back down to the 0.618 fib level and charging it way back up.
Entry, stop loss, and both tp on graph.
Note: make sure to change entry to stop, after tp1 hits.

$FET - COSMOS Ecosystem Analysis SeriesI will post a series of longer timeframe technical analysis on Cosmos Ecosystem coins.
Here is the next project in my long term buy list: FET - Fetch.AI. I will be adding more FET on the dips to my buy zones shown on the chart.
Fetch.AI, represented by its native token FET, is a unique and innovative project within the Cosmos ecosystem, blending blockchain technology with artificial intelligence (AI). Here are some key aspects of the Fetch.AI project:
AI-Driven Blockchain Network: Fetch.AI is pioneering in integrating AI with blockchain technology. The platform uses AI to automate complex tasks, optimize trading, and improve efficiency in various industries, making it a trailblazer in the blockchain space.
Smart Ledger Technology: The project utilizes a 'smart ledger' that can support a high number of transactions and complex computational tasks, which is crucial for AI operations and large-scale industrial applications.
Autonomous Economic Agents (AEAs): Fetch.AI introduces the concept of AEAs, which are digital entities that can perform tasks autonomously. These agents can negotiate deals, make decisions, and interact with both digital and real-world environments, offering a new paradigm for automation and AI services.
Decentralized and Scalable: The platform is designed to be highly decentralized and scalable, addressing some of the inherent challenges in the traditional blockchain systems. This scalability is vital for supporting the extensive data and computation needs of AI applications.
Energy-Efficient Consensus Mechanism: Fetch.AI uses a novel consensus mechanism that is more energy-efficient compared to traditional proof-of-work systems. This eco-friendly approach is increasingly important in the context of global energy concerns.
Cross-Chain Interoperability: As part of the Cosmos ecosystem, Fetch.AI benefits from cross-chain interoperability, allowing seamless interaction with other blockchain networks, which is crucial for widespread AI and blockchain adoption.
Real-World Applications: Fetch.AI targets a wide range of real-world applications, from supply chain and logistics to smart cities and energy management, demonstrating the practical utility of combining AI with blockchain.
Community-Driven Development: The project places a strong emphasis on community involvement, with FET token holders having a say in governance decisions, ensuring that the development aligns with the community's needs and interests.
Strong Partnerships and Collaborations: Fetch.AI has established various partnerships and collaborations across different industries, which not only validates its technology but also accelerates its application in real-world scenarios.
Innovative Marketplace Solutions: The platform is working towards creating decentralized marketplaces where AEAs can autonomously negotiate and trade services, goods, and information, paving the way for a more efficient and automated economy.
Fetch.AI stands as an example of how blockchain and AI can be synergistically combined to create innovative solutions that address real-world challenges, making it a source of inspiration in the Cosmos ecosystem and the wider tech community.