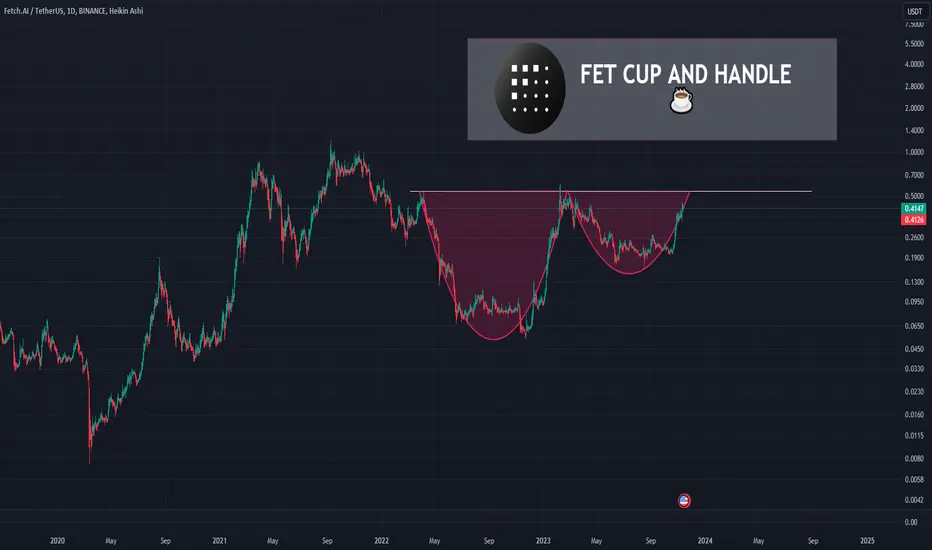
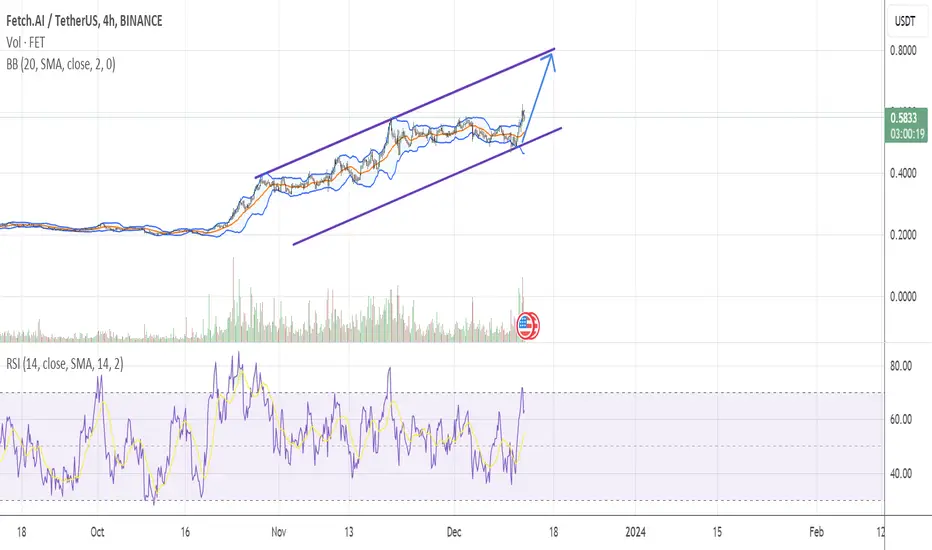
Where is the FET target?We have a cup and handle pattern on the chart. We have rising CHs and the dynamic resistance is broken.
The upward momentum of the price is also good and strong. I specified two TPs that are FET targets.
You should always manage risk because financial markets are not certain and are based on probabilities.
For risk management, please don't forget stop loss and capital management
When we reach the first target, save some profit and then change the stop to entry
Comment if you have any questions
Thank You
FETUST trade ideas
FET/USDT LongT = 4.30
cup and handle price pattern
A cup and handle is a technical chart pattern that resembles a cup and handle where the cup is in the shape of a "u" and the handle has a slight downward drift.
A cup and handle is considered a bullish signal extending an uptrend, and it is used to spot opportunities to go long.
Technical traders using this indicator should place a stop buy order slightly above the upper trendline of the handle part of the pattern.
The pattern was first described by William J. O'Neil in his 1988 classic book on technical analysis

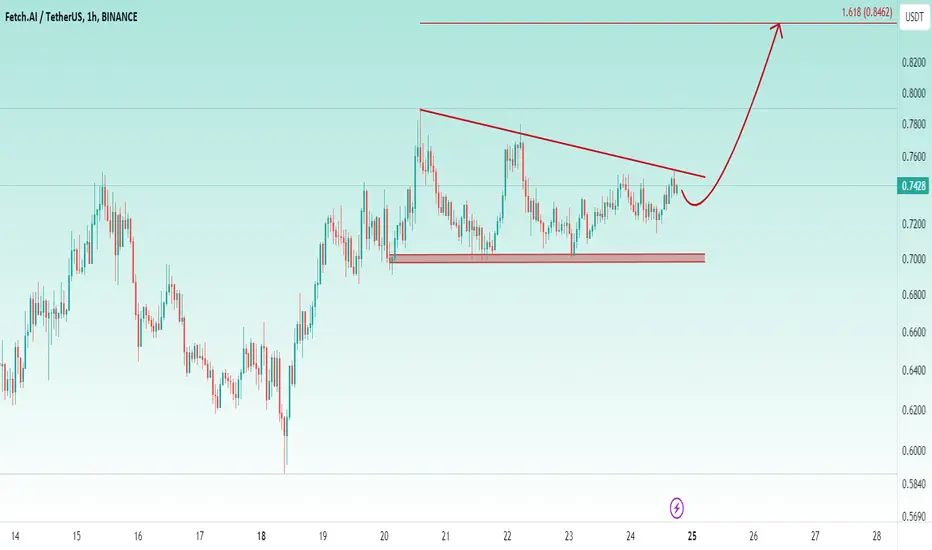
FET Price About To Breakout Again 👉 The Main Pattern Formed At The Chart Is Ascending Triangle Which Currently The Price Playing Below The Trend Line ,I Expect a Breakout And Start a New Bull Rally To The 0.85$
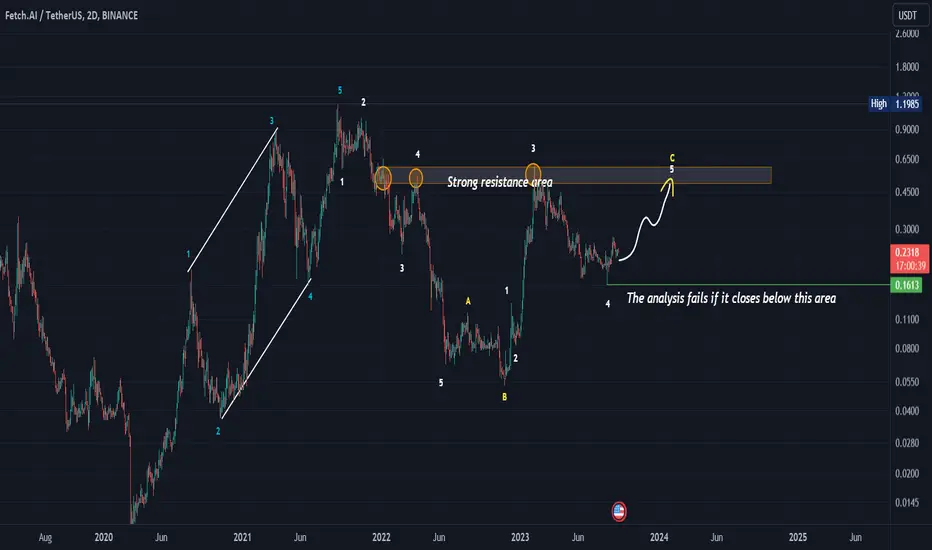
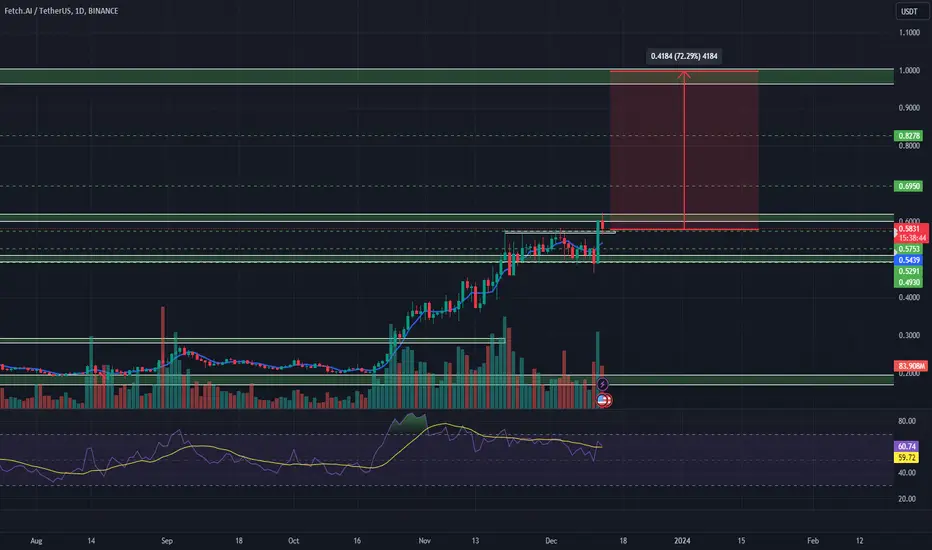
Update FETUSDTIt is possible that we are at the bottom of wave 4 out of five upward waves, and there is a final fifth wave remaining that will return to test the last peak again, and from there it will just go up.. All the data is on the chart.
Note: The analysis fails if it closes below an area 0.163 usdt
Please clarify that I am helping you with my point of view, which may be right or wrong, and see my previous analyzes of many currencies and forex in order to judge the owner of this analysis with a more accurate look
Good luck
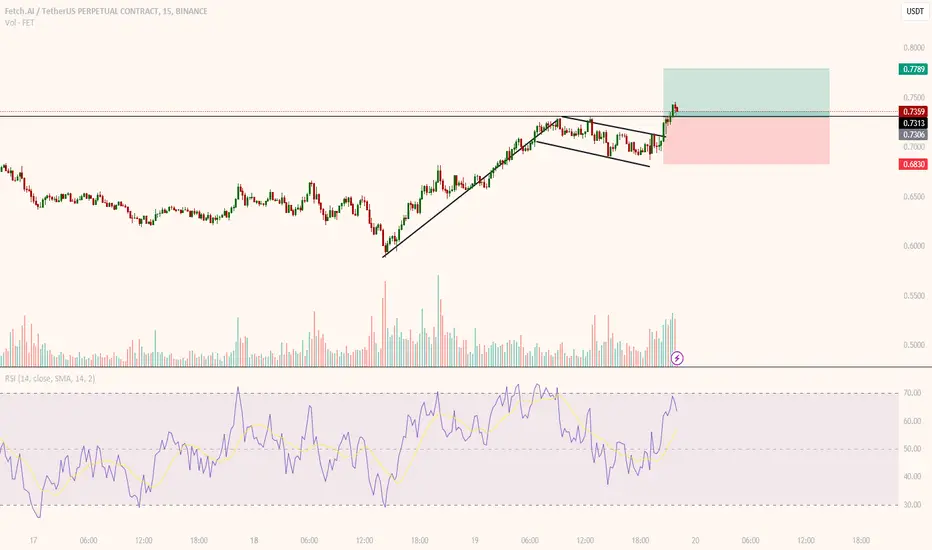
FETUSDT Bullish Flag Continuation PatternBINANCE:FETUSDT making a bullish flag on the 15 min timeframe.
Entry, stop loss and target price as shown on the chart.
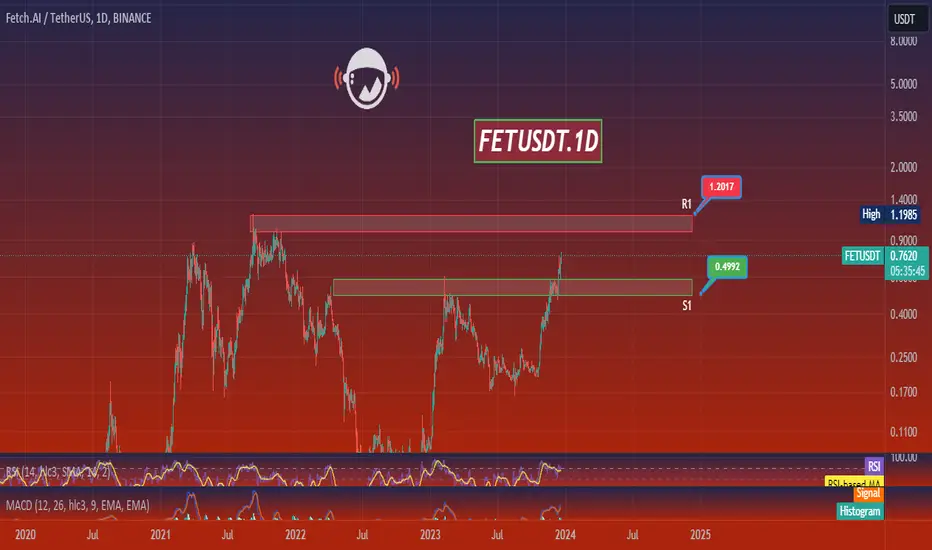
FETUSDT.1DBased on the provided market data, the currency FETUSDT appears to be in an overall bullish trend.
On a 4-hour timeframe, the Relative Strength Index (RSI) is at 72.54, which is above the typical overbought threshold of 70, suggesting that the asset may be overpriced and could experience a price correction. The Moving Average Convergence Divergence (MACD) is at 0.0271, which is positive, indicating the short-term momentum is greater than the long-term momentum and thus supports the bullish trend. The Bollinger Band (BB) is at 0.7801, which is above the current price, suggesting that the price is in the lower range, and there might be a potential for price increase.
On a daily timeframe, the RSI is at 75.12, which is also above the overbought level, indicating a potentially overpriced asset. The MACD is at 0.06040, which is positive and supports the bullish trend. The BB is at 0.7574, which is slightly below the current price, indicating the price is in the upper range and there might be a slight decrease.
On a 7-day timeframe, the RSI is at 85.65, which is significantly above the overbought level, suggesting the asset is highly overpriced and a price correction is quite probable. The MACD is at 0.097, which is positive, indicating a bullish trend. The BB is at 0.7609, which is slightly above the current price, suggesting the price is in the lower range and there might be an increase.
Overall, the asset appears to be in a bullish trend but also seems to be overbought, which could lead to a price correction. Therefore, it could be a good idea to wait for a potential price drop before entering a long position. However, this analysis is based on historical data and does not guarantee future performance. It's always recommended to consider other market factors and your risk tolerance before making an investment decision.
FETUSDT- In Bullish Continuation PatternFETUSDT is in bullish continuation as it making an ascending channel and also there is no divergence present.
🚀 FET/USDT - Gem Coin for Bull Run 🌟Strategy:
Consider FET as a gem coin for the upcoming bull run.
Adopt a strategy of buying in every dip and holding in the spot.
Buy-in Range:
Accumulate in the range of %0.65 to $0.68 - $0.48 to $0.50.
Targets:
🎯 $3.5
🎯 $5.5
Caution:
Stay informed about the market conditions.
Be prepared to adapt to changing trends.
Potential Upside:
If the strategy aligns with the bull market, reaching $3 and $5 targets could be achievable.
🔄 Stay Watchful:
Remember, cryptocurrency investments carry risks. Make informed decisions and stay updated! 📈💹 #FET #USDT #CryptoInvesting 🚀📰
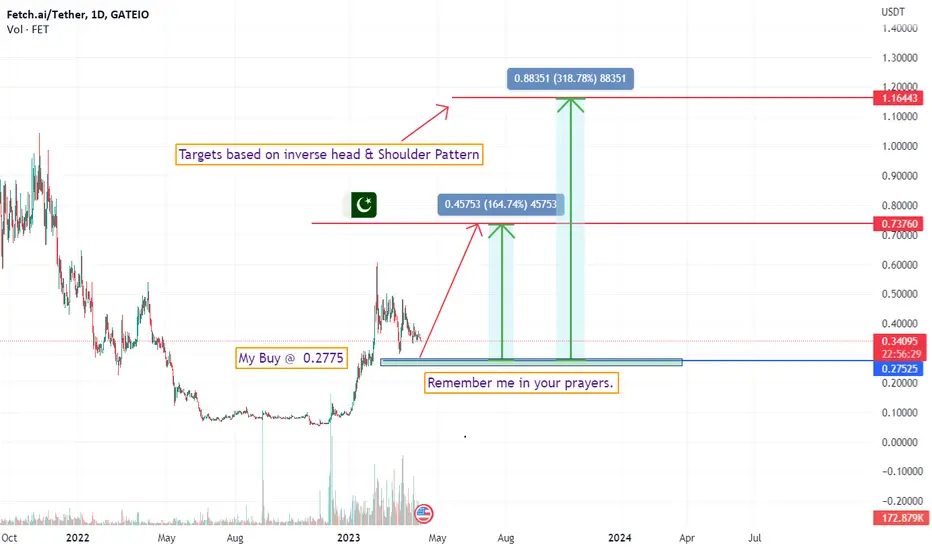
FETUSDT 165% Pump IncomingThis Analysis is based on FIb levels and inverse head and shoulder patter.
I wish you guys best of luck.
Continuing the upward trend(FET)❤️❤️Thanks for boosting 🚀 and supporting us!
📈For less risk, you can enter failure confirmation and pullback and hit the trend line.
📊 (Buy) : 0.5906
🔴 Stop Loss : 0.5234
🎯 Take Profit : 0.7028 - 0.8328
🔗 For more communication with us, In the footnote and send a message in TradingView.
👨🎓 Experience and Education: Our trading team has five years of experience in financial markets, especially cryptocurrencies.

FETUSDT Looks bullish FET has gone above resistance and is currently trying to break the 0.6 cents. if it breaks and closes above a move to 1+ seems plausible
FET/USDTNYSE:FET is one my largest spot holding bags as a long term positions but right now it has a bearish pattern, the red line must hold and the white line must breakout to invalidate the bearish pattern, the good news is around 39 and 40 cents is a great support level and can reverse there

FET SHORT H4Market correction is not over yet - current recovery might be a trap
I'm expecting deeper correction to clear overleveraged positions before further up.
FET is currently deviating being close to trend reversal after completed impulsive wave.
Good luck.

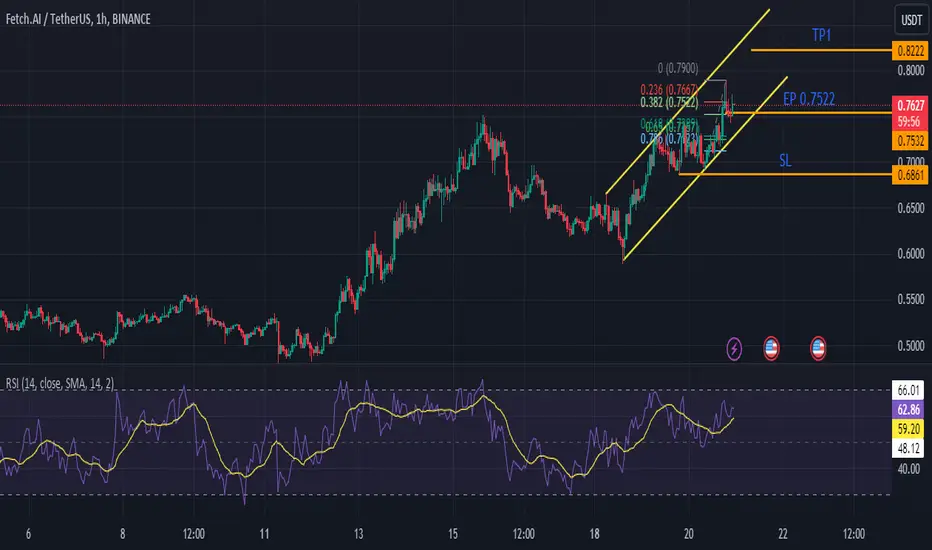
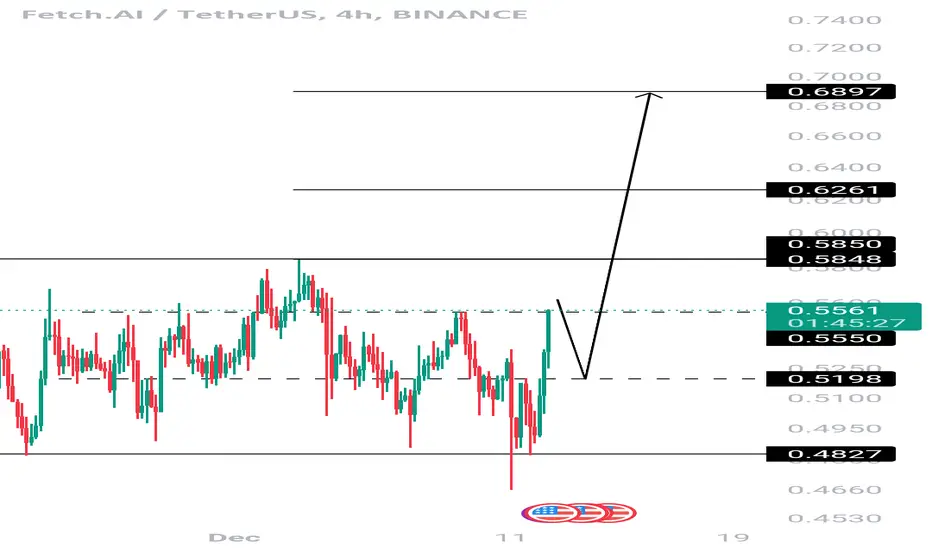
FETUSDT - LONG4H Uptrend
No divergence on RSI
Blue lines are rectangle chart pattern from which price has broken out recently.
Current trade:
Entry: 0.5705
SL: 0.4529
TP: 30% offload @ 0.6881

FET CUP AND HANDLE BREWING ☕In this logarithmic chart of BINANCE:FETUSDT , a possible cup and handle pattern could be formed and materialized, citing a potential continuous bullish movement of the coin. Full technical details to be followed in this idea thread below.
Happy trading everyone!
Diagonal movementThis coin looks very atractive! hehe this movement have a nice structure, next target to look:
0.8$
let's trade it!
Fet Short Term Plan Fet/usdt
Looking strong here :
Breaking trendkine resistance
Expecting price to rise 10-20% from here
Not financial advice
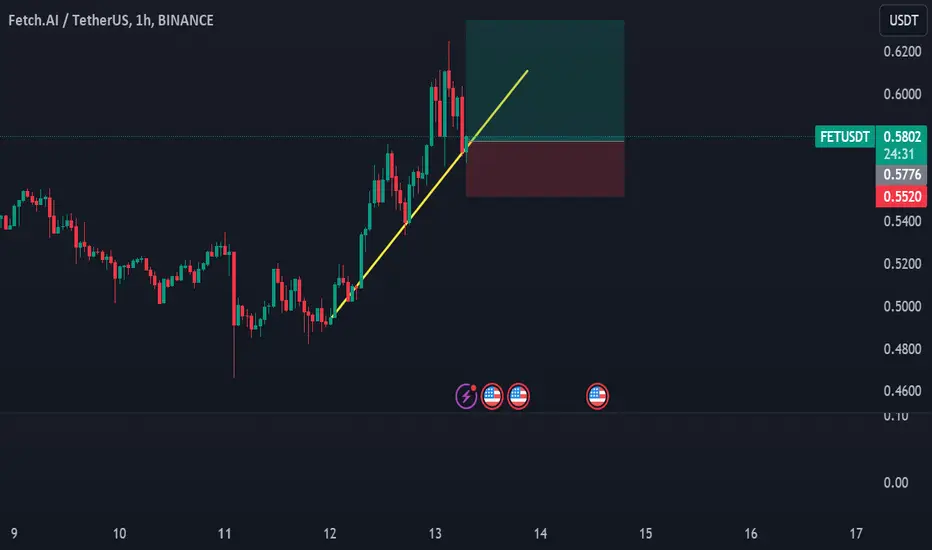
FET Good to scalpFET coin is trading on his short term trendline. It's good for a quick scalp on hourly timeframe
FET/USDT longSo the structure here is bullish. First test failed, longs liquidated, shorts trapped.
1st target: high onscreen
2nd: the daily high (pink line)
3rd: 0.67 or higher.
Good luck

FETUSDT Bullish scenario FET is consolidating above support and is potentially looking at a bullish run to 1+

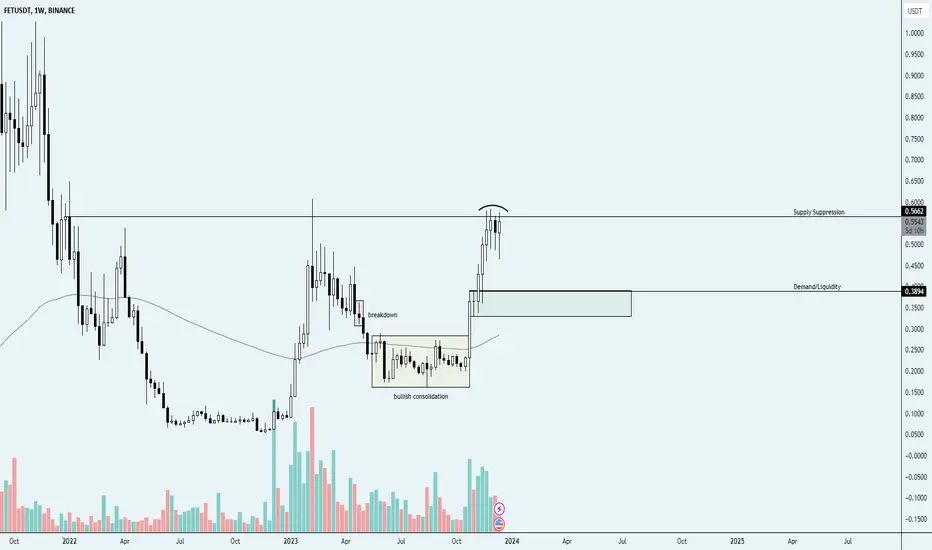
$FET FetchAi Liquidity Zones My current thoughts on FET are that we sweep liquidity in green, unless the above supply level is confidently flipped. We have a rounding off top (3rd attempt to break this level) with weakness showing.
Liquidity, untapped, remains below in green if it cannot push past this resistance area soon.
Another great opportunity to accumulate for the long term if we get green imo.
V
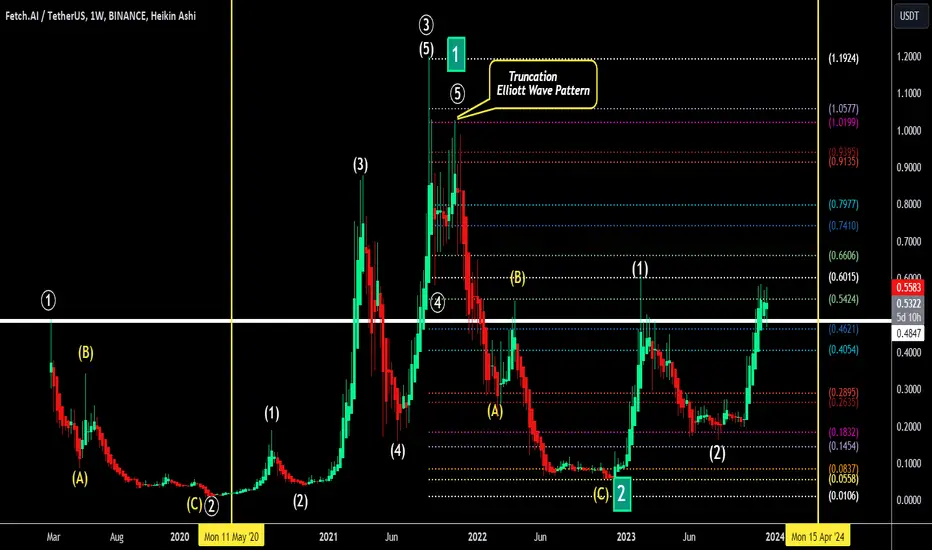
FET/USDT Elliott Wave CountFET/USDT Weekly chart , Elliott Wave Count.
.................................................................................................................
We are not registered or licensed in any jurisdiction whatsoever to provide investing advice or anything of an advisory or consultancy nature.
and are therefore are unqualified to give investment recommendations.
Always do your own research and consult with a licensed investment professional before investing.
This communication is never to be used as the basis of making investment decisions, and it is for entertainment purposes only.