FET Imminent Rise, Easy 333% To 666% Profits PotentialThis is a time sensitive publication. I will explain my thinking and support my conclusions based on TA.
How are you doing in this wonderful day?
Bitcoin is looking good and the Altcoins are looking better by the day. The Cryptocurrency market is heating up and set to grow long-term.
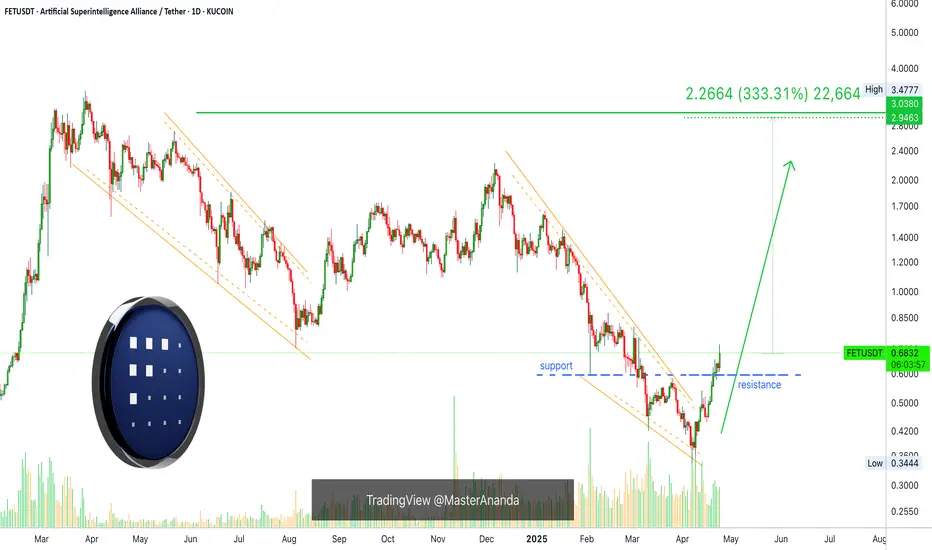
» Imminent, FETUSDT is preparing for a strong rise next.
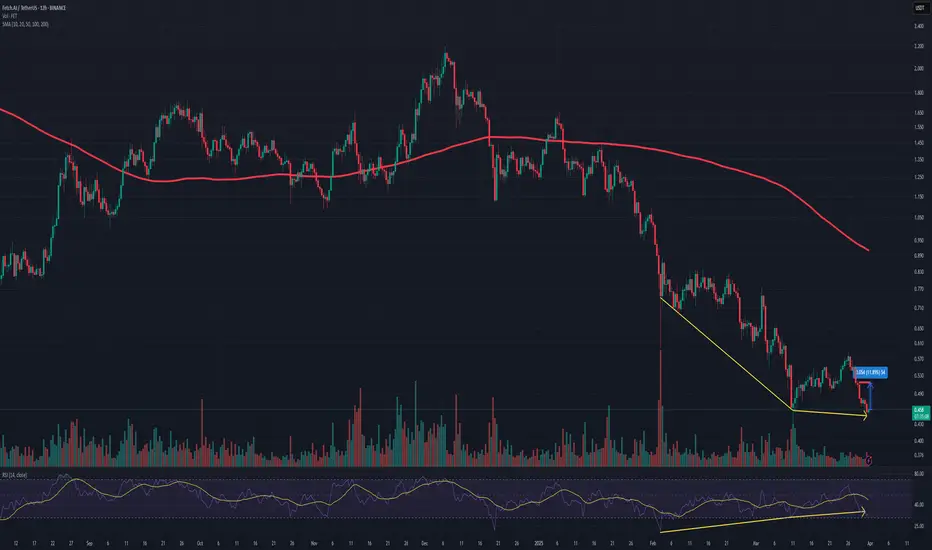
Here is the thing, the downtrend has been broken. This of itself reveals and confirms a bullish bias.
Next, the 3-Feb. low resistance has been conquered and this is a major development. This is the short-term baseline. Above this level FETUSDT is ultra-bullish.
Finally, The bottom pattern is a classic, iH&S, and supported with really high volume. All these signals are strong, confirmed and good.
Artificial Superintelligence Alliance is set to grow. It is already growing, but this growth will soon speed up. Bullish momentum will manifest and a strong bullish wave will develop.
» First, a 333% target is easy followed by additional growth.
Namaste.
FETUST trade ideas
#FET/USDT#FET
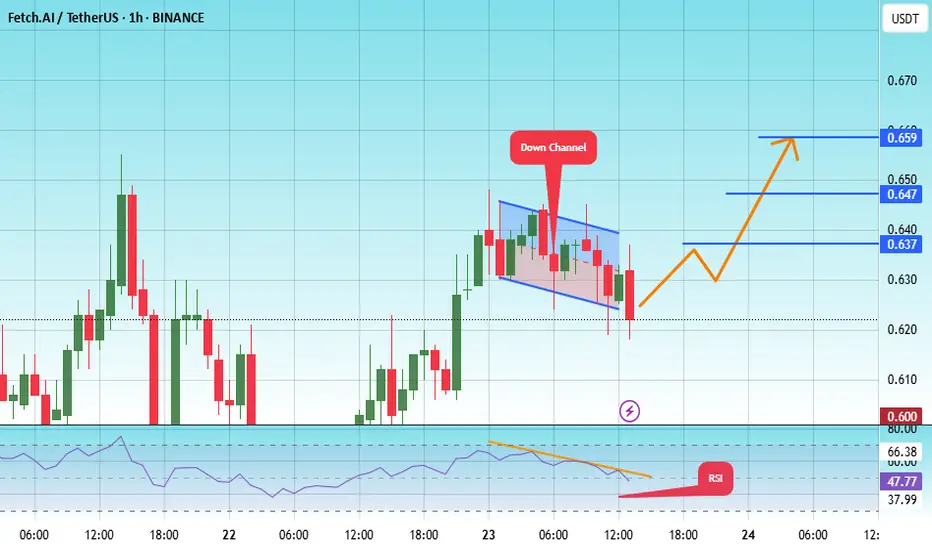
The price is moving within a descending channel on the 1-hour frame, adhering well to it, and is heading for a strong breakout and retest.
We are experiencing a rebound from the lower boundary of the descending channel, which is support at 620.
We are experiencing a downtrend on the RSI indicator, which is about to break and retest, supporting the upward trend.
We are looking for stability above the 100 moving average.
Entry price: 0.625
First target: 0.659
Second target: 0.647
Third target: 0.659
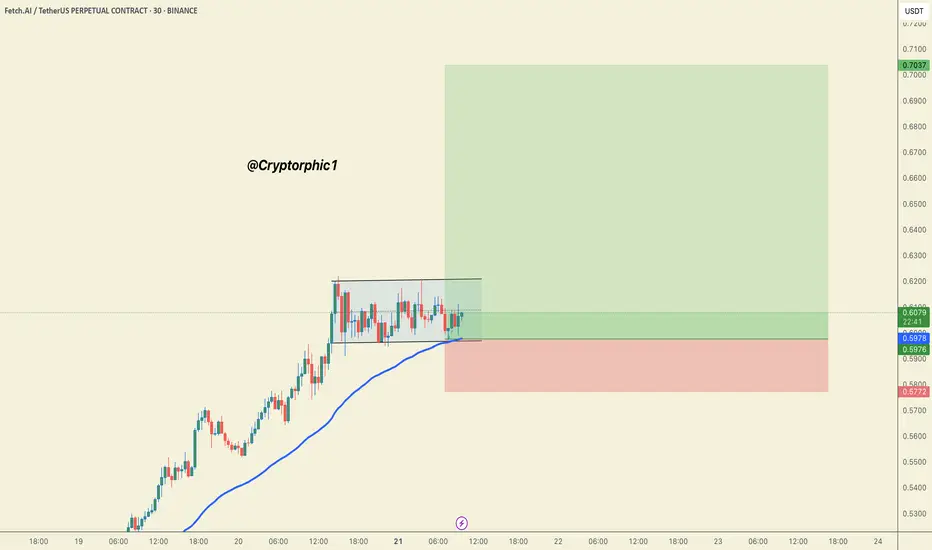
#FET/USDT Futures Trade Setup!#FET looks good if you missed.
Two options to enter:
1. You can accumulate .5869 to .6080
2. Wait for the US Open and buy at CMP with confirmations.
Targets : .6377 .6522, .6755, .6838 and .7021
SL .5772
Dyor, NFA
Do hit the like button if you want me to post more setups like this.
Thank you
#PEACE
FET/USDT - Trendline Breakout (22.04.2025)The FET/USDT Pair on the M30 timeframe presents a Potential Selling Opportunity due to a recent Formation of a Breakout Pattern. This suggests a shift in momentum towards the downside in the coming hours.
Possible Short Trade:
Entry: Consider Entering A Short Position around Trendline Of The Pattern.
Target Levels:
1st Support – 0.553
2nd Support – 0.516
🎁 Please hit the like button and
🎁 Leave a comment to support for My Post !
Your likes and comments are incredibly motivating and will encourage me to share more analysis with you.
Best Regards, KABHI_TA_TRADING
Thank you.

FET 30% PROFIT DONE,FETUSDT was shared last week, check previous week chart. It has done 30% pump from last few days.
FET LONG/BUY SETUPHello, TradingView community and my subscribers, please if you like ideas do not forget to support them with your likes and comments, thank you so much and we will start a LONG/BUY outlook on #FETUSDT.P explained

FET/USDT – Inverse Head & Shoulders BreakoutJoin our community and start your crypto journey today for:
In-depth market analysis
Accurate trade setups
Early access to trending altcoins
Life-changing profit potential
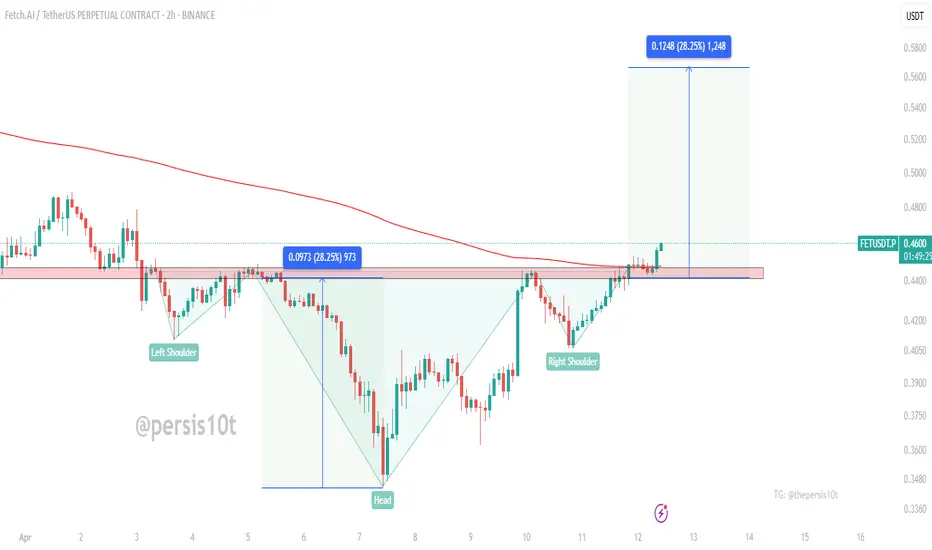
FET has formed a classic Inverse Head and Shoulders pattern on the 2H timeframe. The neckline has been broken with notable bullish momentum, confirming the breakout.
Key observations:
Pattern: Inverse Head & Shoulders
Neckline breakout at approximately $0.44
Projected measured move targets around $0.57
Current price trading above the breakout zone, showing strength
A retest of the neckline followed by a successful bounce would further confirm bullish continuation. Holding above the $0.44-$0.45 zone is key for the momentum to sustain.
If you find this analysis helpful, please hit the like button to support my content! Share your thoughts in the comments, and feel free to request any specific chart analysis you’d like to see.
Happy Trading!!
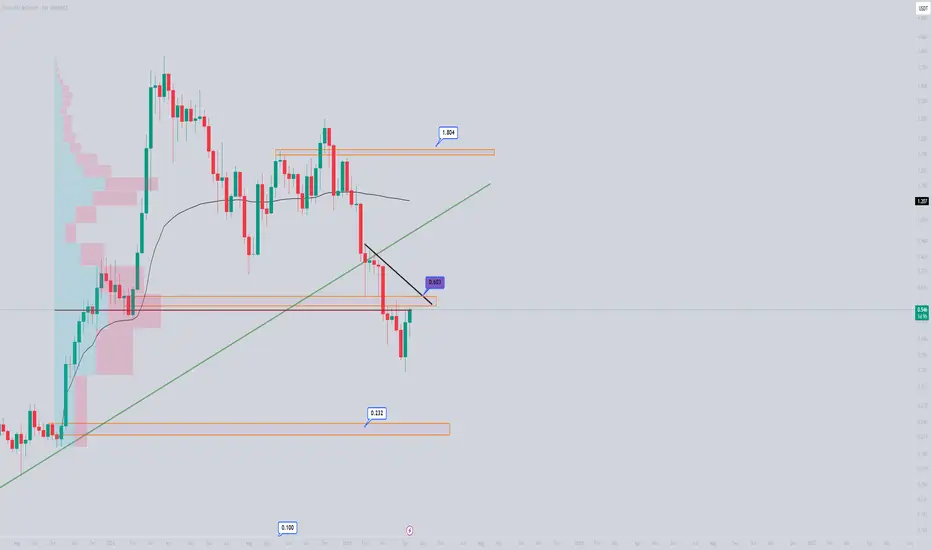
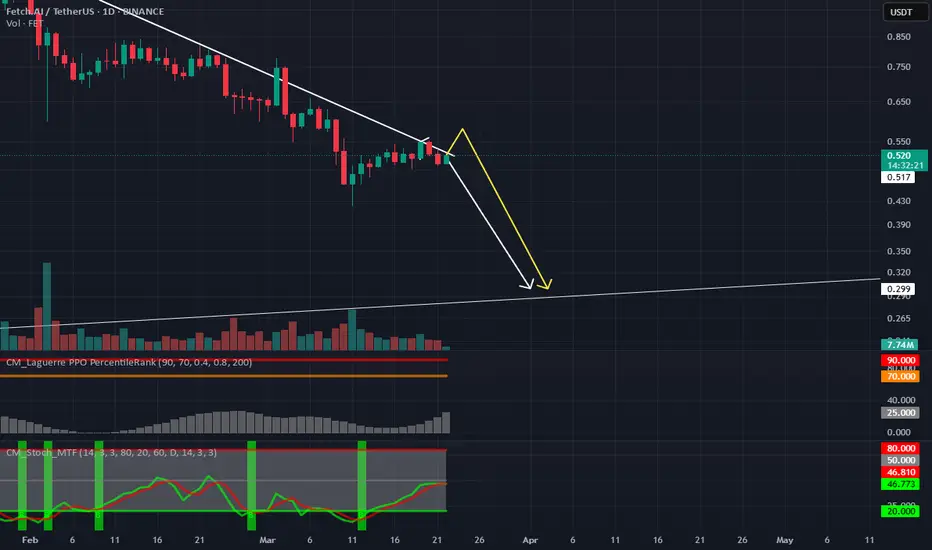
FETUSDTOn the weekly chart, there is a clear bullish guard, but on the daily chart, we have a lower low and high, which is confirmation of the downtrend. If the trend breaks and stabilizes above the 0.60 range and a higher low and high is observed on the daily chart, we can have confirmation of the uptrend.
FETUSDT 1D AnalysisFET ~ 1D Analysis
#FET Buy after successfully penetrating this resistant line with a short -term target of at least 10%+ from here.
#FET/USDT#FET
The price is moving within a descending channel on the 1-hour frame, adhering well to it, and is heading for a strong breakout and retest.
We are seeing a bounce from the lower boundary of the descending channel, which is support at 0.477.
We have a downtrend on the RSI indicator that is about to be broken and retested, supporting the upward trend.
We are looking for stability above the 100 moving average.
Entry price: 0.500
First target: 0.513
Second target: 0.529
Third target: 0.550

FETUSDT Macro-Analysis – Cyclical Patterns in a Long channelJoin our community and start your crypto journey today for:
In-depth market analysis
Accurate trade setups
Early access to trending altcoins
Life-changing profit potential
Let' analyse FETUSDT:
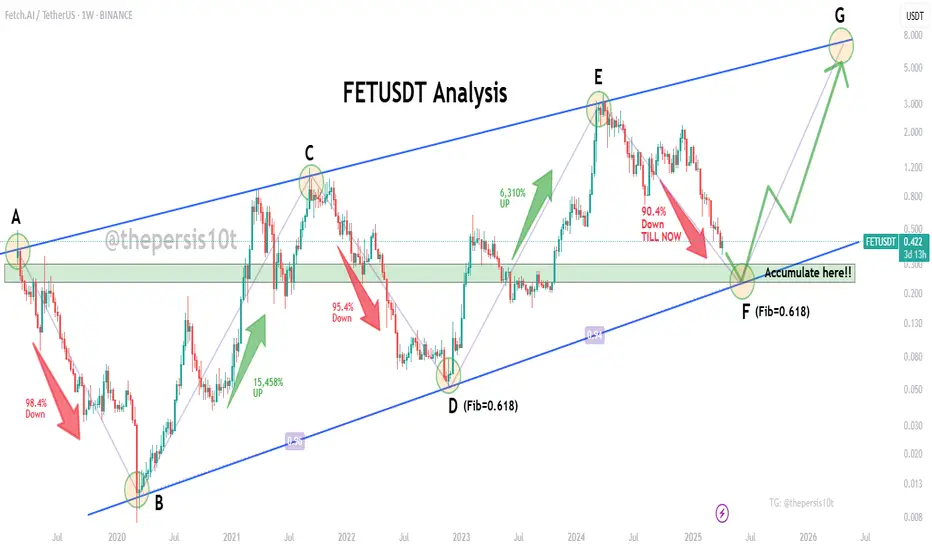
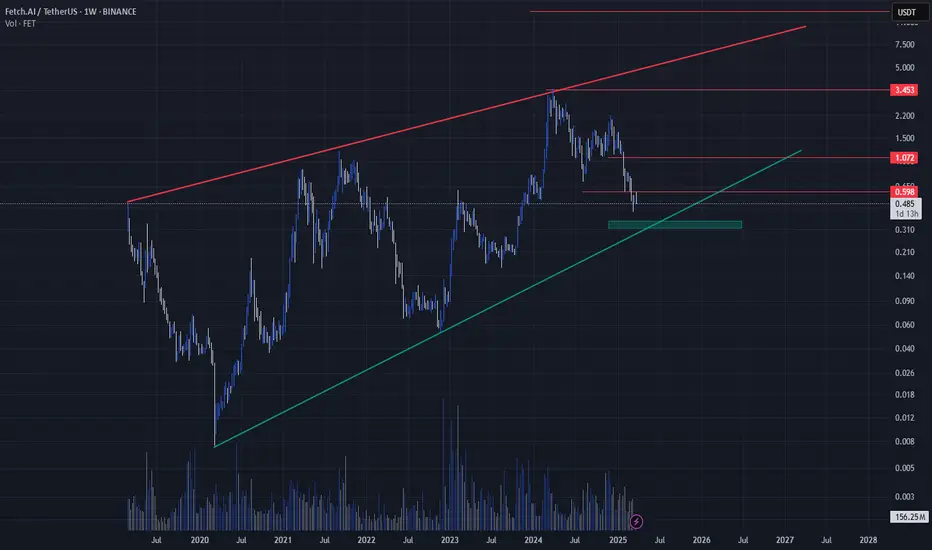
FET is currently moving within a clearly defined ascending channel, visible on the weekly timeframe. This structure has guided price through several major boom-bust cycles, all forming within the same parallel boundaries—providing a strong technical roadmap for long-term accumulation and exit strategy.
Historical Cycle Breakdown:
A to B: 98.4% drop
B to C: 15,458% rally
C to D: 95.4% drop
D to E: 6,310% rally
E to F (current): 90.4% drop so far
The current dump from E to F aligns perfectly with the Fibonacci 0.618 retracement level — just like the historical dumps to points B and D, which also bottomed at the 0.618 zone before staging explosive rallies.
Point F also coincides with the lower boundary of the long-term ascending channel, a region that has historically offered exceptional risk-reward accumulation zones.
This confluence of channel support + fib retracement makes Point F a technically strong zone for smart accumulation.
Accumulation levels:
$0.30 to $0.234
If you find this analysis helpful, please hit the like button to support my content! Share your thoughts in the comments, and feel free to request any specific chart analysis you’d like to see.
Happy Trading!!
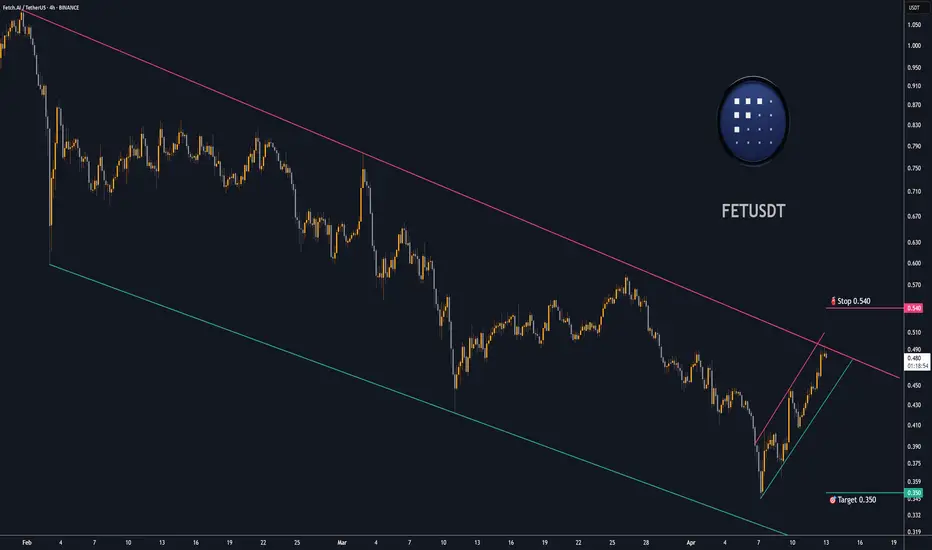
Trading opportunity for FETUSDTBased on technical factors there is a Sell position in :
📊 FETUSDT
🔴 Sell Now
🪫Stop loss 0.540
🔋Target 0.350
📏 R/R 2,3
💸RISK : 1%
We hope it is profitable for you ❤️
Please support our activity with your likes👍 and comments📝
FET Swing Long SetupThe major liquidity sweep of FET is completed, I'll be lloking at a breakout of the resistance zone at 0.51, secondly a successful retest of the resistance turned into support.
Placing my limit long orders at 0.51 to 0.43 area, targeting the HTF liquidity zone and major resistance at 1.05, an easy Stoploss just below the HTF liquidity sweep at 0.32.

FET Ready For Re AccumulationAfter a common ABC retrace into the 50-61.8% area since its last low prices are approaching its trend line. FET has already seen major gains this cycle along with the merger of agix and ocean.
Current Trading Plan
Begin to re accumulate and watch crypto market as a whole for potentialy one more push to the upside this cycle.
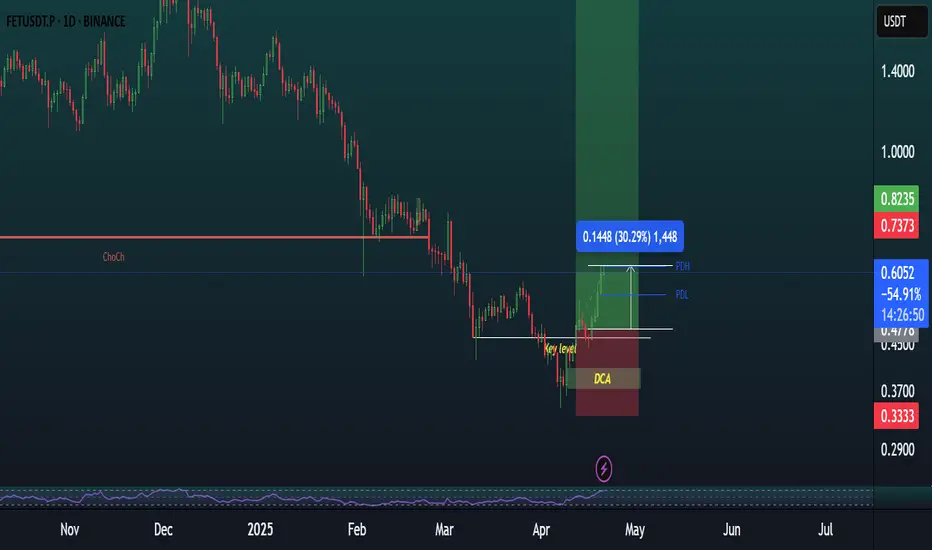
FETUSD - ANALYSIS👀 Observation:
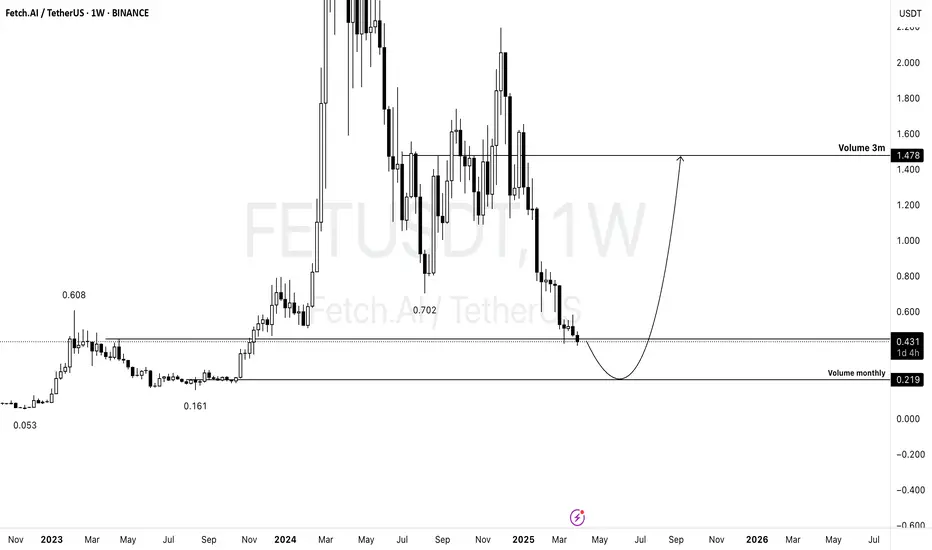
Hello, everyone! I hope you're doing well. I’d like to share my analysis of Fetch AI (FET-USD) with you.
Looking at the Fetch AI chart, I expect that if we close the weekly candle above 0.448, we could see the beginning of a bull market with a target of 1.478. However, if the weekly candle closes below 0.448, I expect a price drop towards 0.219. After reaching this level, I anticipate the price will bounce back with a target of 1.478.
📉 Expectation:
Bullish Scenario: Weekly close above 0.448 → price moves up to 1.478.
Bearish Scenario: Weekly close below 0.448 → price declines to 0.219 and then rises towards 1.478.
💡 Key Levels to Watch:
Support: 0.219
Resistance: 0.448, 1.478
💬 What do you think about Fetch AI (FET-USD) this week? Let me know in the comments!
Trade safe
FET bullish ideafet has been moving inside a downward flag, I believe it will break the upper trend line and move towards 0.515, rejection from the upper trend line will send it back towards 0.4

FET bearish ideaafter a small rise to 0.58 I expect FET to follow it's weekly pattern and fall to the lower line of the rising wedge.
FETUSDT at Key Support with Bullish Indicators!FETUSDT Technical analysis update
FET/USDT is currently trading at its major support zone. Key observations:
-The resistance from March 2022 and March 2023 is now acting as support.
-The daily chart's RSI has dropped below 30, indicating oversold conditions.
-A bullish MACD crossover has occurred below the histogram.
-A bullish divergence is visible in the RSI on the daily chart.

FET/USDT-12H-BINANCE
bullish three pushes-divergence
This is not a financial advice. Always do your own research and always put stoploss in your trade (SL) :) If you want more detailed info
how to study and read charts or just need help with some coin, just write to me here a comment, i will try to answer to everybody...
i can help you :) all for free, don't worry, BE HAPPY!
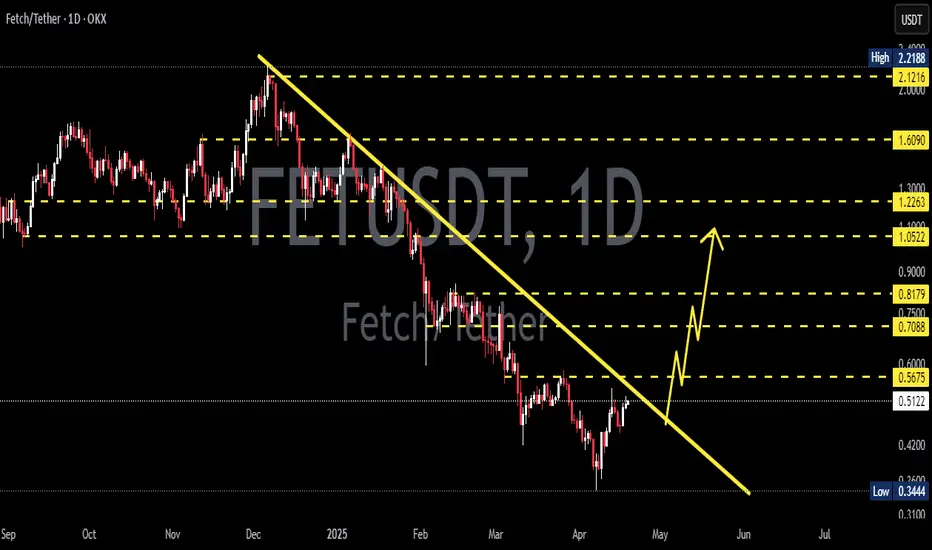
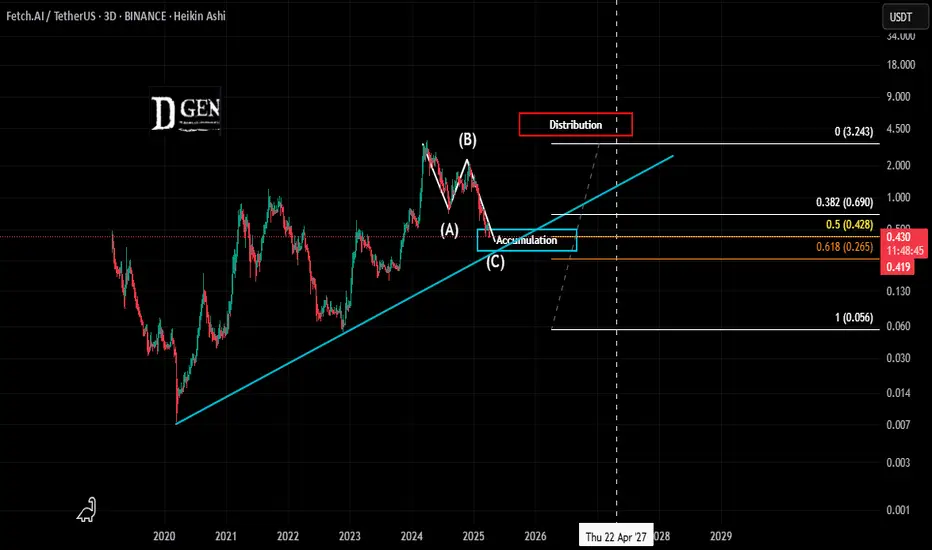
Fetch.AI Technical Analyze Trend: The price is in an ascending triangle (green and red lines). Typically, ascending triangles are bullish patterns, especially when the price breaks out above the resistance (upper red line).
Support: The green support line (around 0.45) has been a key zone where price has bounced off several times.
Resistance: The red resistance at 1.00–1.10 is key. A breakout above this resistance could signal a potential rally toward 3.43.
Volume: The volume spike during upward price movements indicates strong buying interest.
Price Action: Watch for a breakout above 1.00 for confirmation of bullish continuation. If the price rejects this level, a move back to the support zone (0.45) is likely.
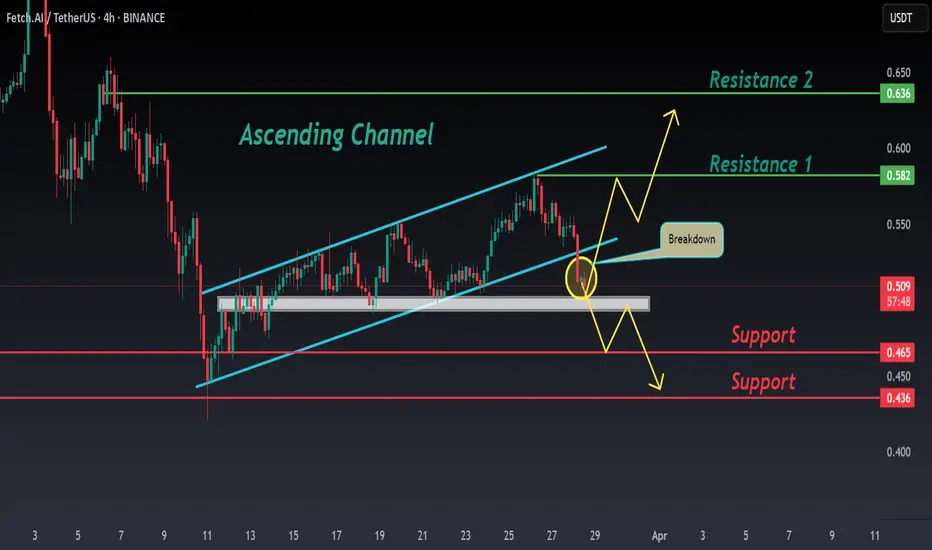
FET ANALYSIS🔆 #FET Analysis : Breakdown
📊As we can see that #FET is following ascending channel on 4hr time frame. There is a breakdown in #FET and if it sustain this breakdown then we would see a dump first then a pump.
⁉️ What to do?
- Keep your eyes on the chart, observe trading volume and stay accustom to market moves.🚀💸
#FET #Cryptocurrency #ChartPattern #DYOR
FETUSDT 1WFET ~ 1W Analysis
#FET Buy gradually from here if you still have a Conviction on this coin with a short -term target of at least 20%+.

$FET Breakout Confirmed – Can Bulls Hold Support?
Fetch.ai (FET) has successfully **broken out** from a ascending triangle and is now in the **retest phase**, making this a critical moment for bulls.
FET 4H Update:
- Breakout confirmed, with immediate support at **$0.55 - $0.54**.
- Holding this support is crucial for further upside momentum.
FET Daily Update:
- A **daily close above $0.585** would reinforce bullish sentiment and open doors for further gains.
The next move depends on the support retest—a strong bounce could confirm continuation! Keep an eye on price action. 🚀
