FHE/USDTKey Level Zone: 0.07880 - 0.07970
The setup looks promising—price previously trended upward with rising volume and momentum, then retested this zone cleanly. This presents an excellent reward-to-risk opportunity if momentum continues to align.
Introducing LMT (Levels & Momentum Trading)
- Over the

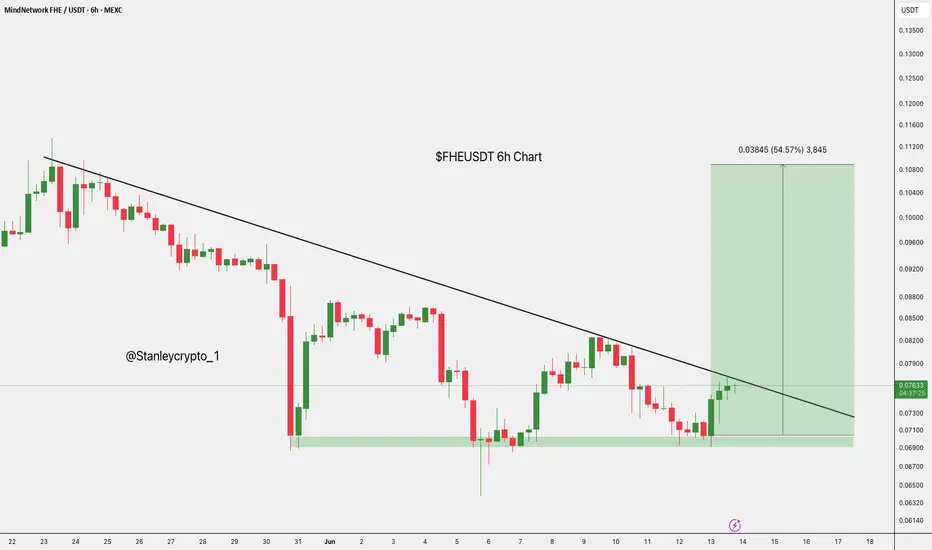
$FHE 6h chart setup. The ASX:FHE 6h chart is showing a potential breakout setup.
Price has held strong at the $0.06963–$0.07132 support zone and is now testing the descending trendline resistance around $0.07600.
A breakout above this level could trigger a 54% rally toward $0.112.
Watch closely, a move above the
FHE USDTCP 0.09710
Buy 0.1 TO 0.096
sell 0.019
Stop Loss 0.08323
|Good project with Huge potential.
Spot Trade Only.
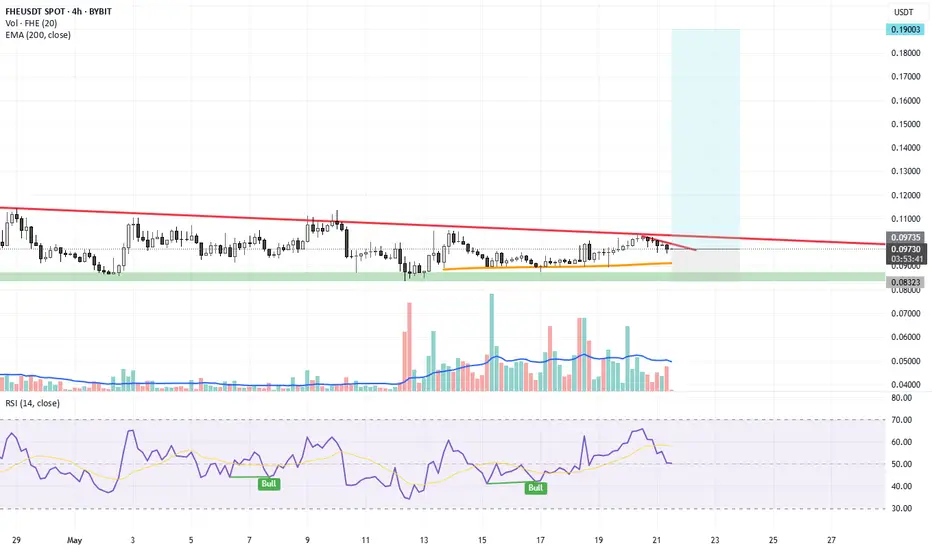
$FHE/USDT Chart Update$FHEUSDT/USDT Chart Update
Strong bounce from the demand zone
6h structure holding firm with a clear bullish reaction
Entry: $0.095–0.097
SL: $0.08615
TP: $0.18484+
It looks ready to explode, so don’t sleep on this one! 👀
DYRO, NFA
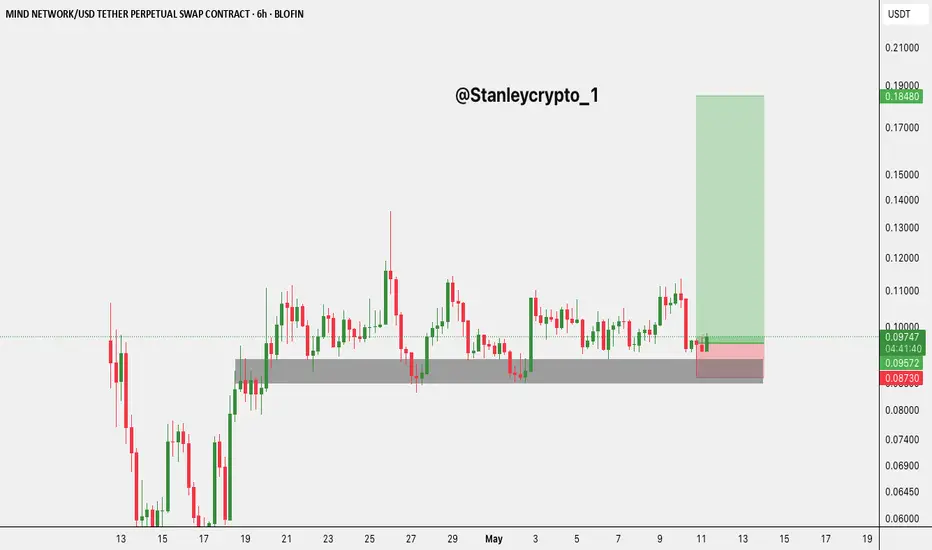
$FHE/USDT Bullish Breakout Setup$FHE/USDT Bullish Breakout Setup
Price just broke out of a symmetrical triangle after days of tight consolidation.
Momentum is building, this looks ready to fly. 🚀
- Entry: CMP
- Target: $0.18
- SL: $0.091
High RR setup. Watch closely. DYRO, NFA

FHE/USDTKey Level Zone: 0.09320 - 0.09790
HMT v8.1 detected. The setup looks promising, supported by a previous upward/downward trend with increasing volume and momentum, presenting an excellent reward-to-risk opportunity.
HMT (High Momentum Trending):
HMT is based on trend, momentum, volume, and market s

FHE PERPETUAL TRADE Sold at $0.088FHE PERPETUAL TRADE
FHEUSDT SELL SETUP
Currently $0.087
Sold at $0.088
(Trading plan If FHE/USDT up to $0.10 we will add more shorts)
Expecting target $0.08 OR DOWN
Incase of early exist will update this anaylsis
Its not a Financial advice

FHE/USDT Analysis – High Probability of a Bullish Trend
This futures pair is showing strong signs of entering a full-fledged bullish trend.
We are currently attempting to break through the key level of $0.078.
Below that, a strong volume zone has formed at $0.0756–$0.072, which is now acting as support.
We're looking at a potential long position up

Fibonacci Retracement Points to $0.0000010 TargetAnalysis:
ASX:FHE ’s 1-day chart shows the price at $0.00000079, near the 61.8% Fibonacci retracement level from a prior swing high ($0.0000015) to low ($0.00000050). A bounce from this level could target the 38.2% retracement at $0.0000010. RSI is neutral at 42.
Actionable Insight:
Long at $0.0000

Ichimoku Cloud Resistance Looms at $0.00000090Analysis:
On the 4-hour chart, ASX:FHE is approaching the Ichimoku Cloud’s lower edge at $0.00000090. The price is at $0.00000079, with the Tenkan-sen crossing above the Kijun-sen, signaling short-term bullishness. A cloud breakout could target $0.0000012, but low liquidity adds risk.
Actionable I
See all ideas
Summarizing what the indicators are suggesting.
Oscillators
Neutral
SellBuy
Strong sellStrong buy
Strong sellSellNeutralBuyStrong buy
Oscillators
Neutral
SellBuy
Strong sellStrong buy
Strong sellSellNeutralBuyStrong buy
Summary
Neutral
SellBuy
Strong sellStrong buy
Strong sellSellNeutralBuyStrong buy
Summary
Neutral
SellBuy
Strong sellStrong buy
Strong sellSellNeutralBuyStrong buy
Summary
Neutral
SellBuy
Strong sellStrong buy
Strong sellSellNeutralBuyStrong buy
Moving Averages
Neutral
SellBuy
Strong sellStrong buy
Strong sellSellNeutralBuyStrong buy
Moving Averages
Neutral
SellBuy
Strong sellStrong buy
Strong sellSellNeutralBuyStrong buy