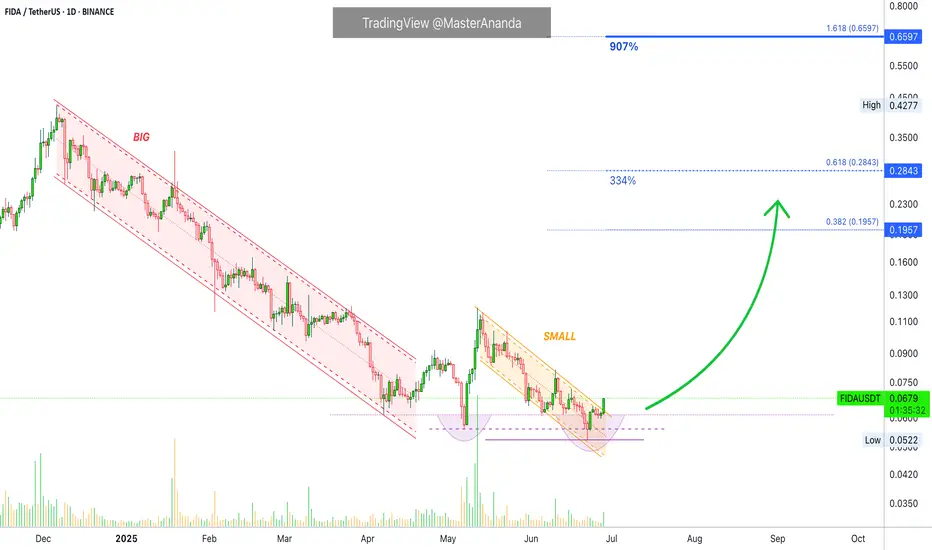
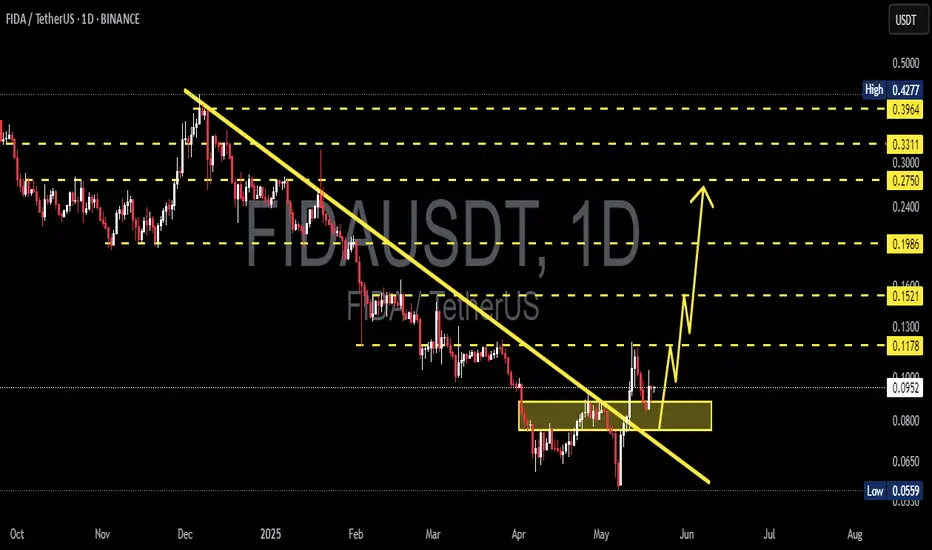
Bonfida —Solana Name Service Strong 900% Target MappedI have another one for you and this one we've been looking at for some time. Bonfida —Solana Name Service (FIDAUSDT).
This is a good project, based on the chart. The December 2024 high was set at 0.4277. This is a "mandatory" target, that is, an easy hit or must hit because the market tends to chal
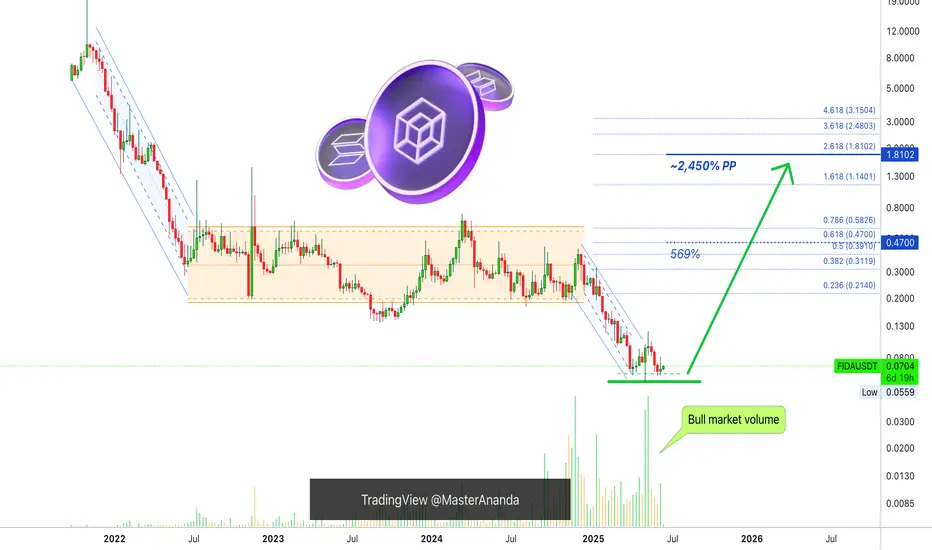
Solana Name Service—Bonfida, Bull Market Volume (2,450% PP)Sometimes just one signal is enough. We have a clear bottom pattern and the highest volume ever. The interesting part is that trading volume started to rise significantly in September 2024, a long time ago. There is lots of interest for this pair.
Solana Name Service—Bonfida—FIDAUSDT is still early
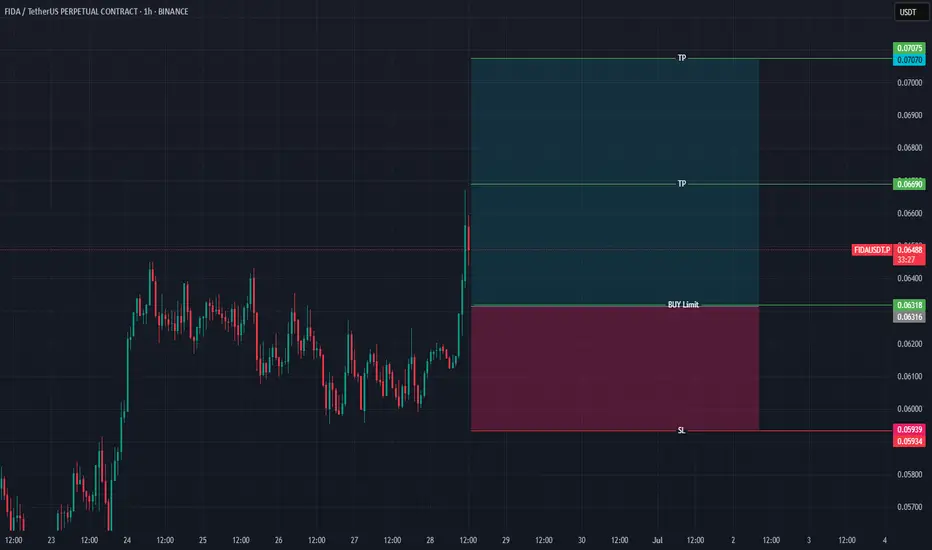
Bonfida – The Sleeping Giant. A 1:17 Risk-Reward Setup!Current Situation:
Bonfida (FIDA) is showing signs of forming a long-term bullish trend after a correction. The price is holding above key support levels, and trading volume is increasing amid a broader crypto market recovery.
Trade Parameters:
Entry Price: $0.0660
Stop Loss: $0.0550 (~16.6% ri
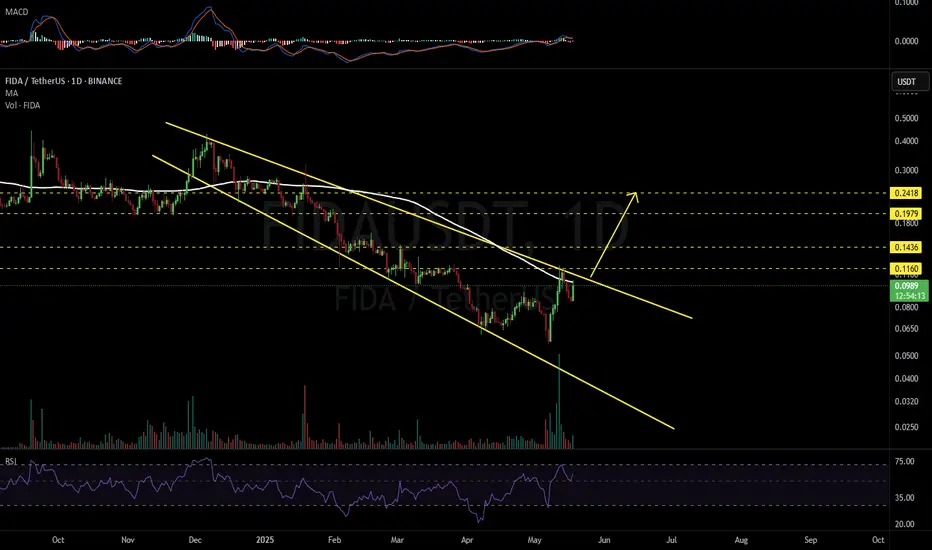
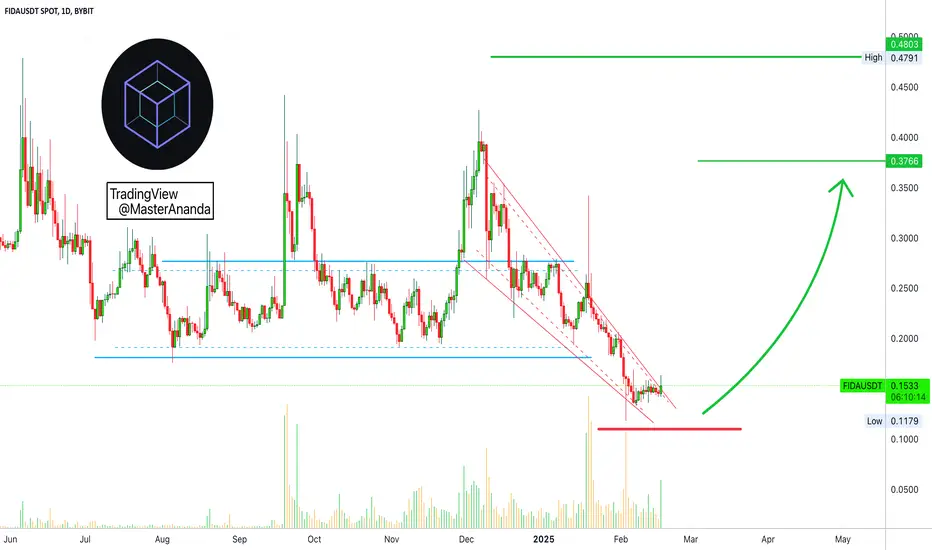
FIDAUSDT 1D Analysis FIDA ~ 1D Analysis
#FIDA Buy incrementally on retesting this support block with a short term target of at least 10%+ from here.
FIDAUSDT 1D#FIDA has formed a descending broadening wedge on the daily chart. It is currently facing resistance at the daily MA100. In case of a breakout above the pattern resistance and the MA100, the targets are:
🎯 $0.1160
🎯 $0.1436
🎯 $0.1979
🎯 $0.2418
⚠️ Use a tight stop-loss.
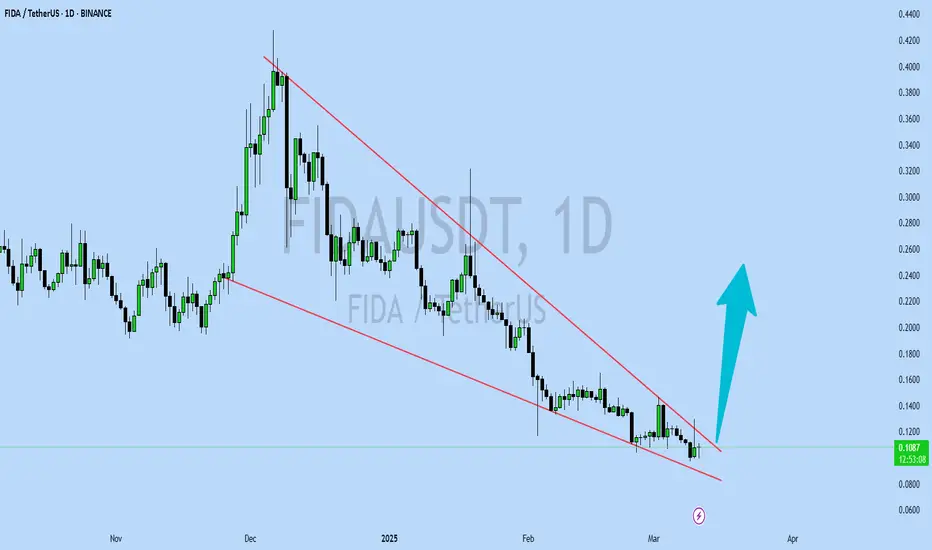
FIDAUSDT UPDATEFIDAUSDT is a cryptocurrency trading at $0.1094. Its target price is $0.2400, indicating a potential 100%+ gain. The pattern is a Bullish Falling Wedge, a reversal pattern signaling a trend change. This pattern suggests the downward trend may be ending. A breakout from the wedge could lead to a stro
$FIDA - Upside starts hereBINANCE:FIDAUSDT - Ready to rock and roll is what FIDA is going to do. Entering a bullish zone.
Hype or Game-Changer?SNS says they will announce something, likely around February 18th.
I don’t know what it is, but if it's worth speculating on, it could be a name change or a major partnership.
Crypto hasn’t followed traditional analysis patterns over the past two years—it’s mostly driven by speculation, news, and

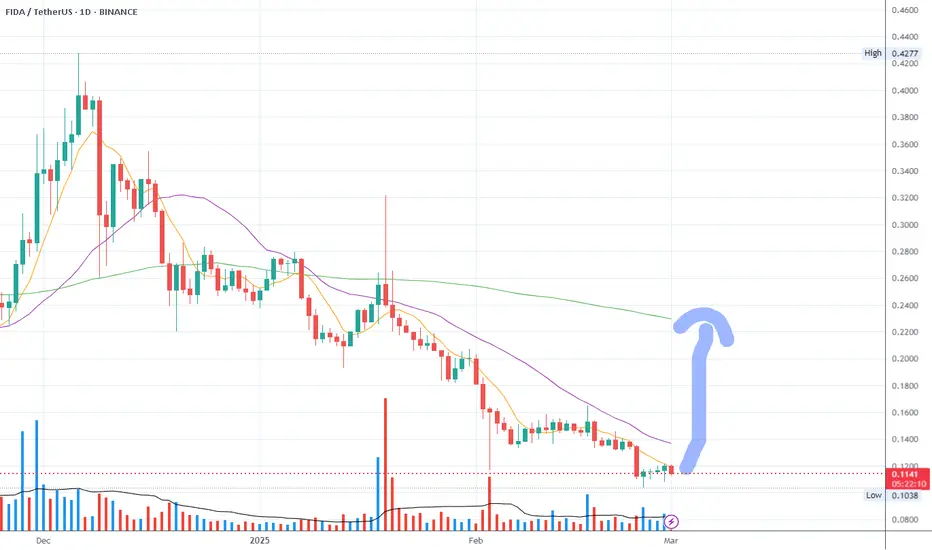
Bonfida Going Bullish —Entering Long-Term Growth PhaseNotice the same pattern, the ending diagonal, that is present on the API3USDT trading pair. This means that FIDAUSDT is already ready to grow.
The exact same dynamics. A low 3rd-February followed by some sideways. This sideways will lead to a strong bullish breakout which means up, and then more up
See all ideas
Summarizing what the indicators are suggesting.
Oscillators
Neutral
SellBuy
Strong sellStrong buy
Strong sellSellNeutralBuyStrong buy
Oscillators
Neutral
SellBuy
Strong sellStrong buy
Strong sellSellNeutralBuyStrong buy
Summary
Neutral
SellBuy
Strong sellStrong buy
Strong sellSellNeutralBuyStrong buy
Summary
Neutral
SellBuy
Strong sellStrong buy
Strong sellSellNeutralBuyStrong buy
Summary
Neutral
SellBuy
Strong sellStrong buy
Strong sellSellNeutralBuyStrong buy
Moving Averages
Neutral
SellBuy
Strong sellStrong buy
Strong sellSellNeutralBuyStrong buy
Moving Averages
Neutral
SellBuy
Strong sellStrong buy
Strong sellSellNeutralBuyStrong buy
Displays a symbol's price movements over previous years to identify recurring trends.