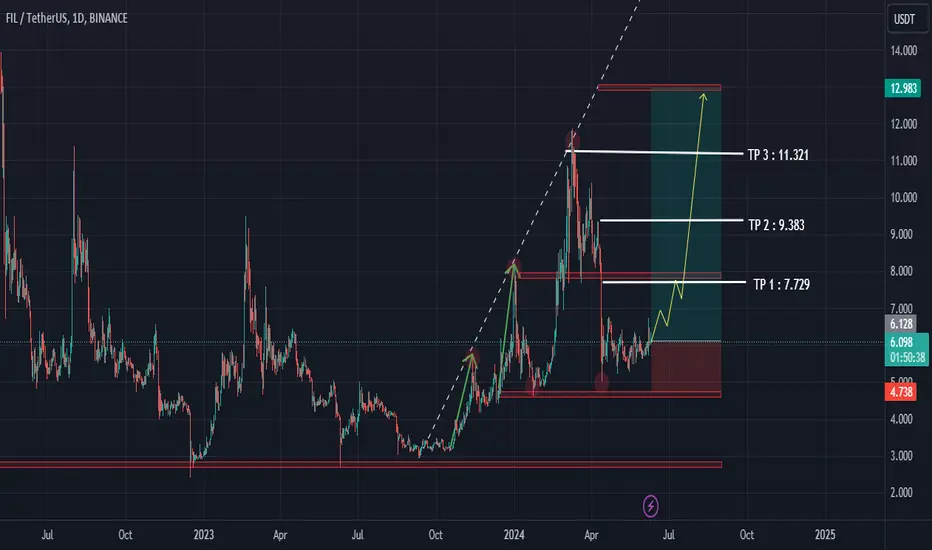
FILUSDT: 350% Potential Rally.Hello everyone, I’m Cryptorphic.
For the past seven years, I’ve been sharing insightful charts and analysis.
Follow me for:
~ Unbiased analyses on trending altcoins.
~ Identifying altcoins with 10x-50x potential.
~ Futures trade setups.
~ Daily updates on Bitcoin and Ethereum.
~ High time frame (HTF) market bottom and top calls.
~ Short-term market movements.
~ Charts supported by critical fundamentals.
Now, let’s dive into this chart analysis:
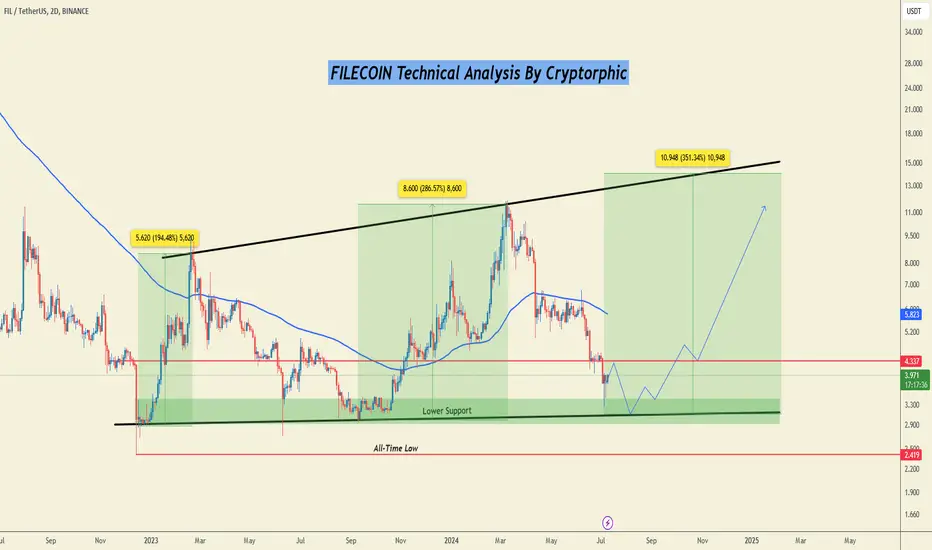
Here's a recent update on #FIL.
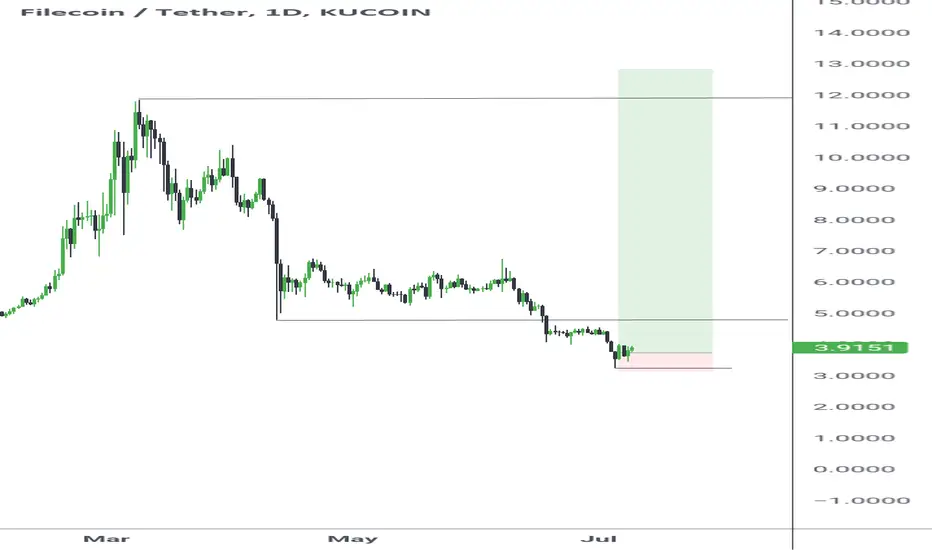
#FIL has recently reached down to the lower support range, dropping as low as $3.250. With the current price at $3.95, it has formed decent support ranging between $2.9 and $3.4, with an all-time low of $2.419.
Considering the past rallies, #FIL has shown decent pumps while respecting the support line. In the coming altseason, #FIL will likely show similar moves with a higher profit percentage.
- Lower Support: $2.9 to $3.4
- All-Time Low: $2.419
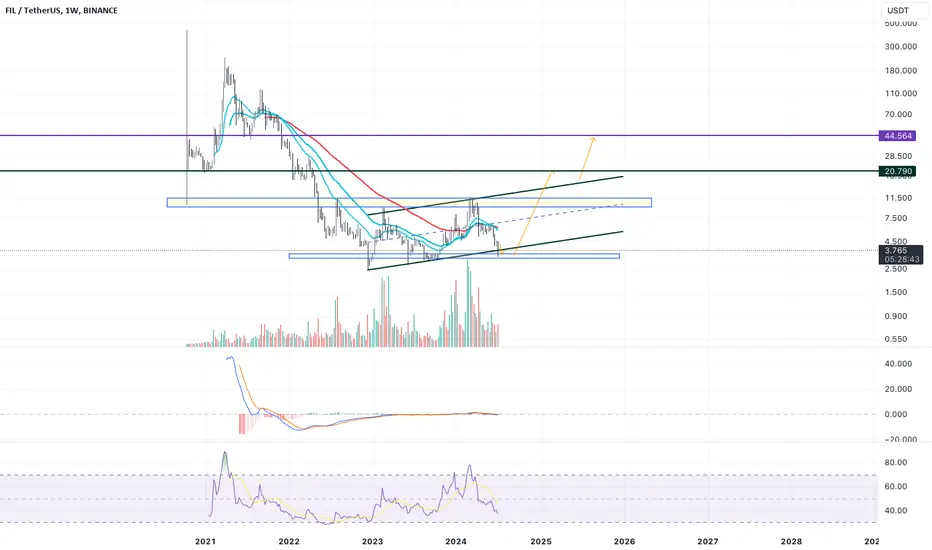
- Long-term Target: $14
DYOR, NFA.
Please hit the like button to support my content and share your thoughts in the comment section. Feel free to request any chart analysis you’d like to see!
Thank you!
#PEACE
FILECOINUSDT.P trade ideas
My bias is on FILUSDaccording to my fundamental and technical calculations, I think we will see the growth of filecoin
FILUSDT.PLong on the bottom support, potential RR is amazing. Taking this as an investment opportunity, and will rethink only after close and retest under the current bottom support.
DYOR
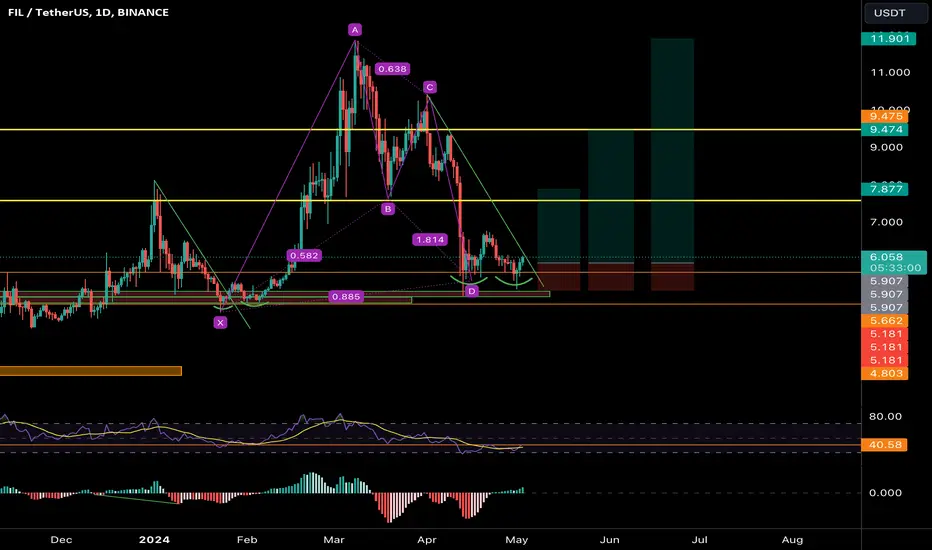
FIL analysis (1D)It seems that the correction formed for FIL is a symmetrical one, which seems to be wave i, which is the last wave of this pattern, will end in the green range.
In the green range, you can look for buy/long positions.
Closing a daily candle below the invalidation level will violate the analysis.
For risk management, please don't forget stop loss and capital management
Comment if you have any questions
Thank You
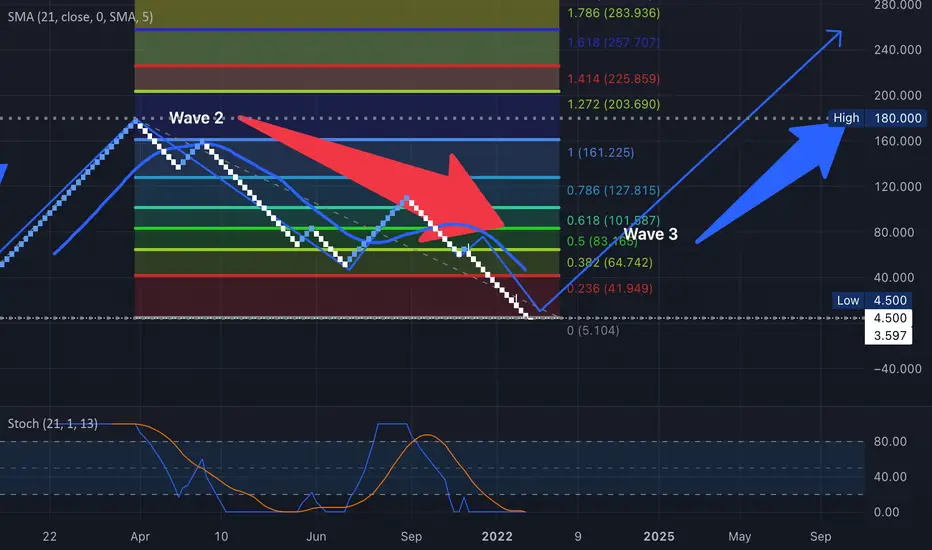
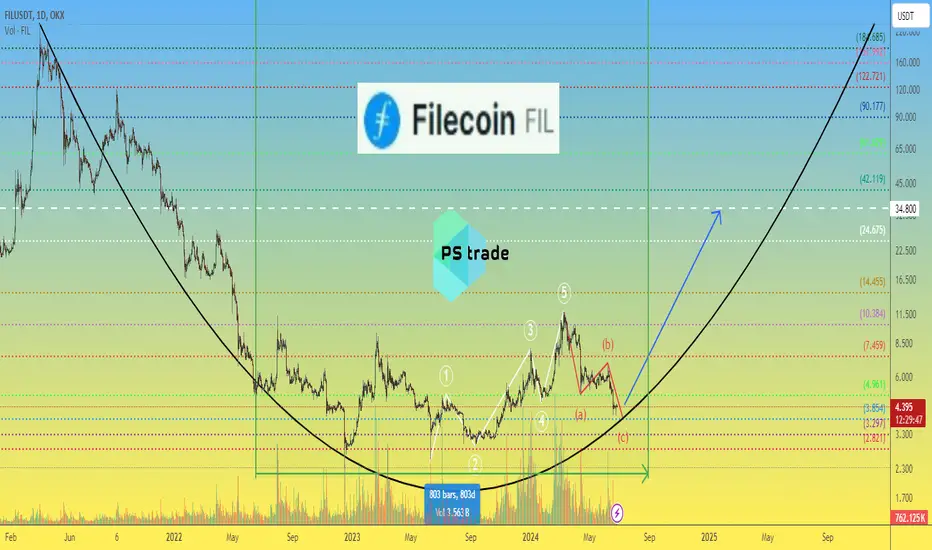
FileCoin Bullish Start Wave 3 Weekly Renko July 2024File coin will likely start its wave 3 up July 2024.
Target 1 fib ext .618 at $102
Target 2 fib ext 1.27 at $201
Target 3 fib ext 1.618 at $255
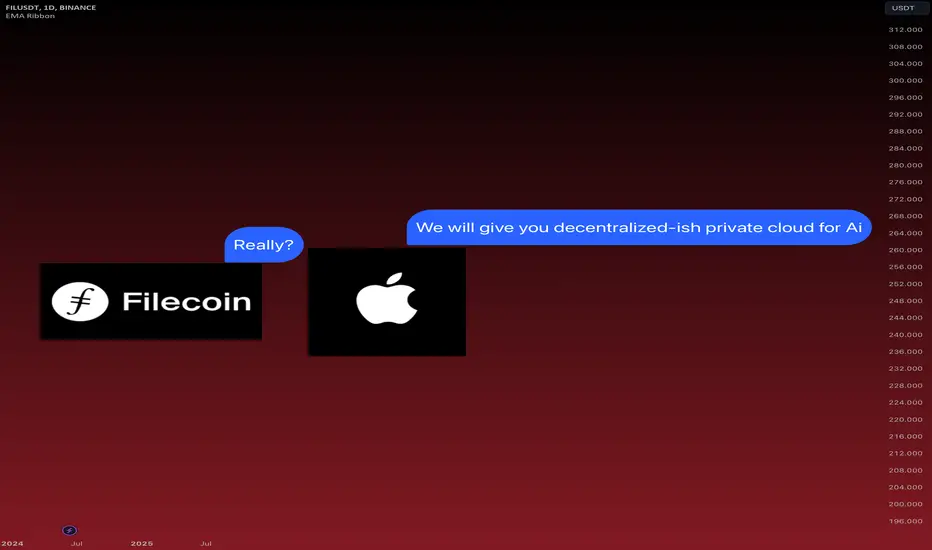
Someone saysss Private CLOUD!!!NASDAQ:AAPL CRYPTO:FILUSD Apple announced some new features for Ai and cloud at the last event.Sounds familiar.
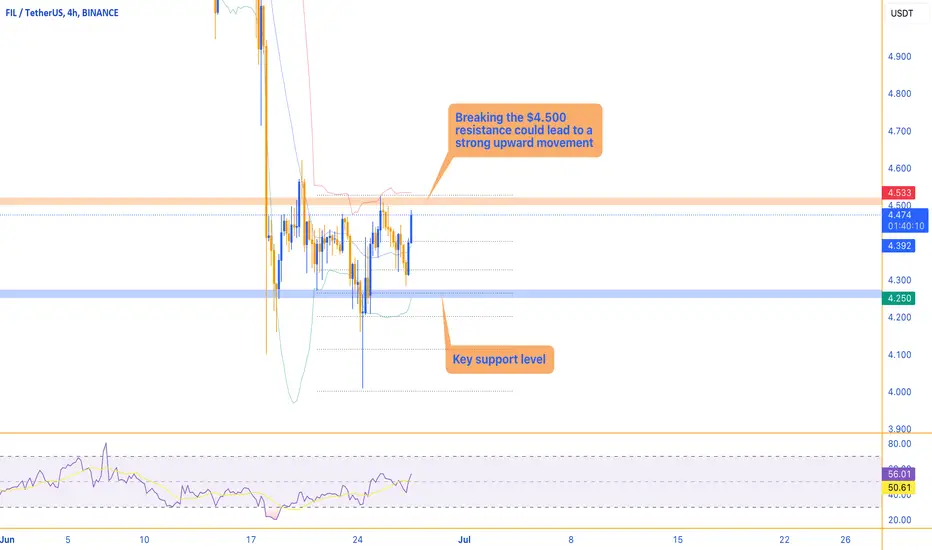
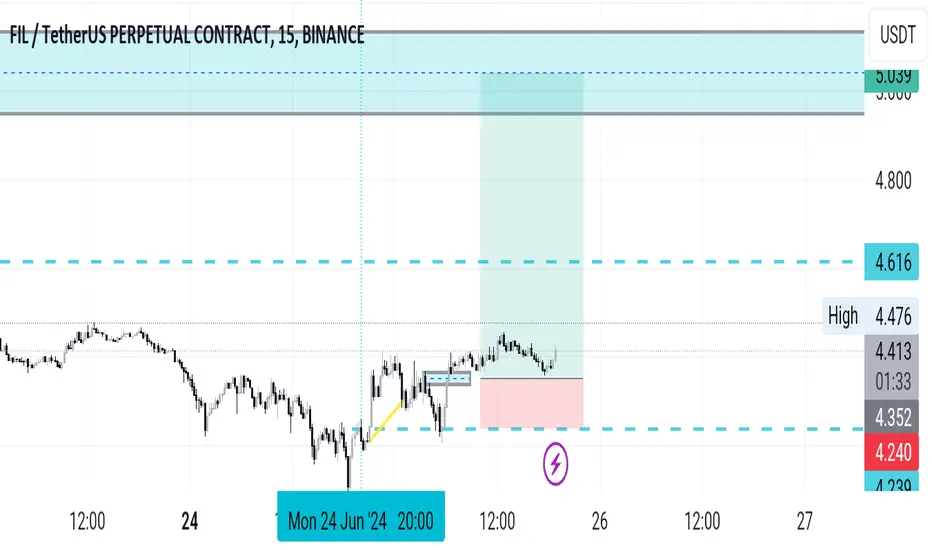
FIL's significant situationThe price of FIL is at a significant situation. Breaking the $4.500 resistance could lead to a strong upward movement, while failing to break this level might result in a decline to lower support levels.
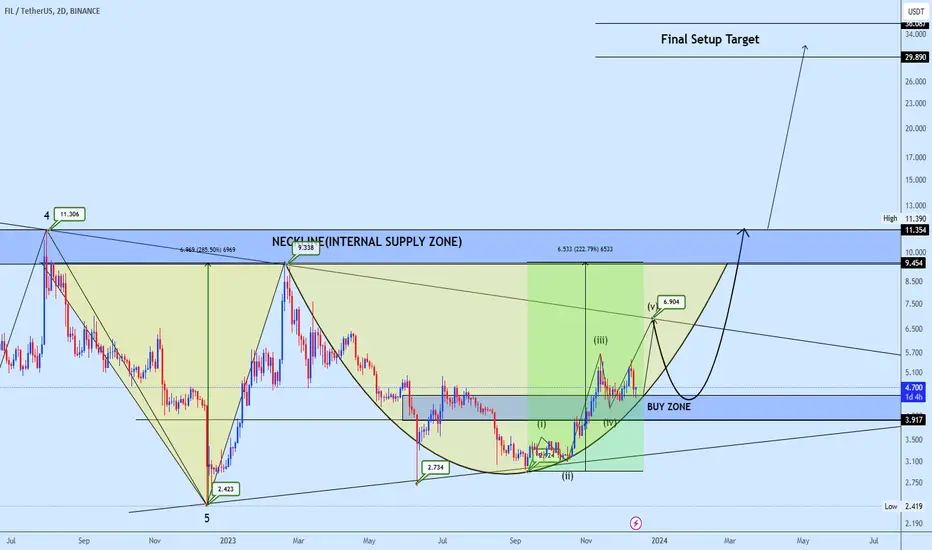
Filusdt Trading opportunityFilusdt is currently displaying a potential Adam & Eve reversal pattern, indicating a potential trend reversal. The completion of this pattern could trigger a final setup target in the range of $30 to $36.
The buy zone is an opportune area for accumulation, as investors can take advantage of potential price appreciation. However, it's important to note that the immediate resistance level lies at the setup neckline, which may pose a hurdle for further upward movement.
Please stay tuned for timely updates on this analysis. Feel free to leave your comments and don't forget to show your support by liking the post.
Thank you.
Filcoin #scalp #FILFilcoin short term trade , the reason I entered in short postion is because of the bearish breaker
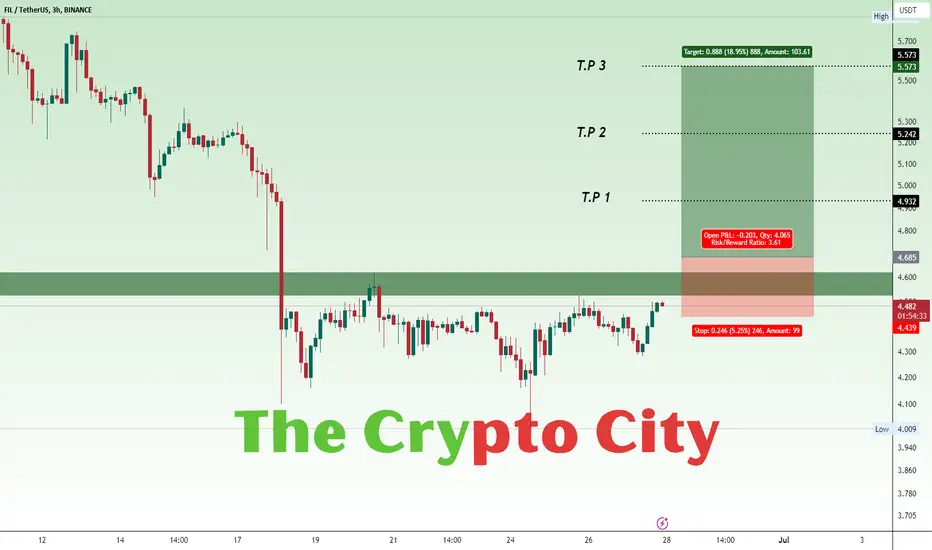
FIL USDTFIL Trade Setup.
After a confirmed breakout from the green zone, we could take entry at $4.685.
Remember stop loss is your friend. Everything is on the chart.
Entry $4.685
S.L $4.439
T.P 1 $4.932
T.P 2 $5.242
T.P 3 $5.573

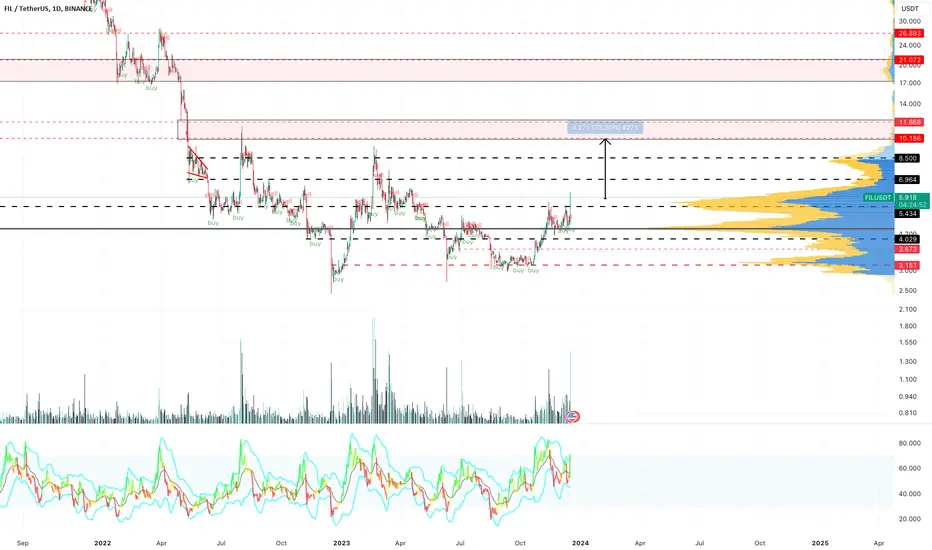
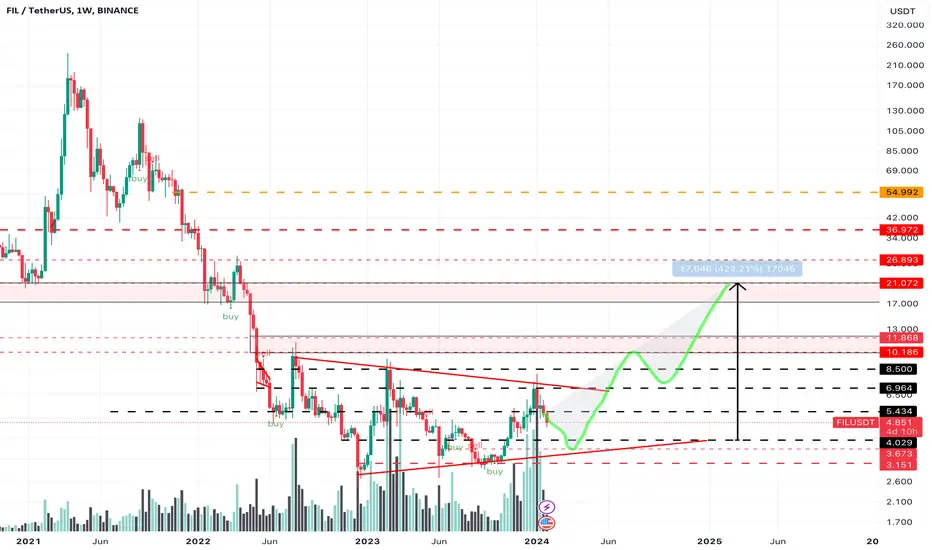
Filecoin FIL price, when will you come to life?)Such a dinosaur of the crypto market as #Filecoin, with the fundamentals and functionality that not only the crypto world but humanity as a whole needs, somehow looks extremely underestimated.
Or maybe we don't understand something and the project is dead ❓)
I would like to believe that this long accumulation of #FILUSDT in the range of $3-10 will eventually give a powerful upward move.
At least to make #Fil worth $35, not even $235 like on ATH)
By the way, a similar situation and accumulation was previously seen on the #LinkUSDT chart, check out how it worked 👇
FILUSDT Price UpdateFIL has dropped 66% from its local high of $11.85. The current price is at $4.4, where we have initial support.
The high liquidity range for FIL is between $2.6 and $3, meaning if the market crashes further, FIL is likely to dip into this lower range of support.
For now, the $4 range is holding as good support for FIL.
DYOR. NFA.
#Filecoin

Filcoin Long TradeI have opened a long position on filcoin and plan to take my initial profit when it reaches the highest point within a 4-hour period. I will then adjust my stop loss to a higher level to ensure safety and proceed to target the second take profit.
FIL LONGI mean its almost the same chart on every coin. We smashed FIL last time with all three targets hit. Lets try the same again
Fil/USDT time to wake upThis shieldcoin will show its growth very quickly.
These prices are just a thrill.
I am not to blame for those who did not buy
Fil/USDTA very interesting tool. However, there are certain comments from the SEC regarding the recognition as a security, but nothing)
The price is consolidating for a very long time, the entire volume is consolidating before going up. You can add 2-3% of the deposit to the portfolio
$BINANCE:FILUSDT Potential BUY From +/- 7.000BINANCE:FILUSDT Potential BUY Opportunity. Still I am going to hold this until it breaks through the resistance i.e 7.000 until then just wait. After it breaks through 6.900 its a BUY.
TP1, TP2 , TP3 are the Resistance point based on previous liquidation.
This is just an Idea, your capital is at risk .
Please make sure to do your research before taking the trade.
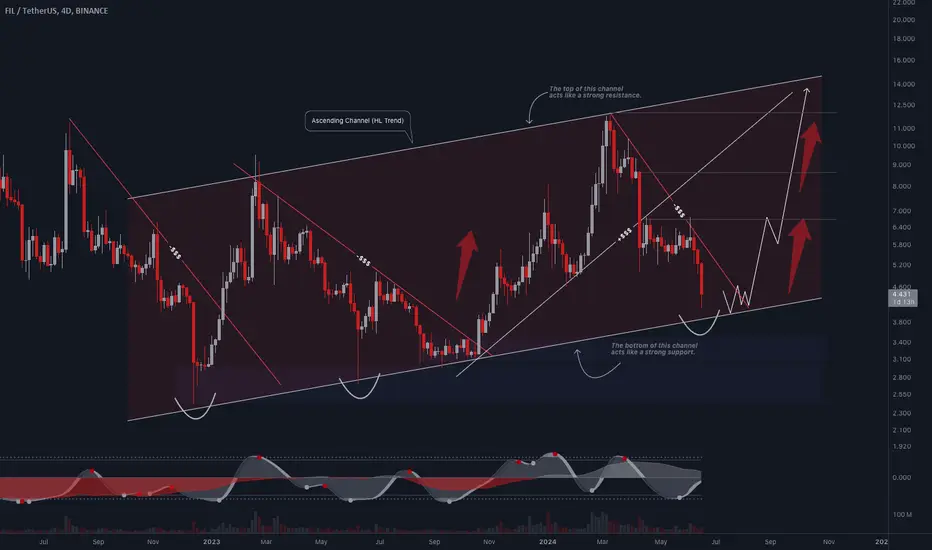
$FIL #Filecoin Trading IdeaFIL/USD (Filecoin) formed an ascending channel on a 4D timeframe and analyzed previous trendlines. Full send after a bounce from the pattern's bottom. If this setup plays out my next potential target would be around $6.676; $8.655; $11.985.
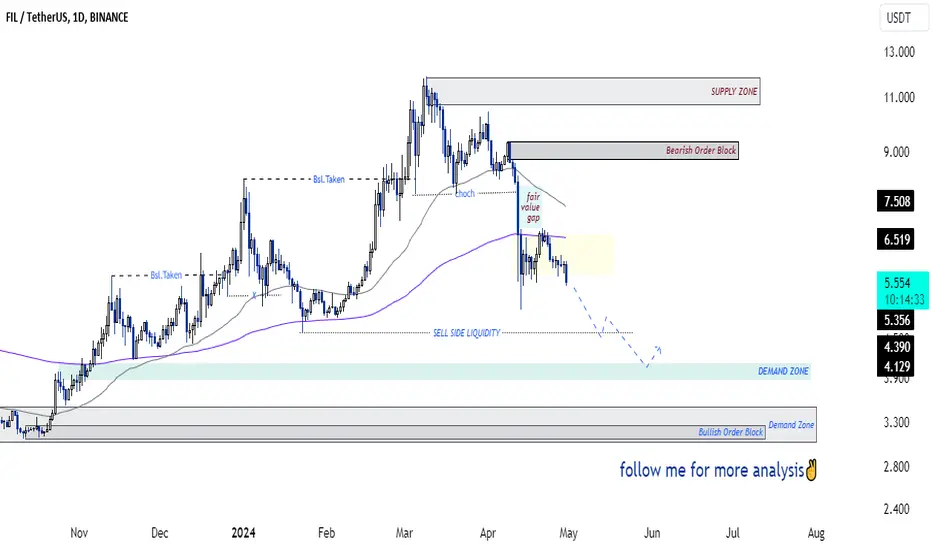
SasanSeifi 💁♂ Daily Analysis with Key Support Zones🔻 Hey there, Let's take a look at the daily timeframe of BINANCE:FILUSDT .
As you can see, the price has been on a downtrend since the $11 zone. Currently, after some minor fluctuations, it has been rejected from the 200 EMA and is trading around $5.50. The price is more likely to move downwards. If it consolidates below $5.35, we can expect a further correction toward the SELL SIDE LIQUIDITY and the $4 demand zone.
Key support levels are $4 and $3.50. There is a higher probability of a positive reaction from the $4 demand zone. In case of a correction, we need to see how the price reacts.
The potential trend is also highlighted in the chart above. Additionally, if the $4 zone breaks down, the $3.50 correction target can be considered.
Remember, this is just my personal analysis, not financial advice. Do your own research and make informed decisions.
Happy trading!✌😎
Sure, if you have any more questions or need further clarification, feel free to ask. I'm here to help!✌
if you found my analysis helpful, I would appreciate it if you could show your support by liking and commenting. Thank you!🙌
FIL coin trade ideaFil coin is very difficult coin to trade. Because it always grabs liquidity thats why I am looking for grabbing liquidity then will long. Liquidity is below previous support zone, price likely to come at that zone then reversal to upside.

filAccording to the market conditions, we are moving in this area. I expect him to act for the red box by reacting to the green line.
