Filecoin will surprise everyonehi traders
Filecoin is not a very popular coin, but it will change soon.
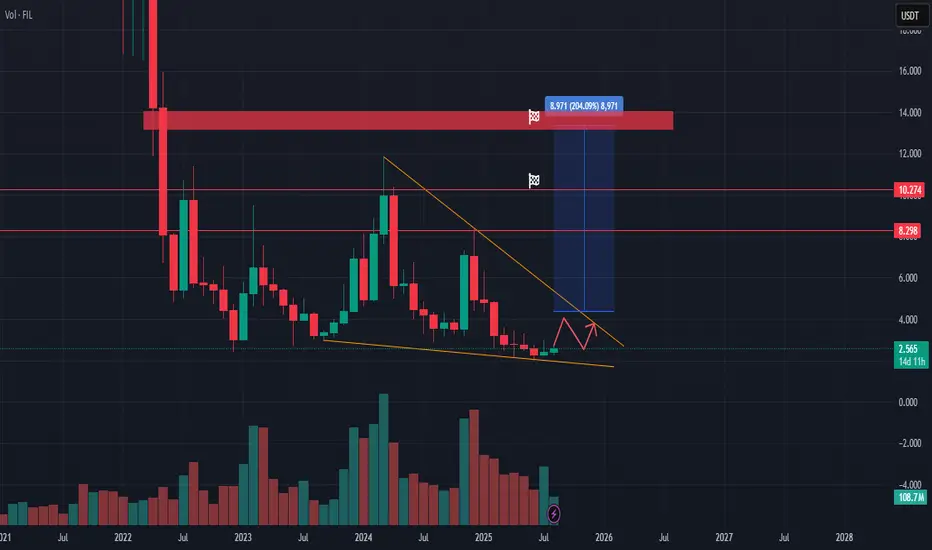
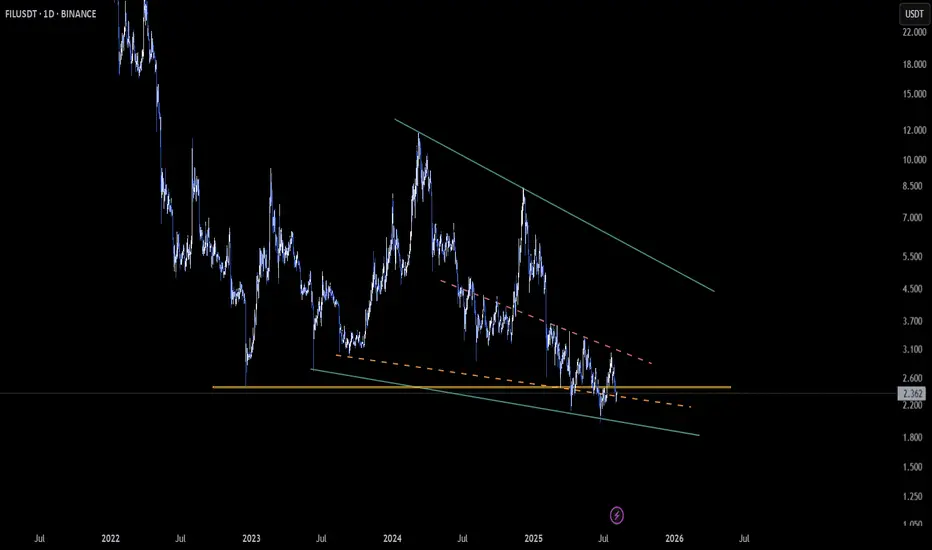
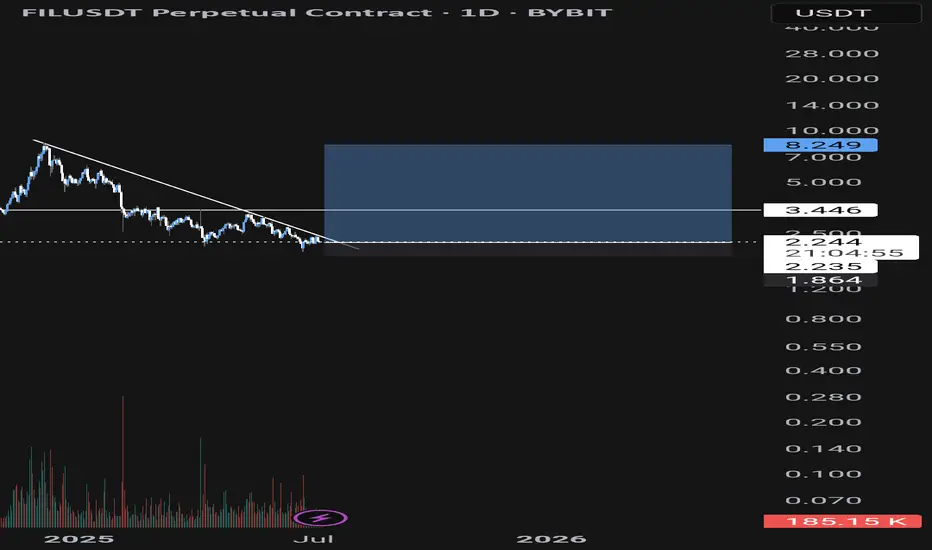
Entry Zone: Current levels around $2.56 represent a strong accumulation area.
Pattern: Price has been consolidating within a long-term falling wedge, showing reduced volatility and volume compression – a classic setup for a breakout.
Upside Potential: A breakout from this structure could target the $8.30 and later $10.27 zone.
Final target: 13,400-14$
Psychological Factor: Market sentiment is still heavily bearish, which means buying now is buying cheap. Historically, such levels have preceded strong rallies.
Volume: Noticeable accumulation spikes suggest smart money interest.
Short-Term Path: Expect some sideways action and minor pullbacks before a potential sharp breakout.
Filecoin is severely undervalued at current levels and may surprise everyone in the coming months with a strong upside move. This is a high-risk/high-reward setup, but the risk/reward ratio is favorable for long-term investors and swing traders.
FILUSDT trade ideas
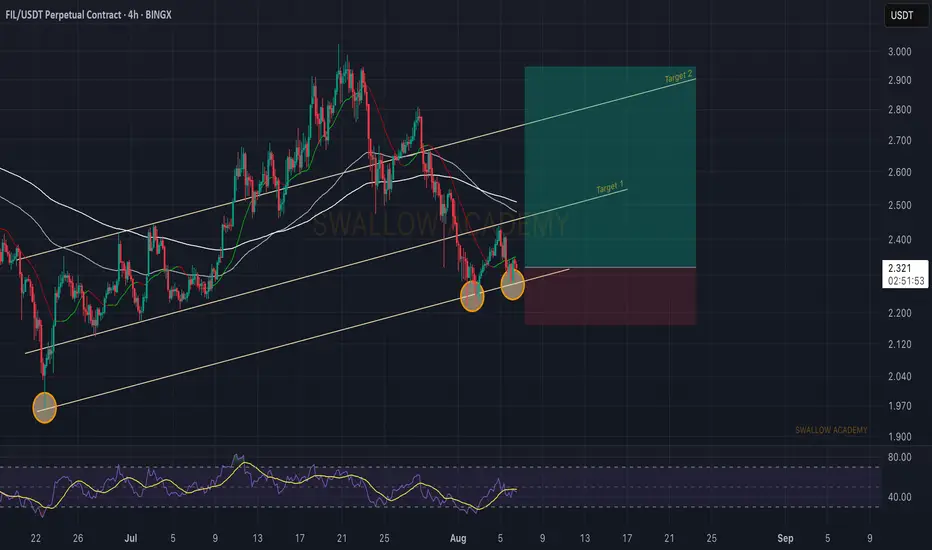
Filecoin (FIL): Might Be Good Bounce Zone FIL seems like it might bounce from the current zone. What we need here is a proper break of structure to form on smaller timeframes, which would then confirm our upside scenario here.
So the plan is pretty simple; this is the overall area we are looking for further bullish movement to continue in our bullish trend, and as soon as we get the BOS on smaller timeframes, we are going to look for long here!
Swallow Academy
FILUSDTBINANCE:FILUSDT is deep corrections from latest bull-trend.
Bets support's in 1.90 to 2.150 $ and resistance's 2.50 and 2.80 $.
Please control risk management.

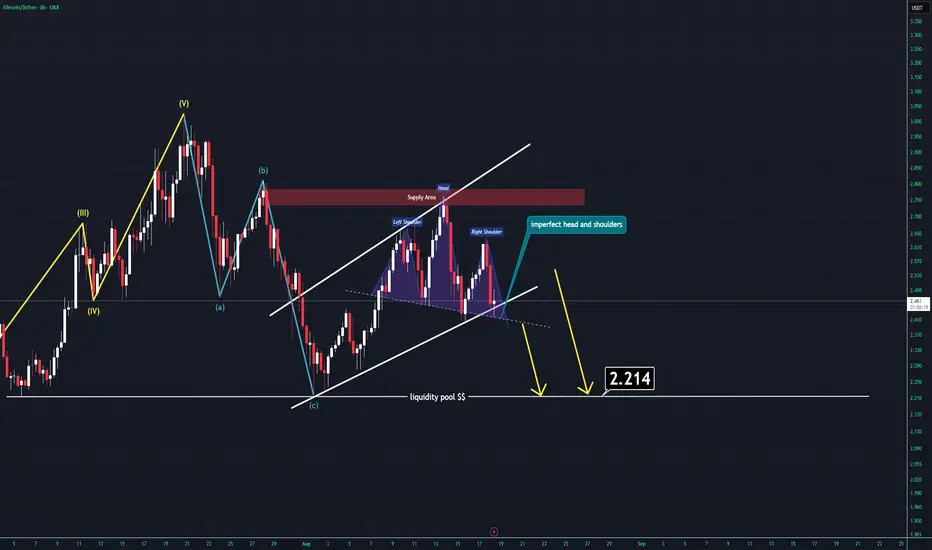
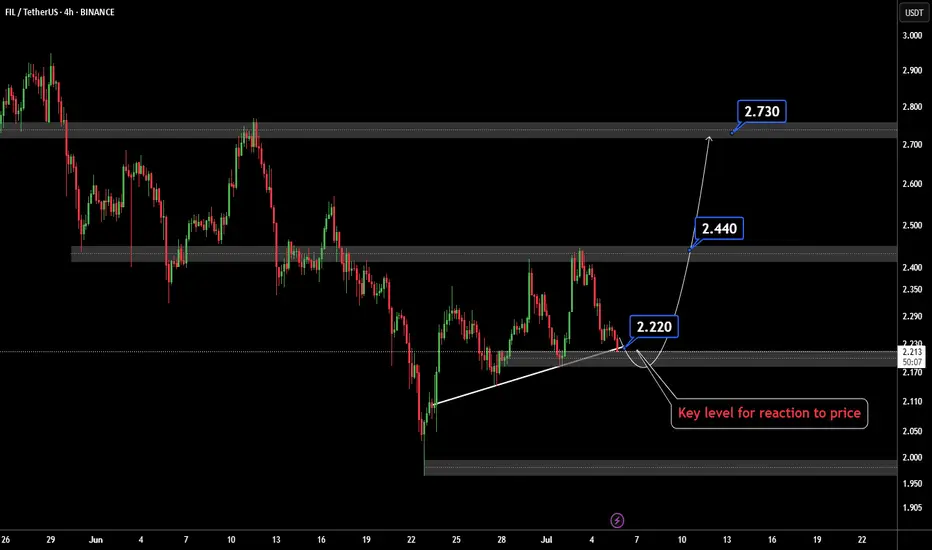
FIL ANALYSIS (8H)After hitting a major supply line, FIL has entered a corrective wave.
Similar to the other setups I shared earlier today, this one is showing very comparable price action. Currently, FIL is trading below all key moving averages (such as the 200 SMA and 50 EMA).
On top of that, an imperfect head and shoulders formation is in play. With the recent breakout, it seems likely that FIL will attempt to grab the lower liquidity pool, which sits around $2.2.
Thanks for reading.

FIL Nears Support Within Falling Wedge Formation📆 LSE:FIL is trending inside a falling wedge on the daily chart — a classic bullish structure that often precedes strong reversals 📐
Price is now approaching the key support zone 🔽 where buyers have historically stepped in. This zone could trigger a bounce if defended well, but a clean breakdown would invalidate the wedge and shift momentum.
👀 Structure looks ripe for resolution — breakout or breakdown incoming?
Drop your view below.
Not financial advice.
Filecoin (FIL): Approaching Support Area | Good Buy OpportunityFilecoin is approaching a local supprot area or more of a liquidity area, where we have seen liquidity sweeps before bigger upward movement (and that's mainly because this is the local bottom).
So we are looking for upward movement from here, similar to all the previous times.
Swallow Academy

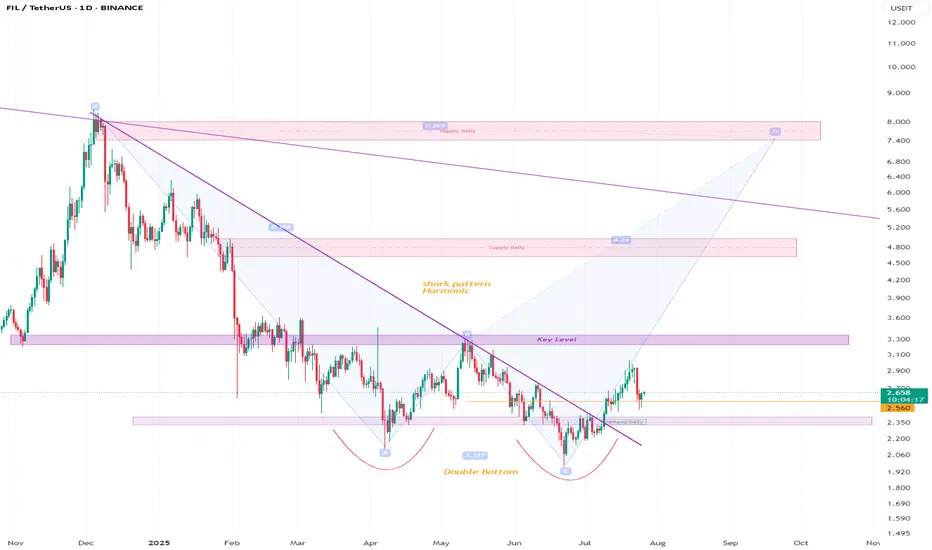
filusdtHello friends, I think Filecoin has a shark pattern and a classic twin bottom. I think it can grow well if important resistance levels are broken (good luck). Check it out for yourself.
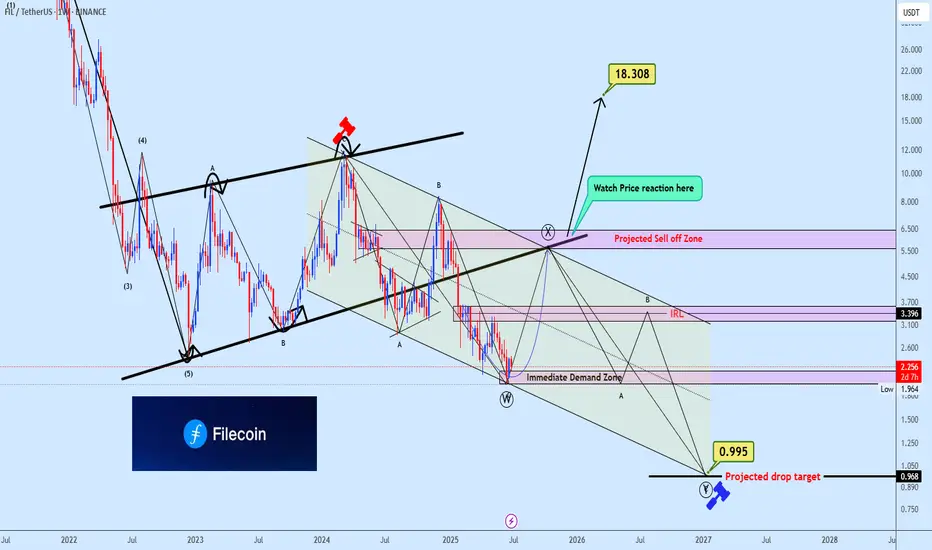
FILUSDT trading ideaFILUSDT broke down from a bearish formation and has since been trading within a descending channel, carving out what appears to be a 3-wave corrective structure (ABC) to complete wave W of a broader corrective pattern.
Price is now approaching a critical zone where wave X is expected to develop. If price manages to break above the projected sell-off zone, bullish momentum could reclaim control, opening the path toward the next major target at $18.308.
However, a rejection at this key resistance would likely trigger another downward leg, pushing the price back into the immediate demand zone. A failure to hold this support would significantly increase the risk of a deeper breakdown toward the projected wave Y target around $0.995, completing the extensive correction structure.
This is a pivotal moment for FILUSDT, We should closely monitor price action around the sell-off zone for clues on whether bulls can reclaim dominance or if the correction will deepen further.
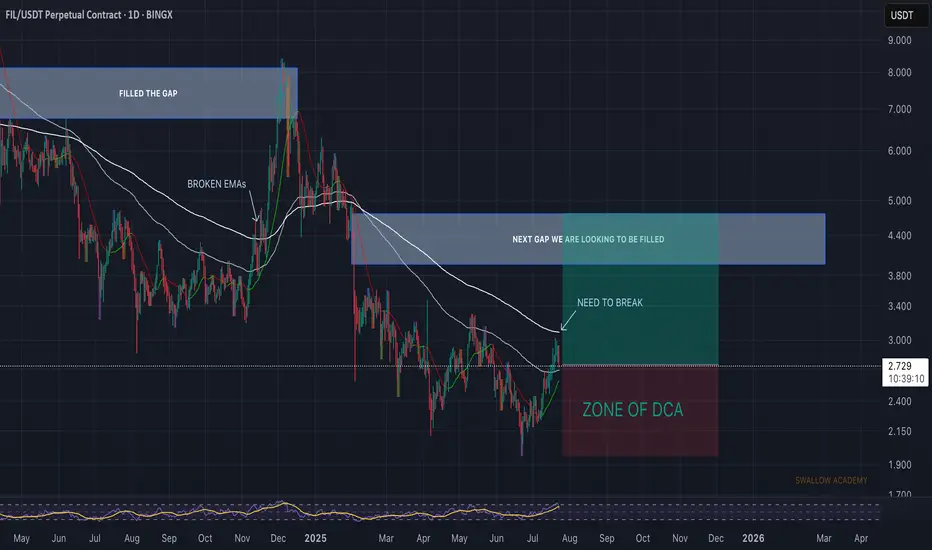
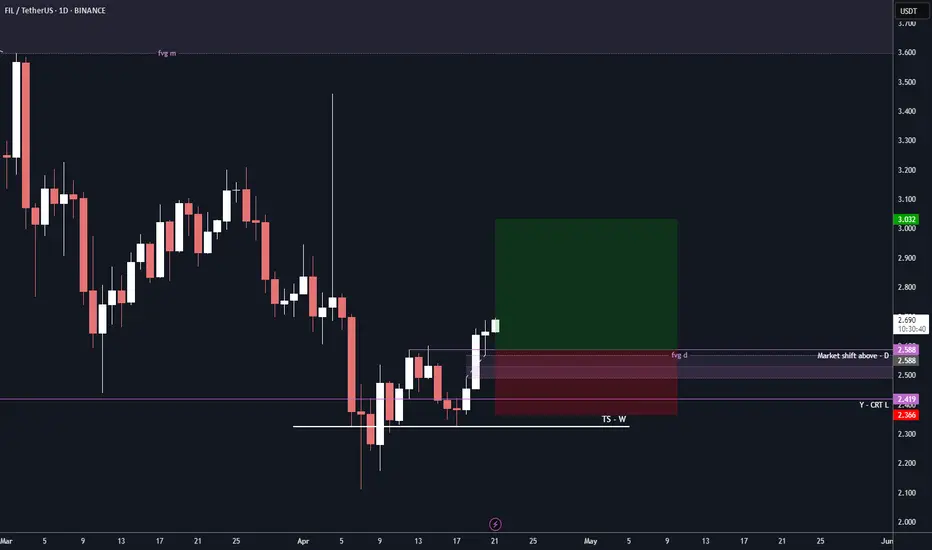
Filecoin (FIL): We Are About To Explode | Repeat of HistoryWe are seeing a good buyside movement to happen very soon, where we are seeing similar things to happen like last time, when we left a huge unfilled gap with downward movement.
We are seeing a good movement happening to upper zones so we are going to look for long from here.
Swallow Academy
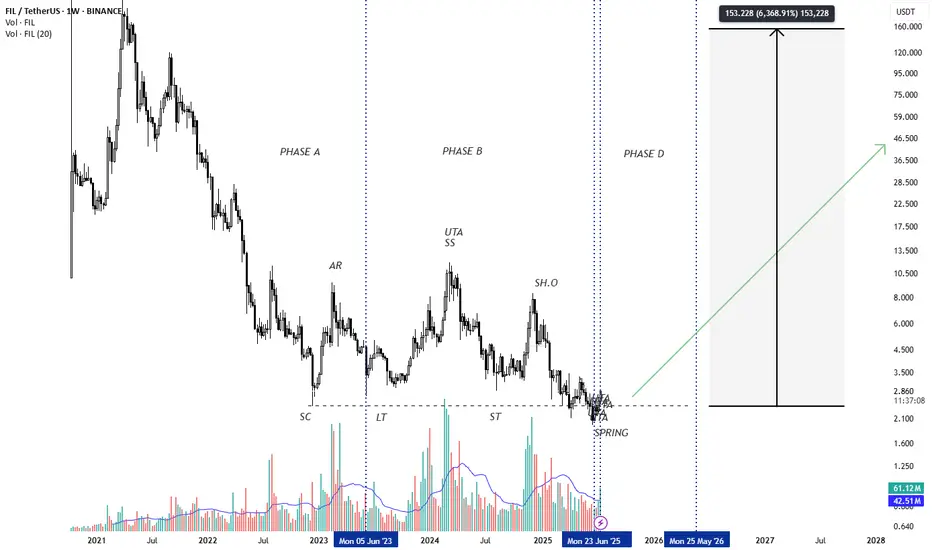
FILUSDTFormation of the Wyckoff structure and the beginning of the upward trend
BINANCE:FILUSDT
ARAM PISHBIN
filusdt is in uptrend i think it will be a very good trade and its a good point to risk my money
consider your own decision
it is just my own trade not your trade
hope it will hit the tp
Is there growth ahead?!Hello friends...
Filecoin is one of the high-potential cryptocurrencies in the market, it is currently in an attractive area.
It is suitable for a step purchase.
The growth of altcoins is happening one after another, I don't know if you have noticed it yet?
You have to be patient because it may start growing at some point and leave you behind in the market.
Follow our market page to see more analysis
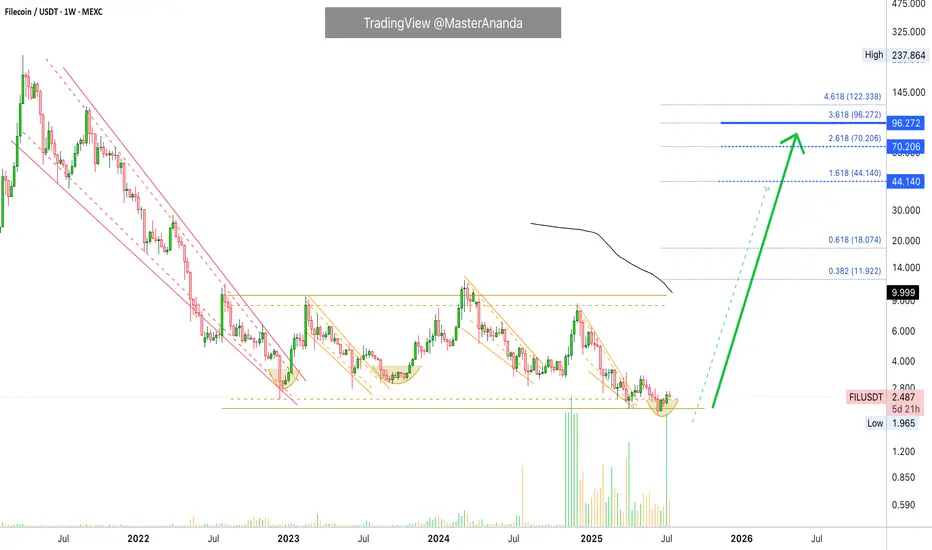
Filecoin Hits Bottom · 3 Years Long BD · Volume Signal · MACD &I think what is really nice about MEXC is that it truly reveals the bottom through volume. The changes in trading volume in this exchange are so pronounced that you can never go wrong. Look at Filecoin, extremely high volume in November 2024, right before a bullish wave. Then again, incredibly high volume last week, July 2025, right before a... Right before a major, major bullish wave, or else trading volume wouldn't be so high. It is this high because whales are buying with margin on this exchange.
Ok. A classic signal, 100% original. MA200 starts curving down strong; prices start to move up to meet this indicator, there will be a cross. So when MA200 starts diving deep down coming from a high point, the low is in, the bottom is in and the trend is about to change from bearish to bullish. Filecoin is about to start growing.
These are two signals, both very strong. Let's add another one. Bullish divergence with the MACD and RSI. Weekly, long-term. This makes these signals very, very strong.
FILUSDT weekly RSI hit bottom June 2022, in June 2025 (three years later) it produced a higher low.
FILUSDT weekly produced a major low December 2022, in June 2025 it produced a lower low. That's a strong divergence.
FILUSDT weekly MACD hit bottom February 2022. There is a extreme higher low in 2025 and also a bullish cross.
Needless to say, the bullish cross indicates the market is about to change. This matches the volume signal, the MA200 signal, marketwide action, the bullish divergence with the RSI, Ethereum and the rest.
Everything is bullish if you look deep enough. Bullish means potential for growth when prices are low. Bullish potential. That's what we are looking for. Filecoin is about to turn-up.
Namaste.
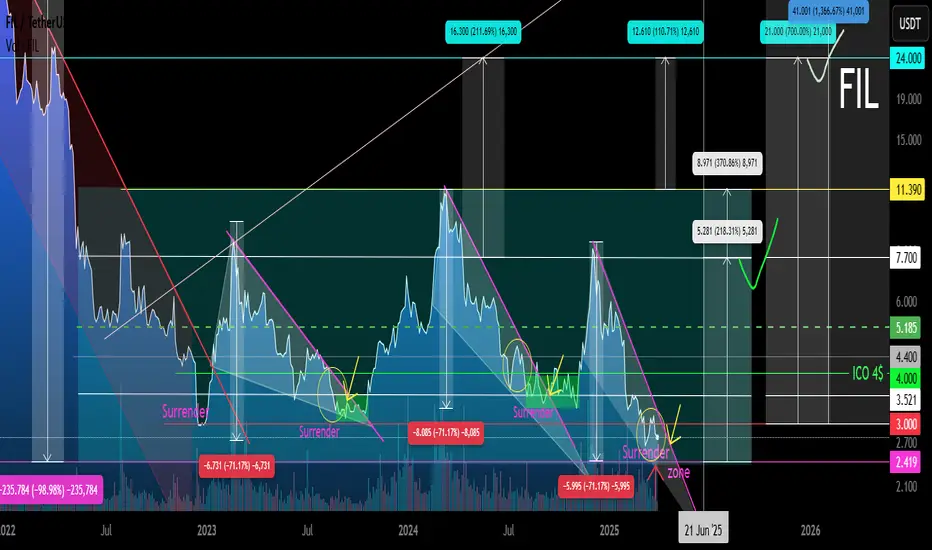
FIL Secondary trend. Channel zone. 31 03 2025Logarithm. Time frame 3 days (less is not needed).
Main trend. Time frame 1 week.
Published more than 2 years ago 22 01 2023
FIL/USD Main trend. From the maximum of $237 -99%
In the specified range, a horizontal channel with a large % step (exactly 370%) was formed earlier (2.590 - 7.157/10.7). There have already been 3 pumping waves in this channel. From the pumping highs in the main trend, the price fell by -98.98%
Secondary trend . This horizontal channel with a step of 370% and work with trend reversal formations.
Local trend , zone of formation of a descending wedge, zone of capitulation and trend reversal.
FIL/USDT Local trend. Wedge. Price clamping . 30 06 2024
Working now with the forming descending wedge and trend reversal in case of its breakthrough.
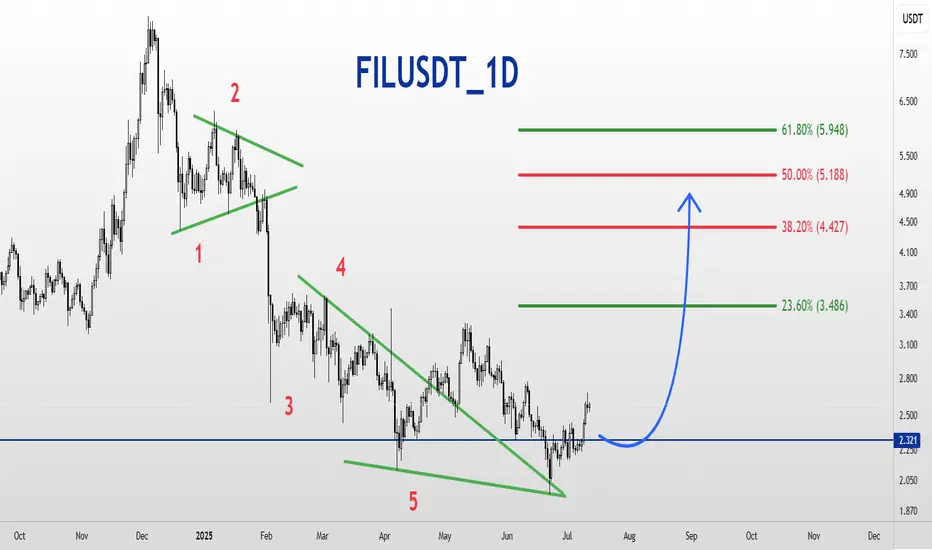
FILUSDT_1D_BuyFILUSDT Cryptocurrency Analysis Daily Medium and Long Term Time Frame Main Support 2.320 Targets 3.486 and 5.948
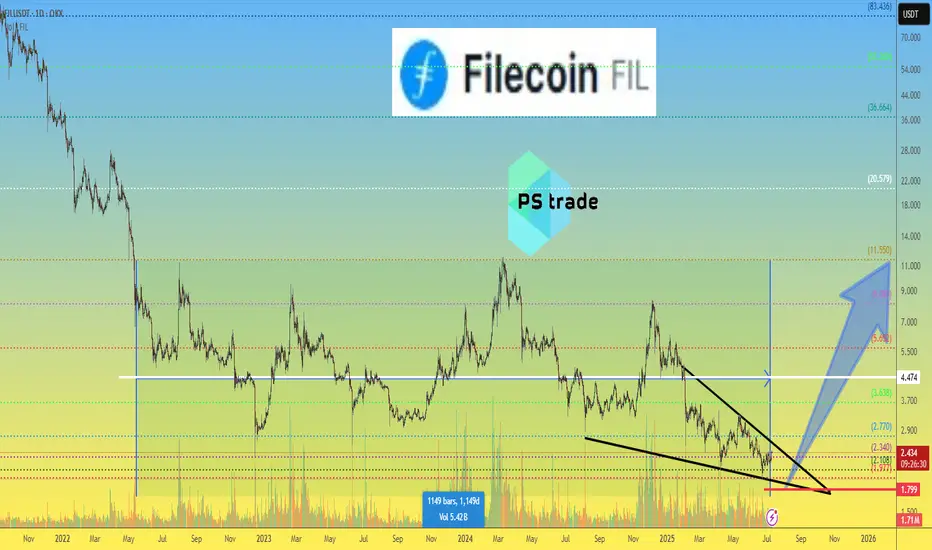
Filecoin FIL price analysis🪙 It would seem that #Filecoin is a “dinosaur” of the crypto market, having survived so many different cycles and “shocks,” whose fundamentals should only increase the annual application of the project, but no... it's not happening...
Looking at the OKX:FILUSDT chart, we see that the accumulation phase in the $2-11.50 range has been going on for over 1150 days, which means that another +/- 30-60 days of correction will not make a significant difference.
What can we say: we wish the holders patience and hope they wait for their moment of glory together with #FIL
🙂 And for those who want to test their luck and try to jump on the “last train” — place a “bucket” at $1.80 (any lower than that would be indecent)
Of course, if you believe that the price of #FILUSD will still be able to grow to at least $4.50 this year, and ideally to $11.50.
_____________________
Did you like our analysis? Leave a comment, like, and follow to get more
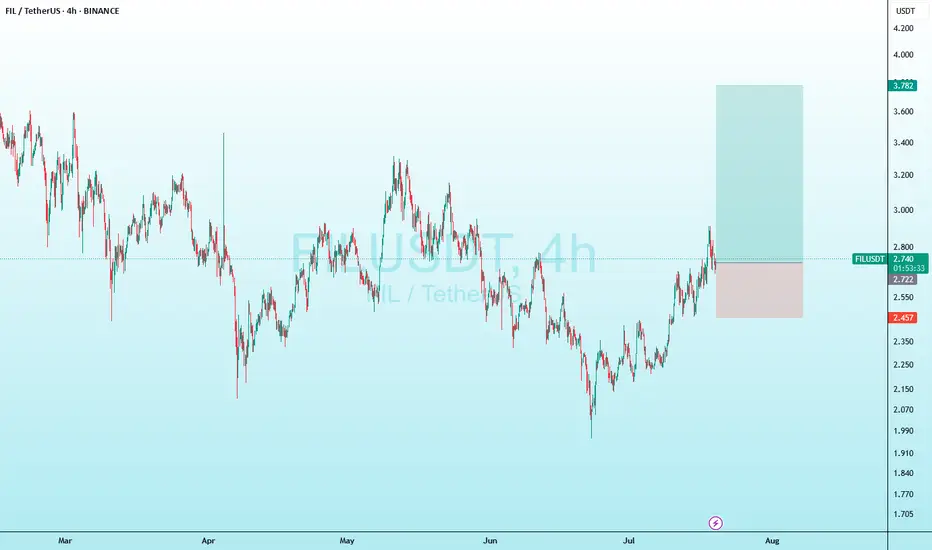
Bullish Sign FIL / USDTBreak and retest high and make a new higher low also there is a fake breakout on Weekly
Target : 3
Stop : 2.36
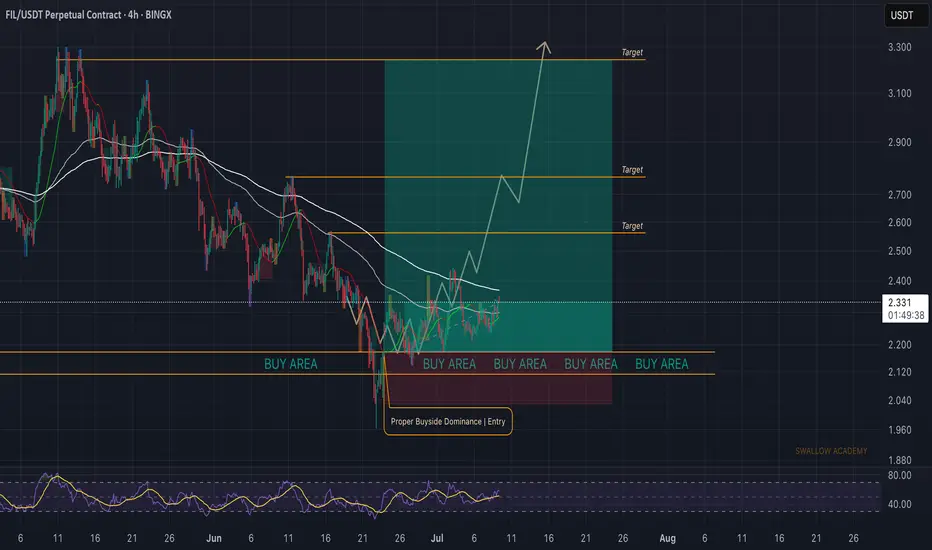
Filecoin (FIL): Easiest Prediction So Far | Risk:Reward 1:7 Our entry got triggered from last time when we were looking for the last liquidity sweep, which indicated that upcoming bullish movement might follow up, and that's exactly what has happened so far.
Buyers are dominating, and we are seeing good chances for our target to be filled; it is just a repeat of history...
Swallow Academy
FIL/USDT – Potential Breakout SetupFilecoin is currently forming a classic falling wedge pattern on the daily chart, signaling a potential bullish breakout. A successful breakout and hold above the wedge resistance could initiate a strong upward move.
Key upside targets to watch
$3.41
$4.39
$5.43
$6.27
$7.14
$8.42 🪽
This setup offers a favorable riskreward opportunity if confirmed by volume and price action. Monitor closely.
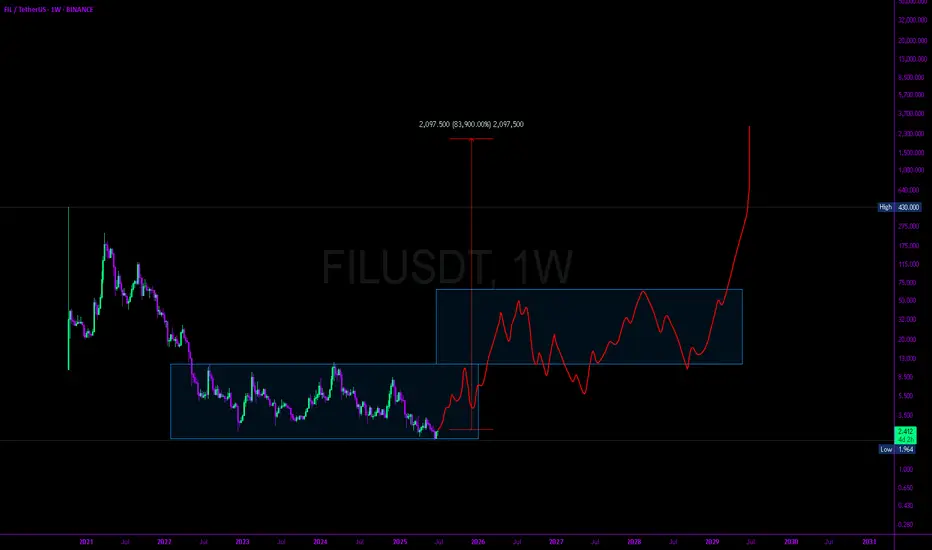
Filecoin to $2,100 Per ShareThis is Not Financial Advice.
I oftentimes have crazy speculative publications about charts. I don't know anything.
I want this to be published in the paint on the offchance that we do-do this style of bullmarket.
It will be good to see Filecoin out the basement!
I am always stacking Filecoin shares on spot and have been doing so for years.
Let's see how it plays out. I just drew this with my human hands in one swoop with my guts as a guide. It should work out perfectly.
Enjoy and Happy Trading,
Mr. Storm
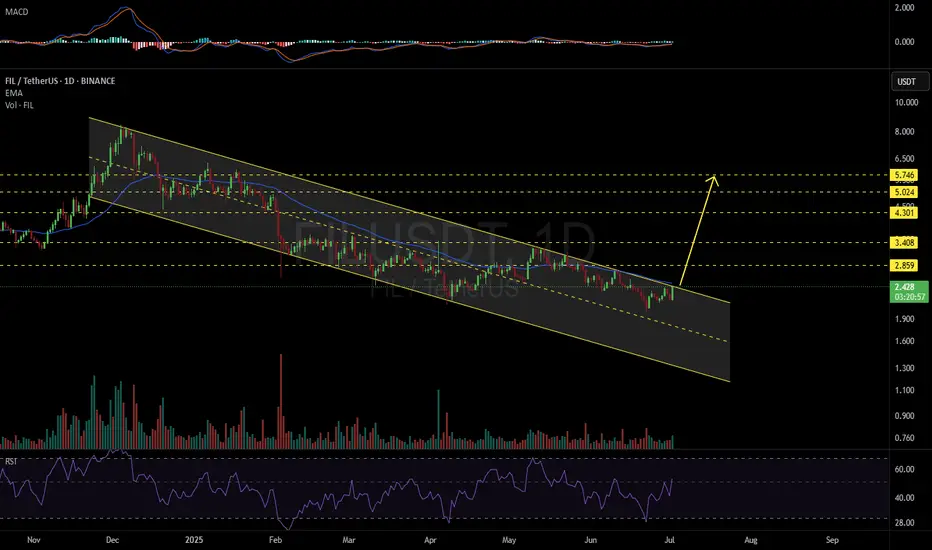
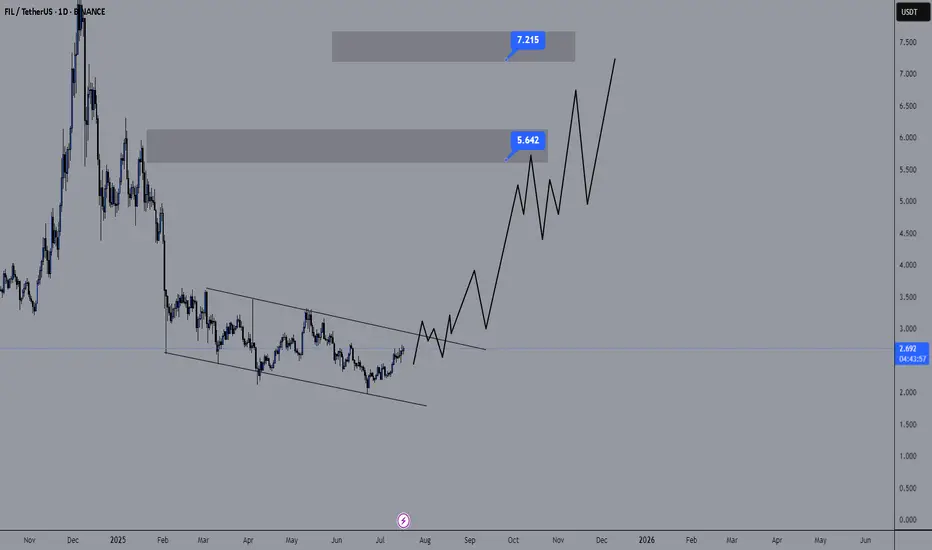
FILUSDT 1D#FIL has been accumulating inside a descending channel for a long time, and the chart now looks very promising.
Both RSI and MACD are signaling the beginning of a potential bullish move.
If a breakout occurs above the channel resistance and the daily EMA50, the upside targets are:
🎯 $2.859
🎯 $3.408
🎯 $4.301
🎯 $5.024
🎯 $5.746
⚠️ As always, use a tight stop-loss and apply proper risk management.