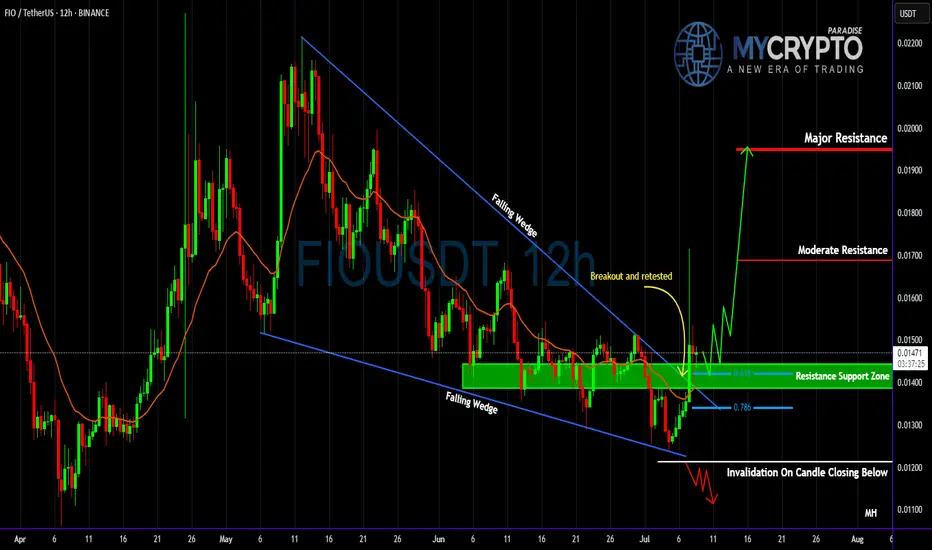
FIO Breakout: Is This the Calm Before a Massive Move or a Trap?Yello Paradisers! did you catch the breakout on #FIOUSDT or are you still sitting on the sidelines while opportunity unfolds? The recent move is shaping up to be a high-probability setup, but only for those who understand the market structure and know how to manage risk properly.
💎#FIO has been con
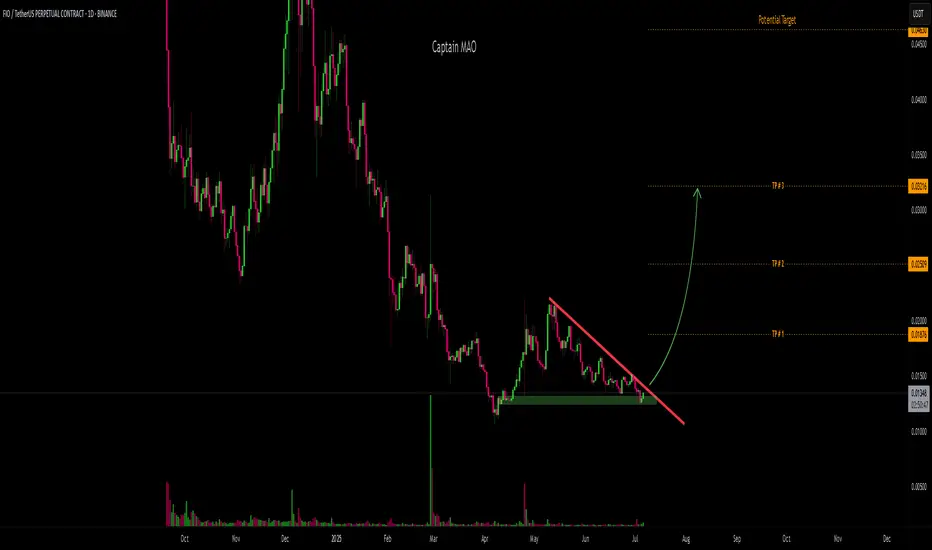
FIO/USDT Buy setupFIO rallied +90% in April 2025 from the key support zone at 0.011, confirming strong buyer interest. Since then, it has retraced 40% of the recent wave, now approaching a key demand zone.
Currently, price action is consolidating beneath a descending trendline — a breakout above this level could ign
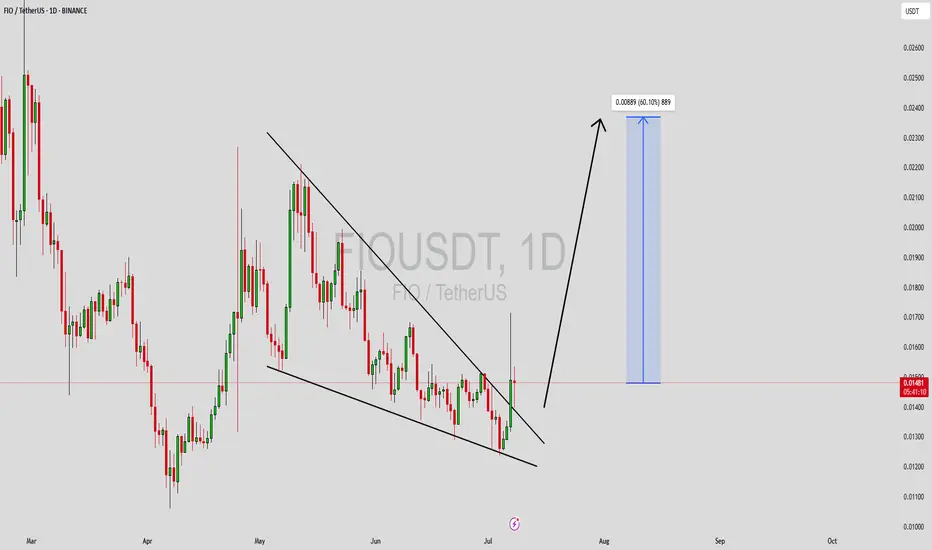
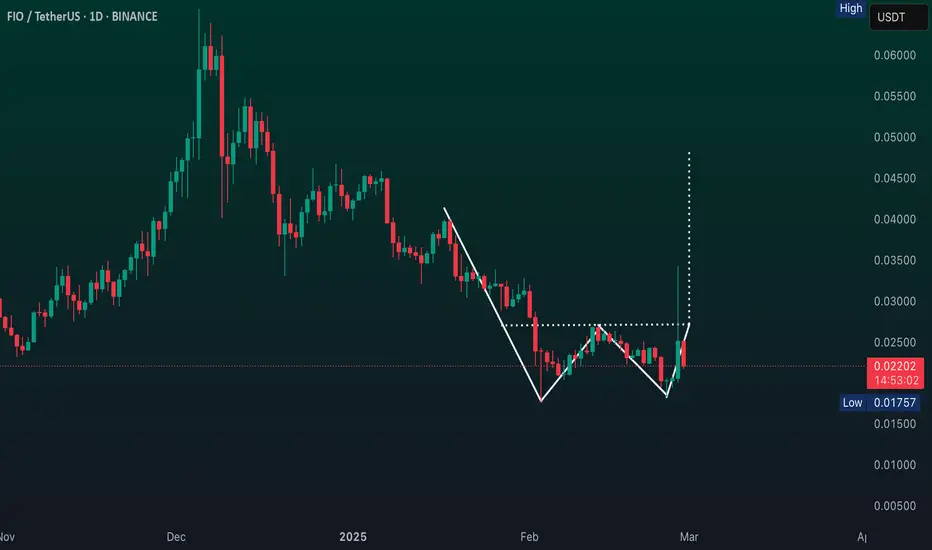
FIOUSDT Forming Falling WedgeFIOUSDT is starting to gain traction among crypto traders as it sets up a classic falling wedge pattern, which is widely known as a reliable bullish reversal indicator. After an extended downtrend, this pattern often signals that sellers are losing control and a potential upside breakout could be im
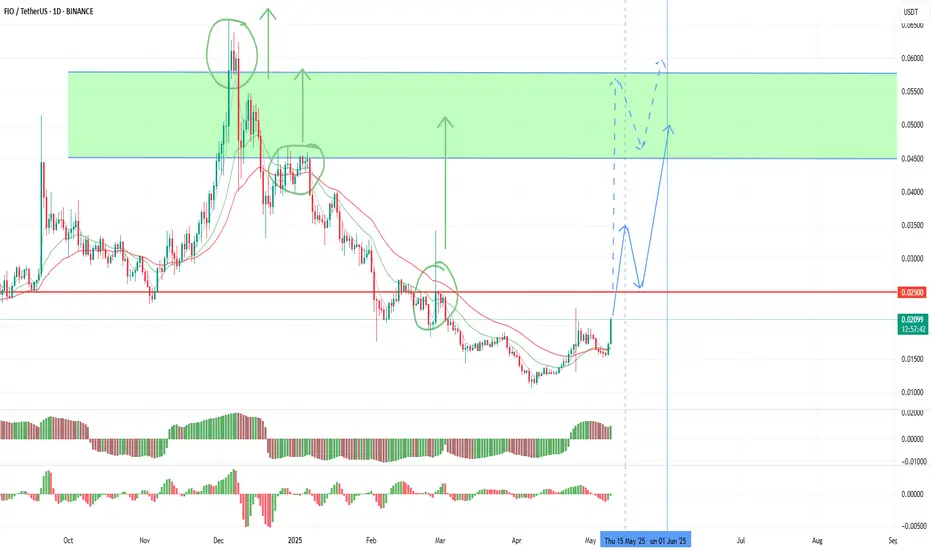
FIO is ready for the trendLarge-cap coins showed growth yesterday following the tops, and memcoin bullying is subsiding today, followed by a high probability of bullying in the remaining altcoin market. I expect the main day of growth tomorrow until Sunday afternoon, then the probability of a major pullback prevails until th
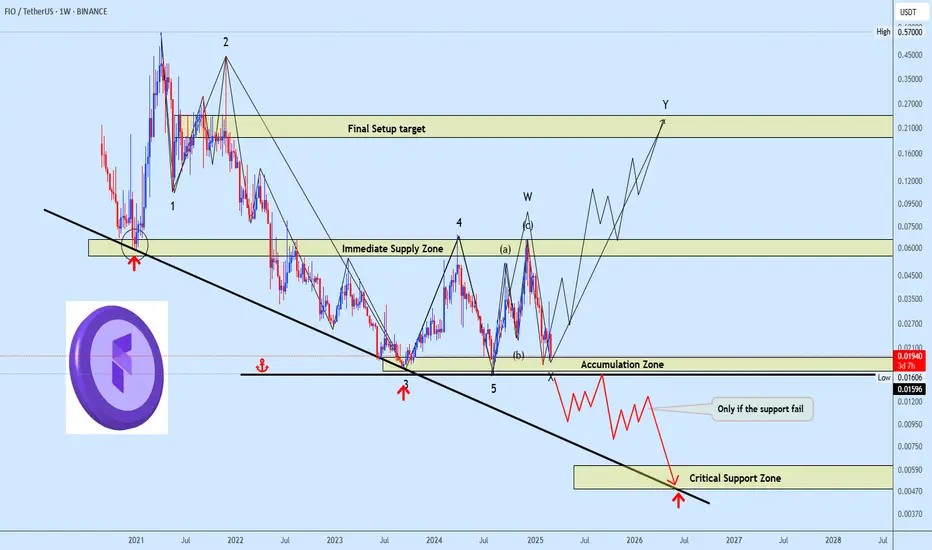
Fiousdt trading ideaFIOUSDT has completed a full five-wave impulse sequence, followed by a corrective ABC structure, aligning with Elliott Wave principles.
The price is now approaching the base level of wave 5, a crucial zone that could dictate the next structural move. If this level holds, the market is expected to
FIO UPDATE DAILY TIMEFRAME
FIO Protocol (FIO) is a decentralized, open-source usability solution that enables easier cryptocurrency transactions on all blockchains by replacing complex wallet addresses with a single, customizable, and human-readable Crypto Handle
ANY THOUGHTS ON $FIO ?
❤️ THIS POST AND WE WILL SHARE NE
FIOUSDT CHART ANALYSİS - EDUCATİONAL POSTWhy Track Insider Trading
Insider trading is one of the least known successful stock market anomalies. It’s managed to beat the market by an average of 7 percentage points annually over the past 50 years. Several peer-reviewed academic studies covering different time periods document the profitabi

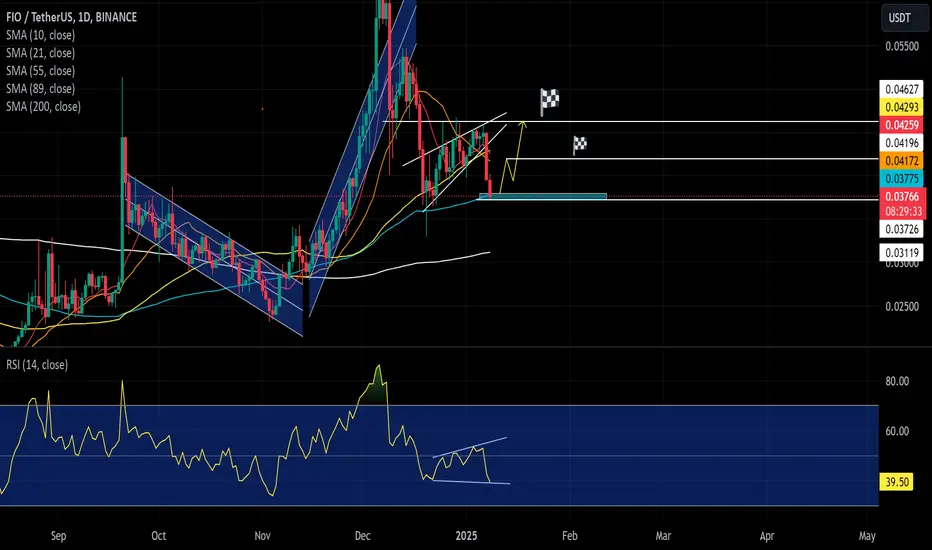
Fio"Analysis of FIOUSDT: Key focus on maintaining support at MA 89 and the 0.0375 zone. A false breakout above the ascending bearish channel followed by a pullback highlights the importance of confirming support before targeting higher levels."
FIO/USDT Chart Analysis FIO is trading at $0.04169, showing bullish momentum after bouncing off the 0.618 Fibonacci retracement at $0.03947. The price is forming a strong structure with clear upward targets.
Entry Zone (Long Here): $0.03947
Target 1 (T1): $0.05362
Target 2 (T2): $0.06521
Target 3 (T3): $0.07060

FIO - For a Small Correction before a BIG MOVE!FIO as mentioned on my Monthly Analysis, Still has time, for a 4hr chart move will take shorts and mentioned red doodle because usually it slips there to fall. Expecting not to cross POC, but wil cross high because to trap shorters

See all ideas
Summarizing what the indicators are suggesting.
Oscillators
Neutral
SellBuy
Strong sellStrong buy
Strong sellSellNeutralBuyStrong buy
Oscillators
Neutral
SellBuy
Strong sellStrong buy
Strong sellSellNeutralBuyStrong buy
Summary
Neutral
SellBuy
Strong sellStrong buy
Strong sellSellNeutralBuyStrong buy
Summary
Neutral
SellBuy
Strong sellStrong buy
Strong sellSellNeutralBuyStrong buy
Summary
Neutral
SellBuy
Strong sellStrong buy
Strong sellSellNeutralBuyStrong buy
Moving Averages
Neutral
SellBuy
Strong sellStrong buy
Strong sellSellNeutralBuyStrong buy
Moving Averages
Neutral
SellBuy
Strong sellStrong buy
Strong sellSellNeutralBuyStrong buy
Displays a symbol's price movements over previous years to identify recurring trends.