FISUSDT Forming Bullish WaveFISUSDT is currently showing an interesting bullish setup, capturing the attention of crypto traders who are watching for fresh altcoin opportunities. The formation of a bullish wave pattern, supported by steady volume, suggests that FIS could be primed for a strong breakout in the near term. Techni
FISUSDT Forming Bullish WaveFISUSDT is currently presenting an exciting opportunity for traders and investors who are tracking projects with strong breakout potential. The chart is showcasing a clear bullish wave pattern, a formation that often indicates an upcoming strong upward trend. This setup suggests that FIS could be ge

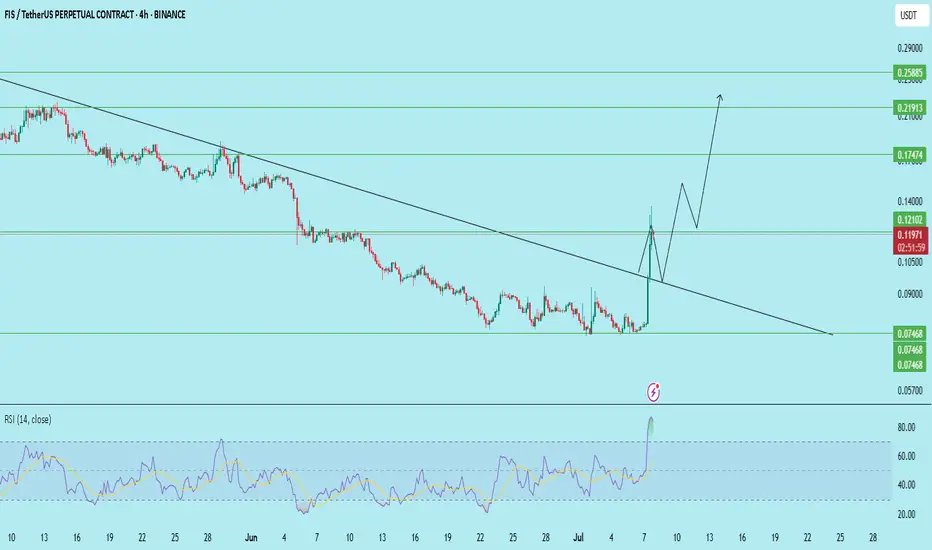
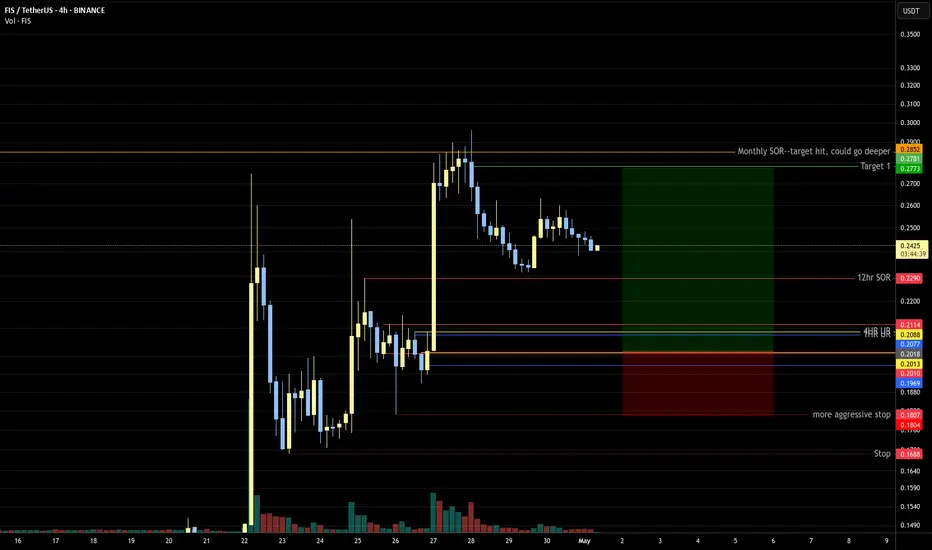
FIS/USDT – Long-Term Outlook (4H Chart)FIS has broken out of a steep downtrend with a strong bullish candle and sharp RSI spike, showing early signs of a potential long-term trend reversal.
Key Observations:
Downtrend resistance broken with volume
RSI exploded above 80, showing strong momentum
Price is currently retracing to the break
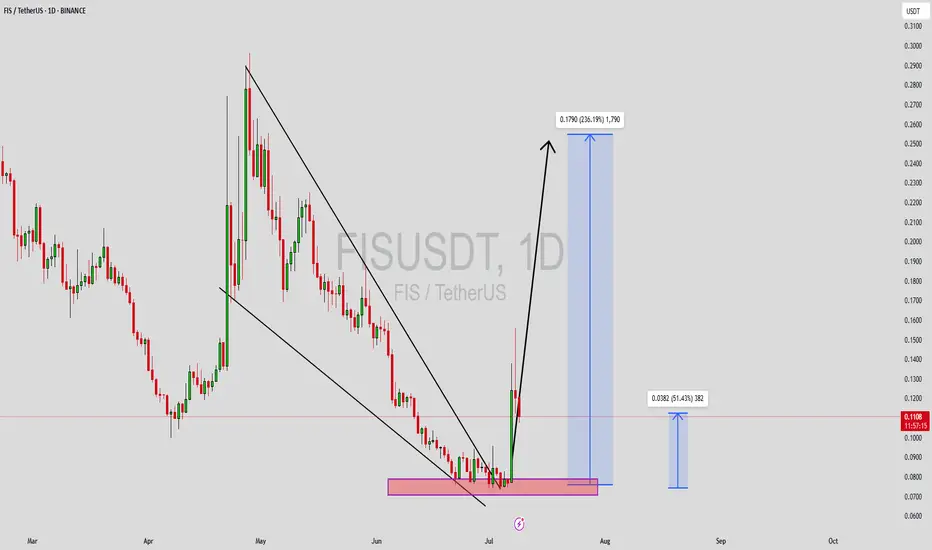
FISUSDT UPDATE
Pattern: Falling Wedge Breakout
Current Price: \$0.0811
Target Price: \$0.1416
Target % Gain: 75.47%
Technical Analysis: FIS has broken out of a falling wedge pattern on the 12H chart, with a strong bullish candle and increasing volume indicating a potential trend reversal. A breakout confirmation

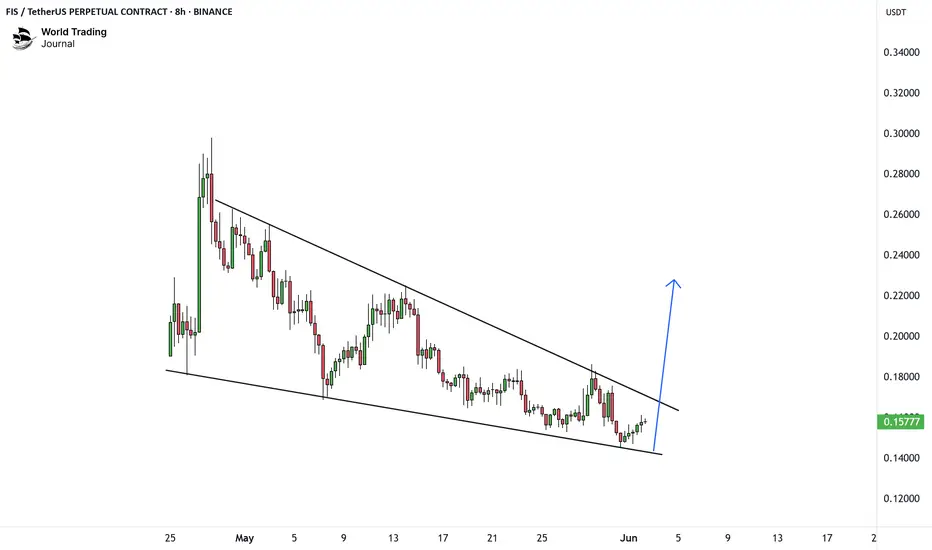
FISUSDT Forming Falling WedgeFISUSDT is currently displaying a classic falling wedge pattern, which is widely regarded as one of the most reliable bullish reversal signals in technical analysis. This pattern suggests that sellers are gradually losing their grip, while buying pressure is steadily building up inside this narrowin
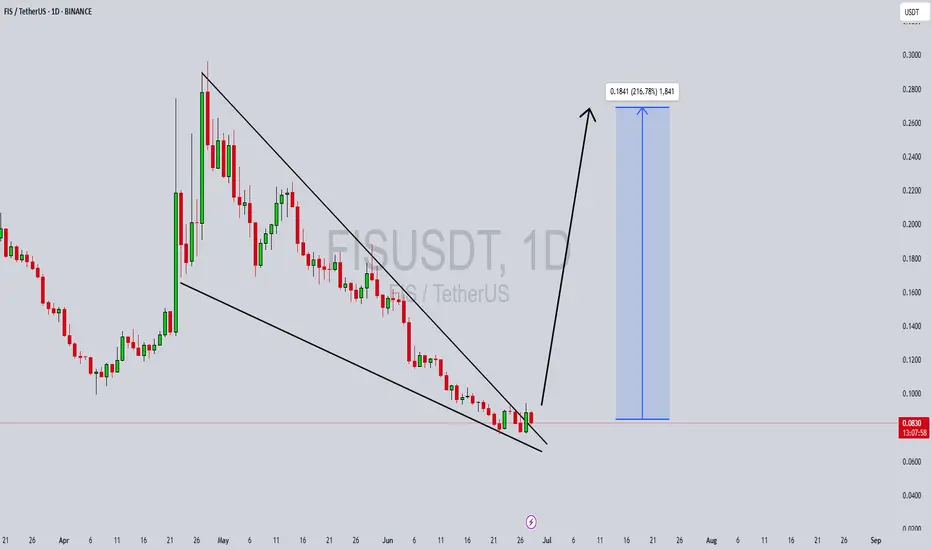
$FIS Falling Wedge Reversal Setup:
FIS is trading inside a falling wedge — a bullish reversal pattern. Current price action near the lower trendline indicates potential for a breakout to the upside.
🔸 Upside Target: 0.2500 – 0.3000
If the price breaks above the wedge (~0.1650), a move toward 0.20 and higher targets is likely, with
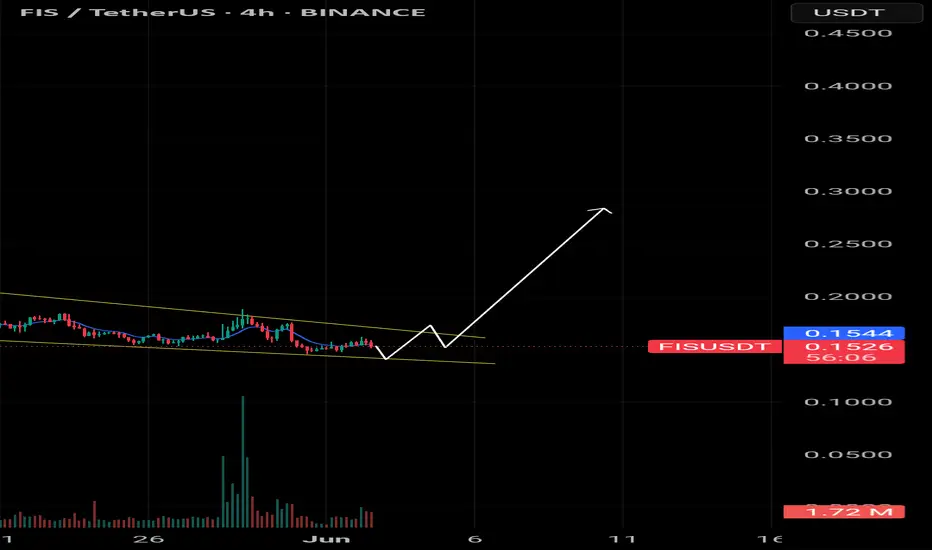
Chart speaks itself, huge reversal coming $FISChart speaks itself, huge reversal coming NYSE:FIS 📈⏳
let's send it higher 🤝
3.5 RREntry is a good risk:reward balance. Possible price hits target before fill, in that case, cancel the order!
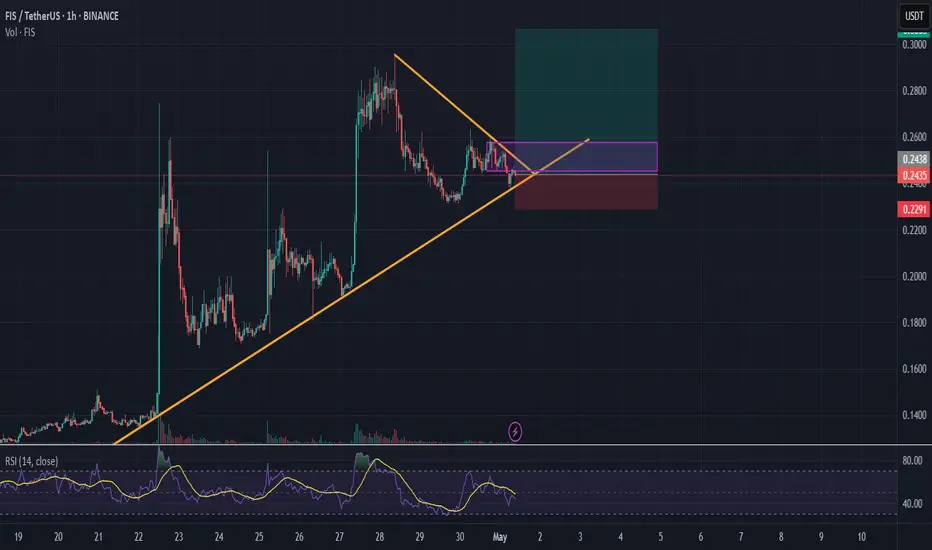
FIS/USDT Long Signal – Breakout Setup✅ Entry: 0.2437 USDT
🎯 Targets:
First Target: 0.2600 USDT
Second Target: 0.2750 USDT
Third Target: 0.2850 USDT
❌ Stop Loss: 0.2291 USDT
🧠 Analysis Explanation:
The price is consolidating within a symmetrical triangle and currently testing the breakout zone near dynamic support.
An upward break
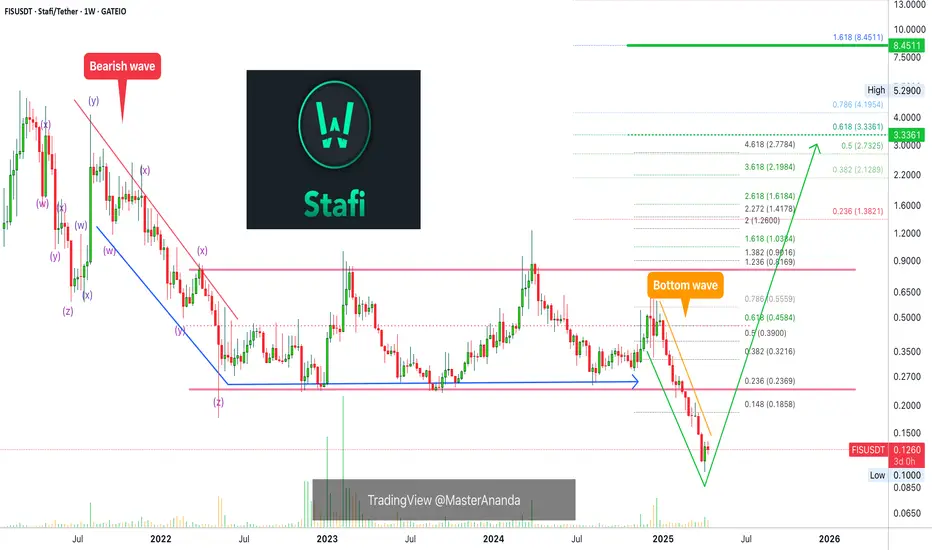
Stafi Long-Term PREMIUM Full Trade-Numbers (PP: 2063%)Stafi is now trading at bottom prices after hitting a new All-Time Low and this is a great place to enter. This is the perfect chart setup for spot traders.
Here I will share the full trade-numbers for this pair, FISUSDT, and share some of the chart technicals with you that reveal the upcoming chan
See all ideas
Summarizing what the indicators are suggesting.
Oscillators
Neutral
SellBuy
Strong sellStrong buy
Strong sellSellNeutralBuyStrong buy
Oscillators
Neutral
SellBuy
Strong sellStrong buy
Strong sellSellNeutralBuyStrong buy
Summary
Neutral
SellBuy
Strong sellStrong buy
Strong sellSellNeutralBuyStrong buy
Summary
Neutral
SellBuy
Strong sellStrong buy
Strong sellSellNeutralBuyStrong buy
Summary
Neutral
SellBuy
Strong sellStrong buy
Strong sellSellNeutralBuyStrong buy
Moving Averages
Neutral
SellBuy
Strong sellStrong buy
Strong sellSellNeutralBuyStrong buy
Moving Averages
Neutral
SellBuy
Strong sellStrong buy
Strong sellSellNeutralBuyStrong buy
Displays a symbol's price movements over previous years to identify recurring trends.