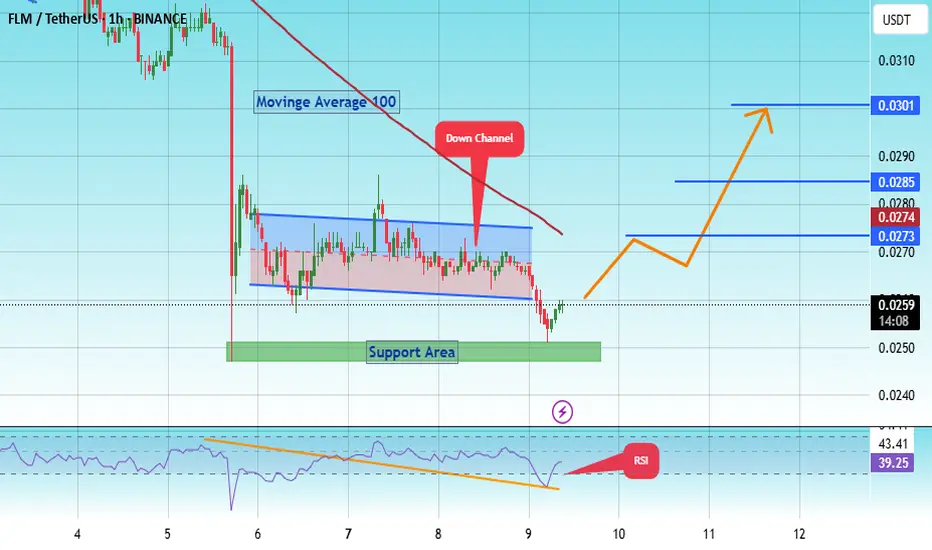
#FLM/USDT – Bullish Reversal Opportunity | 1H Chart #FLM
The price is moving within a descending channel on the 1-hour frame, adhering well to it, and is on its way to breaking it strongly upwards and retesting it.
We have a bounce from the lower boundary of the descending channel. This support is at 0.0257.
We have a downtrend on the RSI indicato
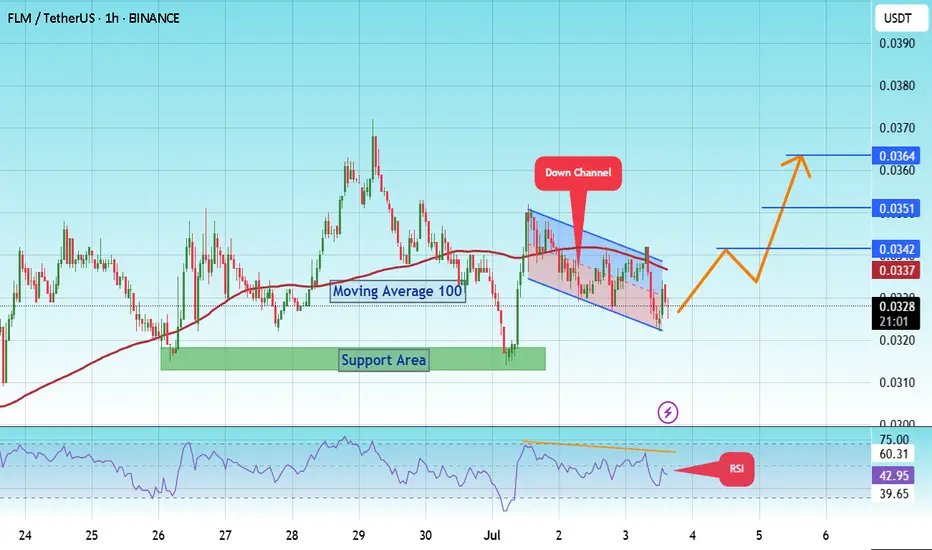
#FLM/Usdt Breakout ?#FLM
The price is moving within a descending channel on the 1-hour frame and is expected to break and continue upward.
We have a trend to stabilize above the 100 moving average once again.
We have a downtrend on the RSI indicator that supports the upward break.
We have a support area at the lowe
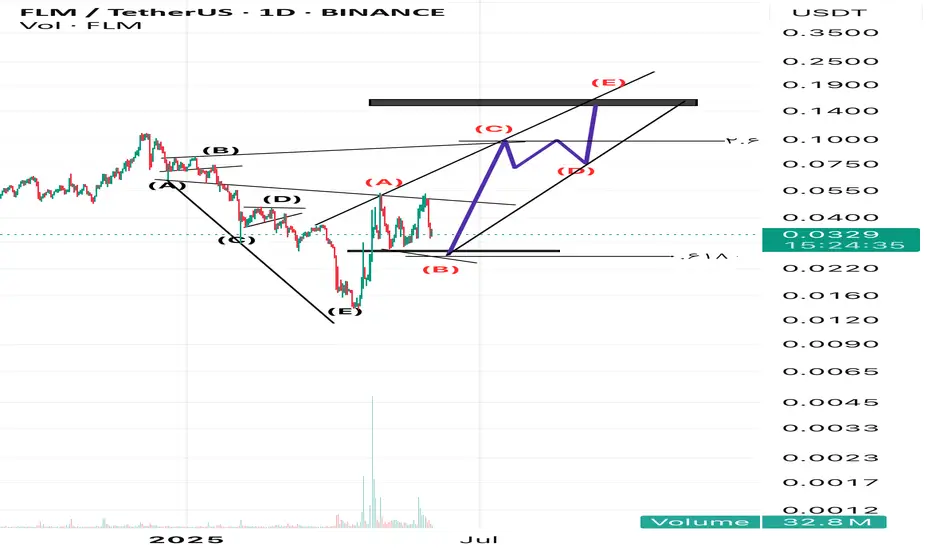
Flm usdt Neo wave analysis 🧐
Hello to every trader and analyst With the wave analysis of this currency at your service The mentioned symbol has entered an impulse movement, where wave 1 has formed an accelerated rally movement Wave 2 is formed as a triangle that can correct wave 1 to the level of 618 From t
FLM/USDT | 1H Timeframe FLM has recently completed a Bullish Butterfly Harmonic Pattern on the 1-hour chart, signaling a potential reversal from the D point. "
✅ Trade Idea:
Entry Zone: 0.0324 – 0.0330
Stop Loss: Below 0.0300 (structure invalidation)
Take Profit 1 (TP-1): 0.0371
Take Profit 2 (TP-2): 0.0416
⚠️ Risk Ma

FLM/USDT – Bullish Reversal Opportunity | 1H Chart AnalysisFLM has completed a bullish harmonic pattern and formed a strong base around $0.0300–$0.0324, showing signs of accumulation. A breakout above the range suggests a potential bullish move.
📌 Entry: $0.0324
🎯 Target (TP-1): $0.0371
🎯 Final Target: $0.0414
🛡️ Stop Loss: $0.0279
RSI shows bullish dive

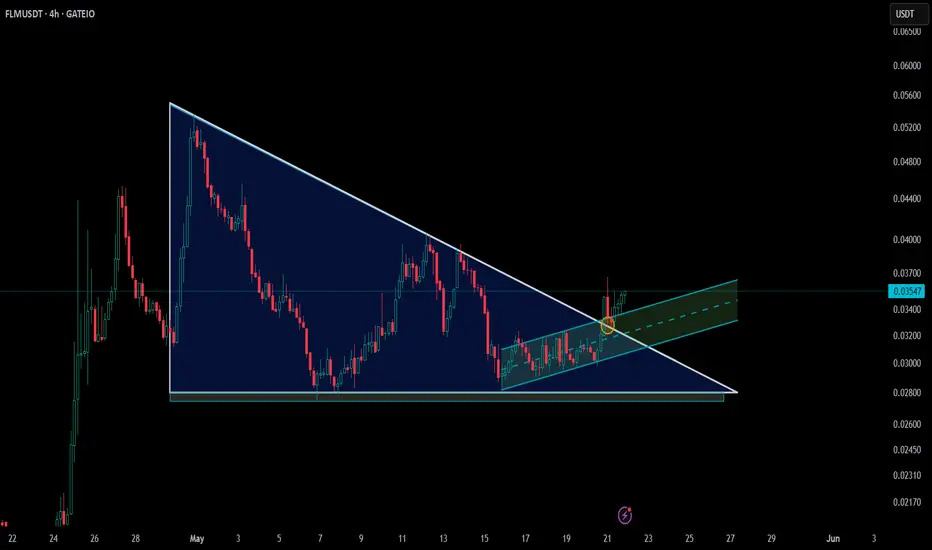
FLM Breaking Out of Descending Triangle – Bullish Momentum Ahead🔥 CSE:FLM – Breakout in Play
On the 4H timeframe, FLM is breaking out of a descending triangle — a structure that often leads to upward moves when broken to the upside 🔺
The retest looks clean, showing signs of bullish strength from buyers 🟢
If momentum continues, FLM could be setting up for a s
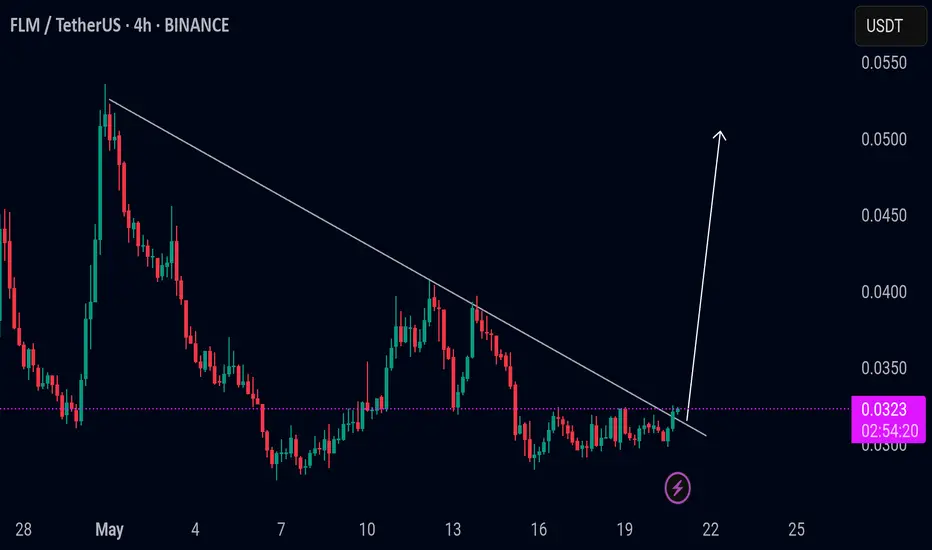
Flm/Usdt BreakoutFLMUSDT:
FLM is now trading around $0.0323. FLM already broke out of the trend line on the 4-hour timeframe and looks bullish. So, the possible scenario, according to the pattern, is bullish momentum in FLM, and it could pump up to 20–30%. Otherwise, if it dumps and trades inside the triangle agai
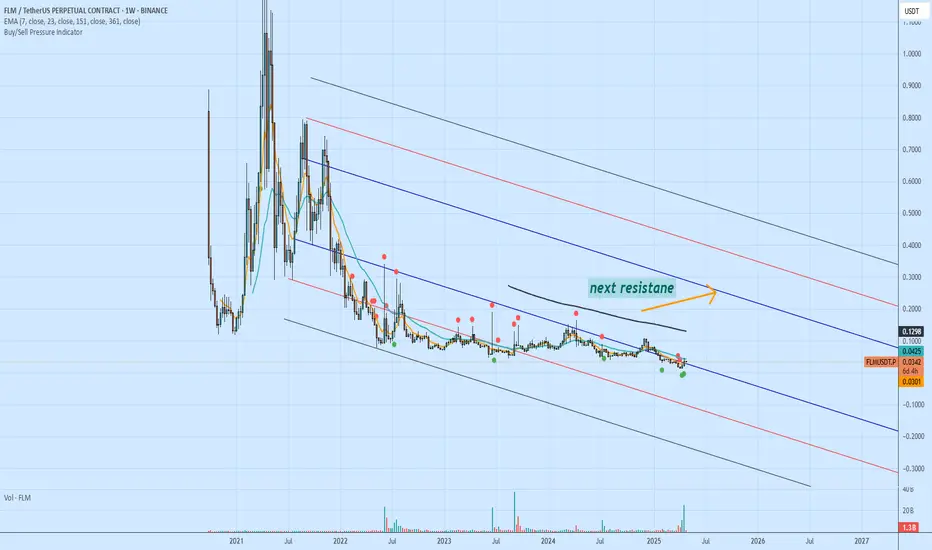
$BINANCE:FLMUSD : new setup flamingo tokenBINANCE:FLMUSD flamingo token is brok first resistance and we can see next level of resistance in pitchfork
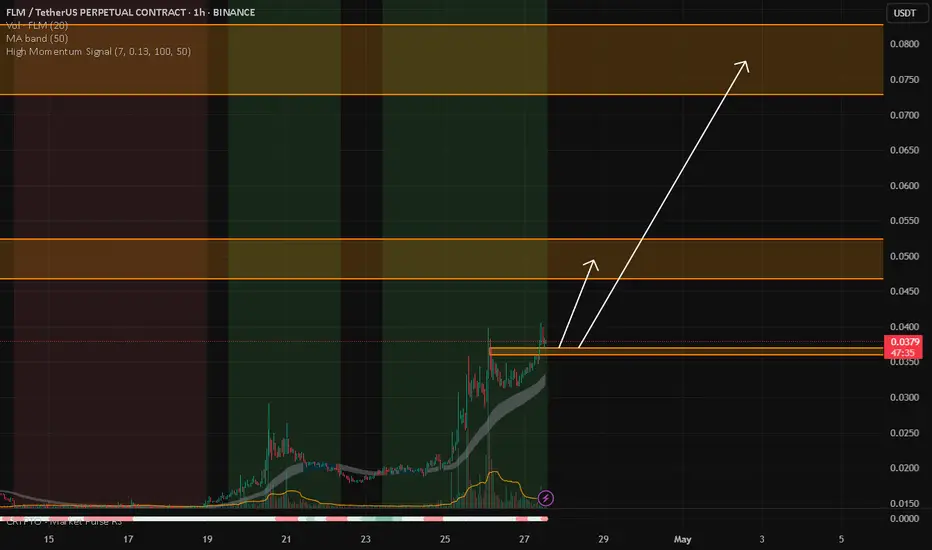
FLM/USDTKey Level Zone: 0.0360 - 0.0370
HMT v8.1 detected. The setup looks promising, supported by a previous upward/downward trend with increasing volume and momentum, presenting an excellent reward-to-risk opportunity.
HMT (High Momentum Trending):
HMT is based on trend, momentum, volume, and market str
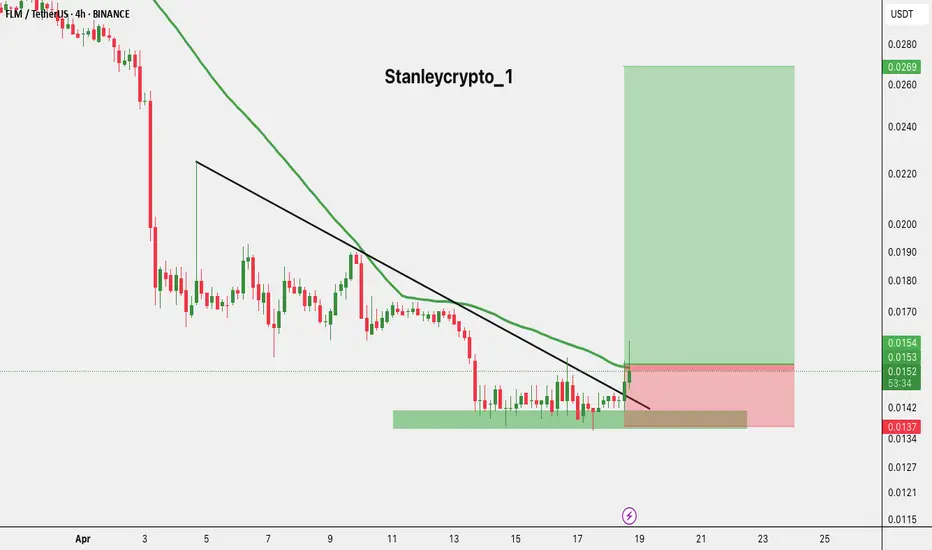
$FLM/USDT Breakout AlertAfter a strong accumulation phase, CSE:FLM just broke out of a descending trendline with volume confirmation!
Entry: 0.0154
SL: 0.0137
Target: 0.0269
Price broke above the trendline + 50ema, signalling a potential trend reversal.
Bullish momentum is building; eyes are on the next key level!
Are
See all ideas
Summarizing what the indicators are suggesting.
Oscillators
Neutral
SellBuy
Strong sellStrong buy
Strong sellSellNeutralBuyStrong buy
Oscillators
Neutral
SellBuy
Strong sellStrong buy
Strong sellSellNeutralBuyStrong buy
Summary
Neutral
SellBuy
Strong sellStrong buy
Strong sellSellNeutralBuyStrong buy
Summary
Neutral
SellBuy
Strong sellStrong buy
Strong sellSellNeutralBuyStrong buy
Summary
Neutral
SellBuy
Strong sellStrong buy
Strong sellSellNeutralBuyStrong buy
Moving Averages
Neutral
SellBuy
Strong sellStrong buy
Strong sellSellNeutralBuyStrong buy
Moving Averages
Neutral
SellBuy
Strong sellStrong buy
Strong sellSellNeutralBuyStrong buy
Displays a symbol's price movements over previous years to identify recurring trends.