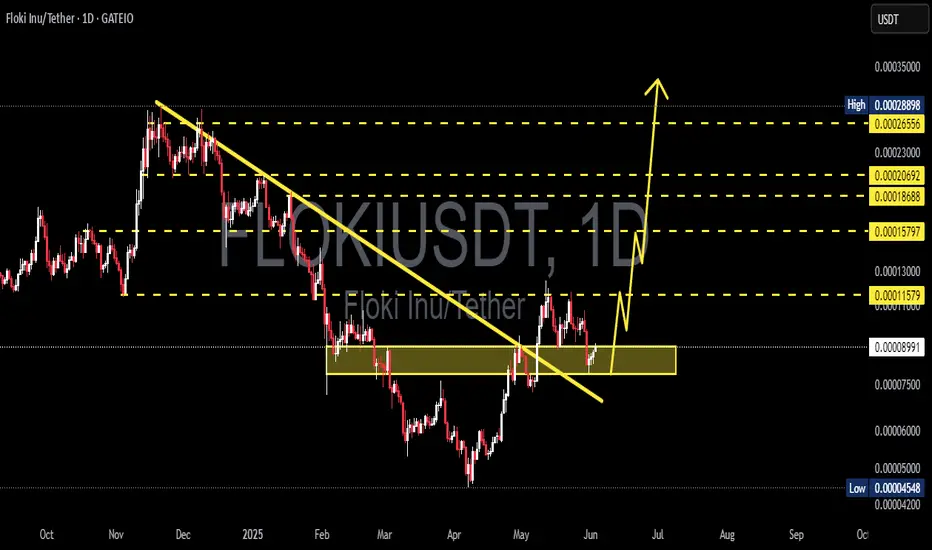
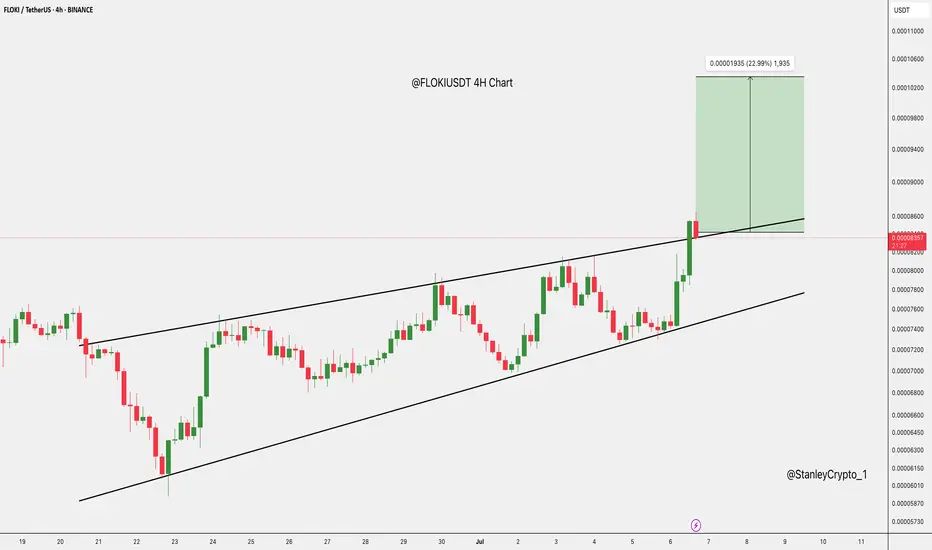
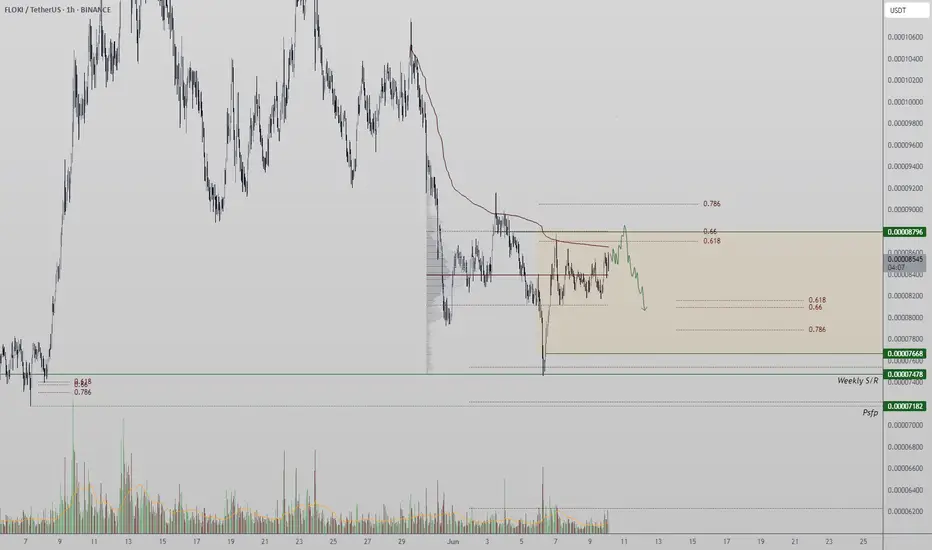
Floki Eyes Explosive 18% Rally Toward 0.00010 Resistance LevelHello✌
All previous targets were nailed ✅! Now, let’s dive into a full analysis of the upcoming price potential for Floki 🔍📈.
BINANCE:FLOKIUSDT has recently stabilized within a newly developed ascending channel following a series of sharp pullbacks. Price is currently hovering near a significant daily support zone, which may serve as a strong base for a potential bullish reaction. I’m watching for an upward move of around 18%, with a short-term target at 0.00010. 📊🚀
✨ Need a little love!
We pour love into every post your support keeps us inspired! 💛 Don’t be shy, we’d love to hear from you on comments. Big thanks , Mad Whale 🐋
FLOKIUSDT.P trade ideas
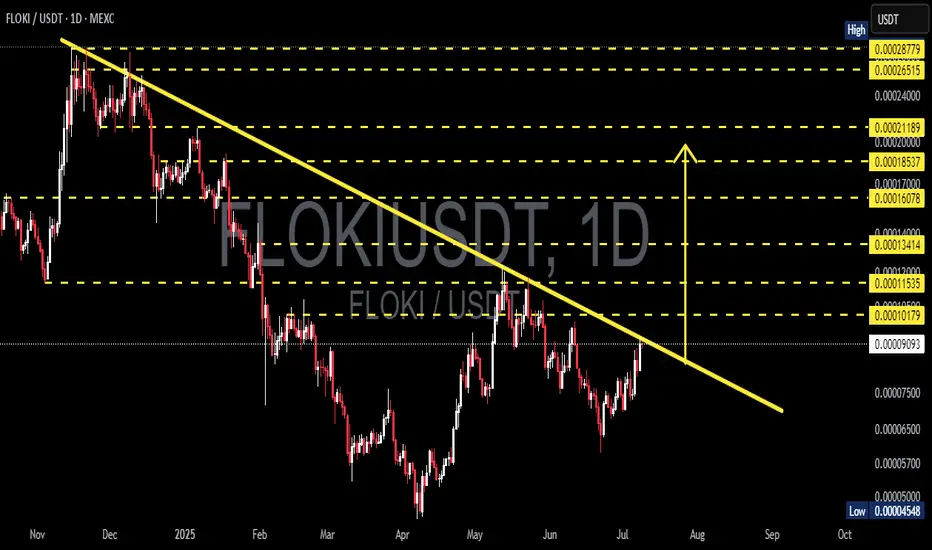
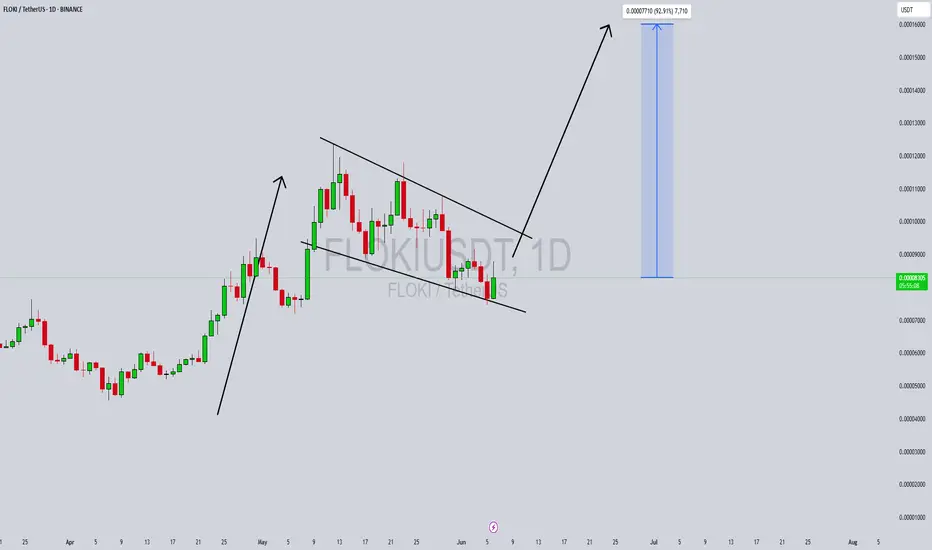
FLOKI/USDT — Major Breakout Incoming? The Calm Before a BullishThe daily chart of FLOKI/USDT reveals a highly compelling technical setup. After a prolonged downtrend that started in late 2024, FLOKI is now testing a key descending trendline — signaling a potential trend reversal and the beginning of a new bullish phase if a breakout is confirmed.
📊 Detailed Technical Analysis:
🔍 Pattern Formation:
Descending Trendline Resistance: Acting as a dynamic resistance since the November 2024 high, capping every major rally attempt.
Consistent Higher Lows: Since March 2025, FLOKI has been forming a series of higher lows — an early bullish sign of accumulation.
Volatility Squeeze: Recent candles are consolidating near the apex of the triangle, suggesting a breakout move is imminent.
Bullish Structure Forming: A successful breakout would complete a bullish reversal pattern on the daily chart.
🟢 Bullish Scenario (Breakout Confirmation):
If the price closes above 0.0001079 on the daily timeframe and confirms a clean breakout above the descending trendline, we can anticipate an extended move to the upside.
🎯 Key upside targets based on historical resistance zones:
1. Target 1: 0.00011535 → Previous minor resistance
2. Target 2: 0.00013414 → March 2025 supply zone
3. Target 3: 0.00016078 → Strong horizontal resistance
4. Target 4: 0.00020000 → Major psychological level
5. Target 5: 0.00028779 → Previous swing high (November 2024)
💥 A full breakout move to the top could offer over 200% potential upside, making it a high-reward setup for well-managed long entries.
🔴 Bearish Scenario (Rejection):
If FLOKI fails to break above the descending trendline:
⚠️ We could see a retracement to lower support levels:
Minor Support: 0.00007500
Key Support: 0.00005700
Last Defense: 0.00004548 → Previous cycle low
A breakdown below these support levels would invalidate the bullish setup and shift momentum back in favor of the bears.
🧠 Pro Tips:
Watch for Volume Confirmation during the breakout — high volume adds credibility.
Focus on Body Closes, not just wicks, when identifying valid breakouts.
Manage Risk Wisely — a stop loss just below the trendline offers solid risk-to-reward.
📅 Conclusion:
FLOKI/USDT is at a critical technical juncture. A confirmed breakout above the descending trendline could spark a strong bullish trend, while a rejection may lead to deeper correction or consolidation.
💡 The next few candles will likely determine the medium-term direction for FLOKI.
#FLOKI #FLOKIUSDT #AltcoinBreakout #CryptoSetup #TechnicalAnalysis #BullishCrypto #BreakoutTrade #TrendReversal #CryptoSignals
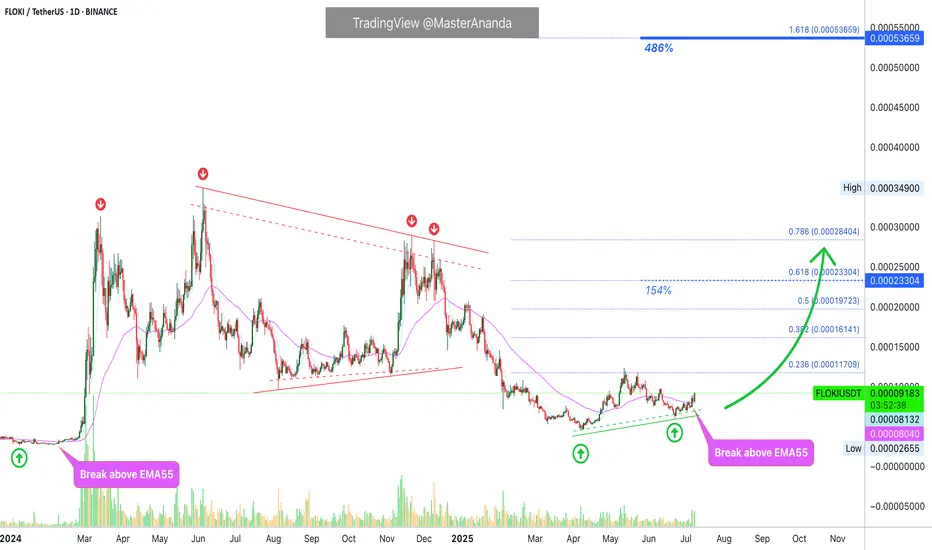
Floki Inu Bullish Signal Fully Confirmed (486% Easy Potential)The last time FLOKIUSDT moved above EMA55 daily, it produced a bullish wave exceeding 1,250% profits, within months. This same signal, the same development is happening now after years of bearish action and months of consolidation. In short, a very strong bullish reversal signal is now present on the chart.
To be honest, that's all there is. More information can just get things confused but, let's proceed.
The downtrend ends and we enter a transition period.
The transition is over and we enter an uptrend. That's all there is. Floki Inu is set to grow.
The bullish bias is already confirmed. As FLOKI now trades above EMA55, trading volume continues to increase. The chart structure is also perfect for a bullish wave. The last major low is still a long-term higher low compared to the bottom prices before the 2024 bullish wave.
Unlike in the past, there is no need to wait for months for this jump to come to be. Floki will start moving within weeks, maximum. It is possible that the next bullish wave goes into full force within days. The entire altcoins market has been consolidating long enough. The time is now.
Thanks a lot for your continued support.
Namaste.
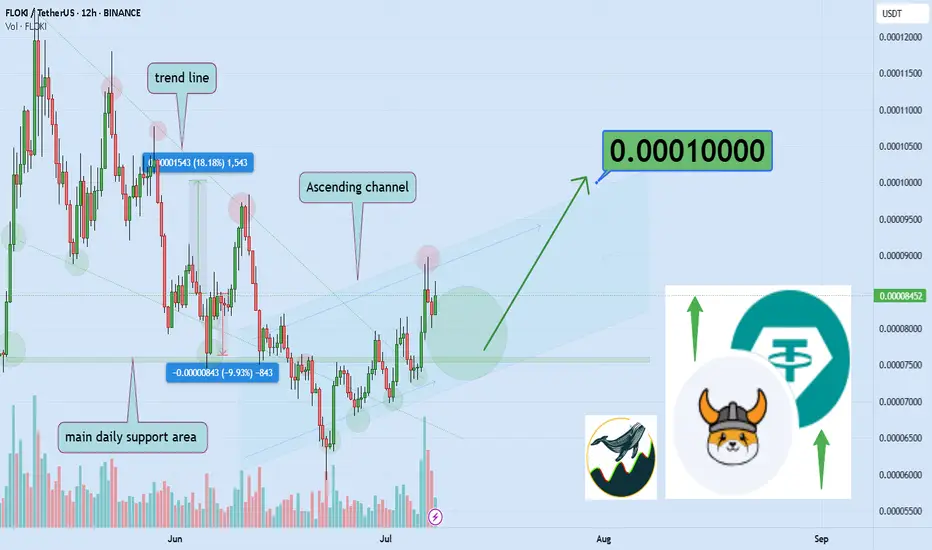
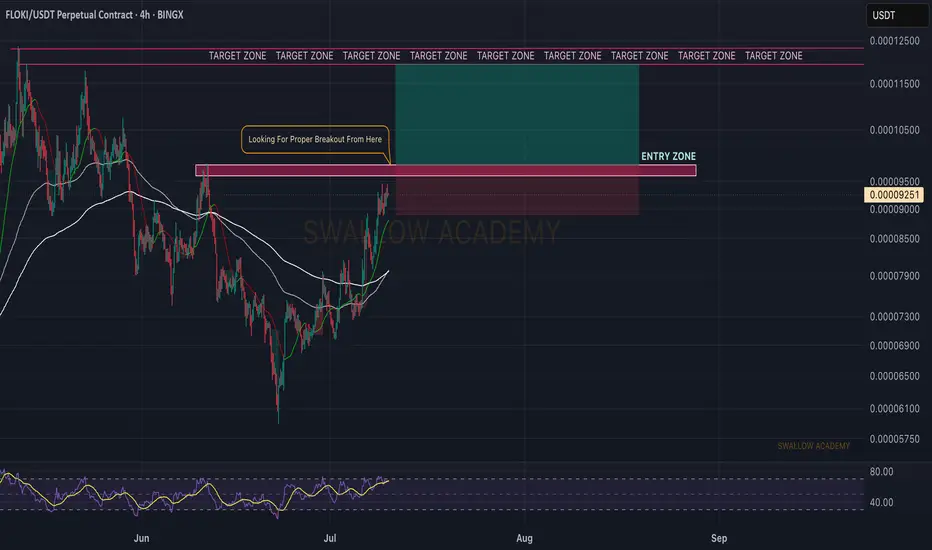
Floki (FLOKI): Looking For Buy Entry | Aiming For +22%Floki has been in a healthy bullish trend here after buyers overtook the zone of EMAs. With current momentum on markets, we might see a proper breakout from the local resistance area, which is marked as our entry as well.
As soon as we see a breakdown there, we are going to go into a long position, but keep in mind—there is a huge bearish CME gap that we have to pay attention to, as if we see any strong sell-off, then this would be our target for short.
Swallow Academy
$FLOKI/USDT Breakout Reloading.SEED_DONKEYDAN_MARKET_CAP:FLOKI is holding strong above the breakout zone after retesting key support.
As long as it stays above, the setup looks bullish with a potential upside toward 0.00010800 (+27%).
The structure remains solid, eyes on the next breakout move.
DYOR, NFA
FLOKIUSDT Forming Descending ChannelFLOKIUSDT is attracting serious attention as it breaks out of a clear downward channel, showing strong signs of a potential reversal with significant upside. The recent price action indicates that FLOKI has overcome key resistance within the descending channel, hinting at a trend shift supported by increasing trading volume. This renewed buying pressure suggests that investors are positioning themselves for what could be an impressive move upward.
Currently, FLOKIUSDT is poised to target gains of 70% to 80%+, making it one of the meme coins with a strong technical structure to watch closely. The breakout setup aligns with historical patterns where meme coins like FLOKI experience rapid surges once investor sentiment flips bullish. With growing community interest and positive social sentiment, FLOKI could ride this wave and reach new short-term highs if momentum continues to build.
For traders looking to capitalize on trending meme coins with solid chart setups, FLOKIUSDT offers an appealing risk-to-reward ratio. Key price levels to watch include maintaining support above the breakout point and confirming higher lows on the daily timeframe. Keeping an eye on volume spikes and community updates will be crucial in managing entries and exits during this anticipated uptrend.
✅ Show your support by hitting the like button and
✅ Leaving a comment below! (What is You opinion about this Coin)
Your feedback and engagement keep me inspired to share more insightful market analysis with you!
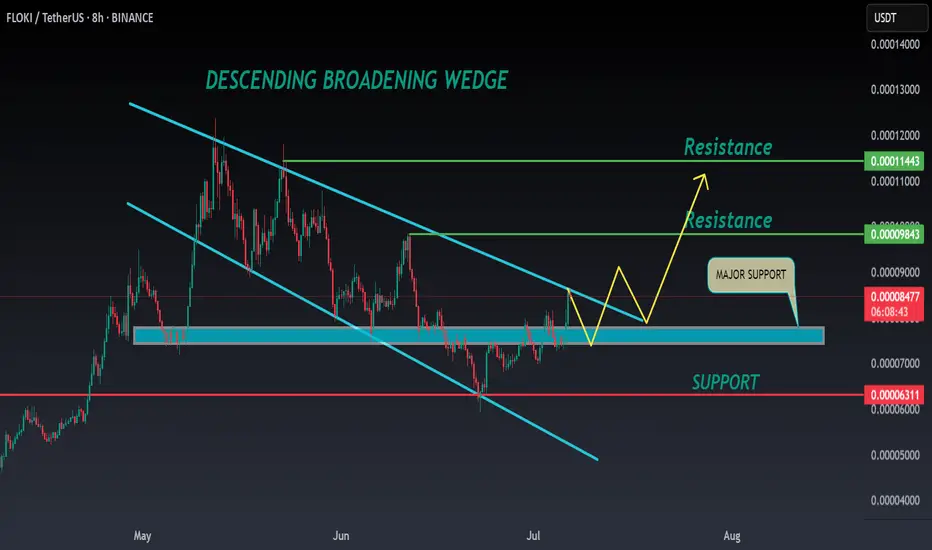
FLOKI ANALYSIS🔮 #FLOKI Analysis 🚀🚀
💲💲 #FLOKI was trading in a Descending Broadening Wedge Pattern, and trying to breakout the pattern. Also there is a instant support zone and after the breakout of resistance zone we will see a bullish move. 📈📈
💸Current Price -- $0.00008540
📈Target Price -- $0.00009840
⁉️ What to do?
- We have marked crucial levels in the chart . We can trade according to the chart and make some profits. 🚀💸
#FLOKI #Cryptocurrency #Breakout #DYOR
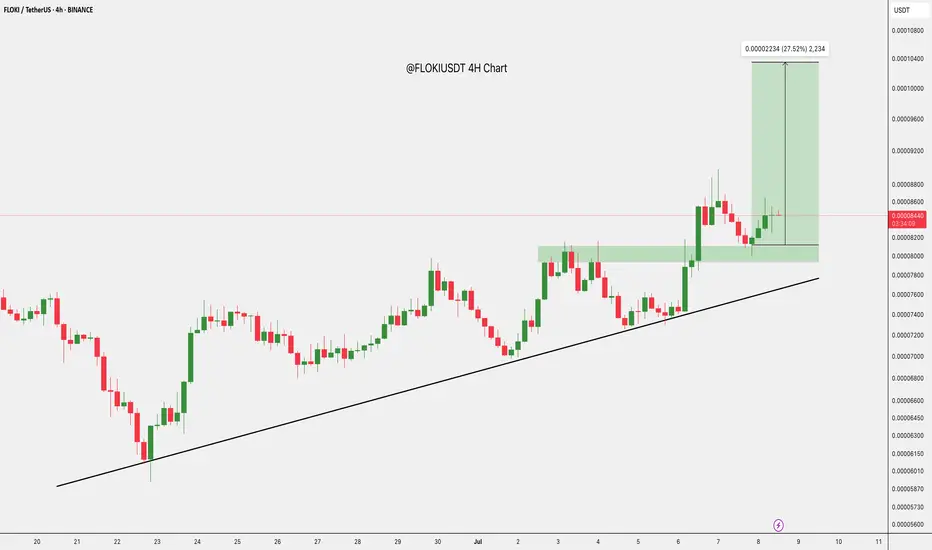
$FLOKI Breakout Ahead?SEED_DONKEYDAN_MARKET_CAP:FLOKI has broken out of a rising wedge on the 4H chart and is now retesting the breakout zone.
If this support holds, a move toward 0.00010200 is likely to offer up to 23% upside.
DYRO, NFA
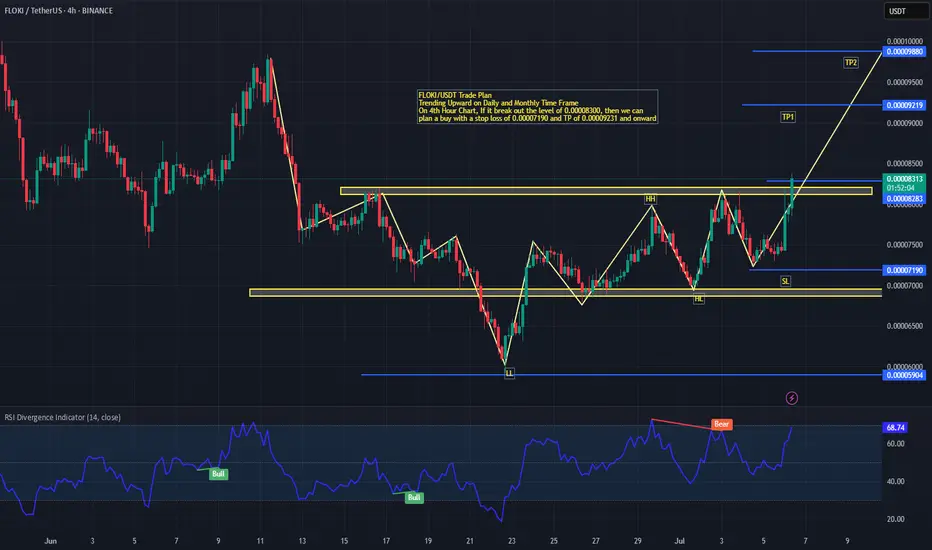
FLOKI/USDT – 4H Chart Analysis#FLOKI is showing a clear bullish structure on the 4-hour timeframe, aligning with its upward momentum on the daily and monthly charts. The price has formed a series of higher lows (HL) and higher highs (HH), indicating strength in the current trend.
📈 Breakout Zone: The pair has successfully broken above the key resistance zone around 0.00008300, confirming bullish continuation. This breakout opens the path for further upside potential.
✅ Trade Plan:
Entry: A buy position above 0.00008300
Stop Loss (SL): 0.00007190 (below the recent HL support zone)
Take Profit (TP):
TP1: 0.00009236
TP2: 0.00009880
📊 Momentum Indicators:
The RSI is currently near the overbought territory (69.18) but remains supportive of bullish price action as there is no immediate divergence forming post-breakout. Previous bearish divergence played out during consolidation but has since been invalidated.
⚡ Bias: Bullish
A strong breakout and retest of the previous resistance-turned-support would further strengthen the upside thesis. Caution is advised near the TP1 zone as partial profit-taking may occur.
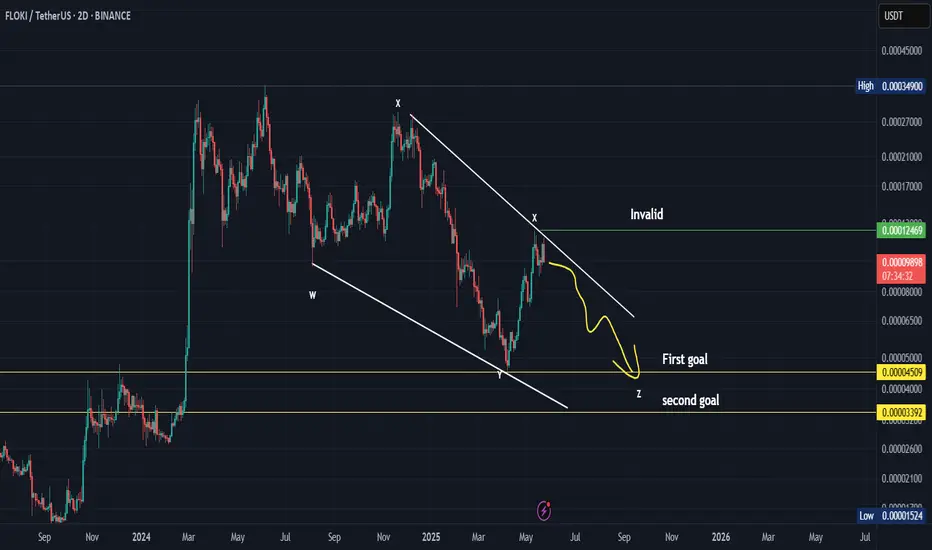
Caution is requiredA test was made near the last minor peak and it could not break it and fell and there is a fifth side left to close wxyxxz
*In principle, I am not a supporter of any direction, but I am only giving my point of view, which may be right or wrong. If the analysis helps you, then this is for you. If you do not like this analysis, there is no problem. Just ignore it. My goal is to spread the benefit. I am not one of the founders of the currency.
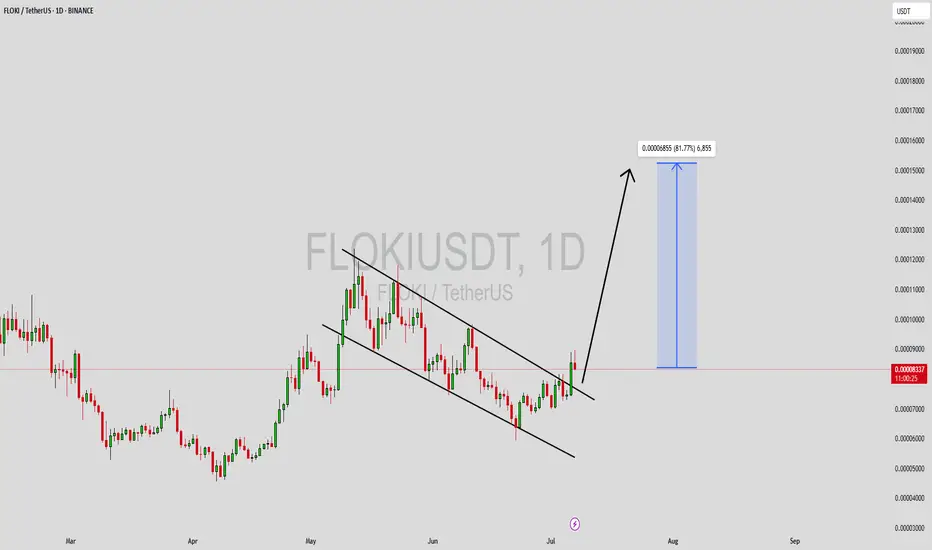
FLOKI on Fire! Bullish Summer for FLOKIUSDTDuring the two-month period from July to August, it's unclear what the specific catalyst might be, but Floki appears poised for a price surge between 75% to 133%. The June low at 0.00005923 seems to mark a solid bottom, and from here, I anticipate a bullish trend in Floki’s price.

$FLOKI Weekly Breakout Alert!SEED_DONKEYDAN_MARKET_CAP:FLOKI Weekly Breakout Alert!
Price just broke a major downtrend on the weekly chart 📈
Accumulation rising, exchange reserves at 10-month low.
Valhalla mainnet is live—real utility kicking in.
This could be the start of a big pump. Targets: $0.0003 → $0.0006
#FLOKI #MemeCoin
#FLOKI/USDT#FLOKI
The price is moving within a descending channel on the 1-hour frame and is expected to break and continue upward.
We have a trend to stabilize above the 100 moving average once again.
We have a downtrend on the RSI indicator, which supports the upward move by breaking it upward.
We have a support area at the lower limit of the channel at 0.00008150, acting as strong support from which the price can rebound.
Entry price: 0.00008490
First target: 0.00008713
Second target: 0.00008887
Third target: 0.00009129

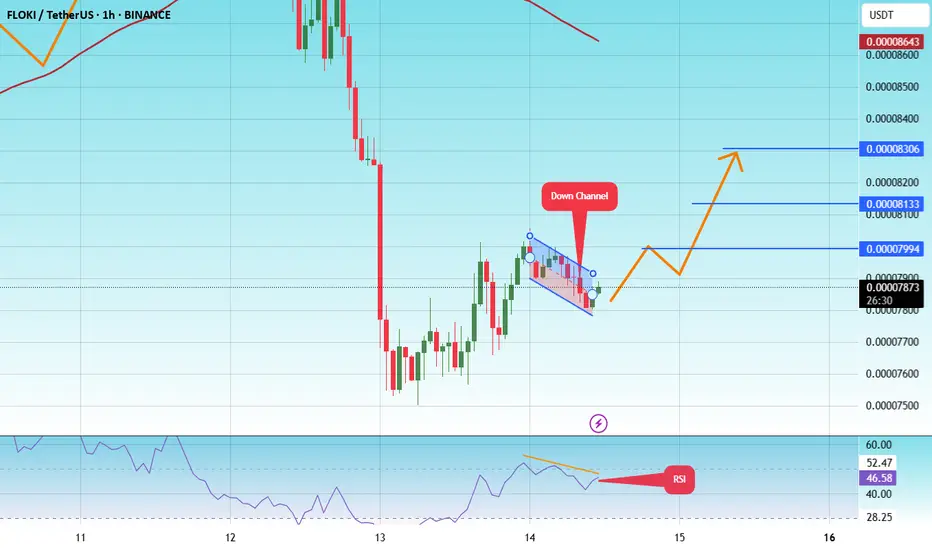
#FLOKI/USDT#FLOKI
The price is moving within a descending channel on the 1-hour frame and is expected to break and continue upward.
We have a trend to stabilize above the 100 moving average once again.
We have a downtrend on the RSI indicator, which supports the upward move by breaking it upward.
We have a support area at the lower limit of the channel at 0.00007790, acting as strong support from which the price can rebound.
Entry price: 0.00007875
First target: 0.00008000
Second target: 0.00008133
Third target: 0.00008300
FLOKI Correction done?The Price has reached Weekly1 support and a lot of stop-losses have been liquiditated(orange lines). There is one more major insufficient area FVG3 (Fair Value Gap) remaining and some stop-losses to take out around 0.00006568 price. This is very high probability buy-side liquidity area providing very good entry point inside FVG3. The price might also bounce from the current levels without visiting these lower levels but I personally would feel a lot safer with a liquidity sweep bounce from a FVG. Current ~44% correction from the previous highs is decent but further correction into the FVG3 levels would bring it to ~50% beeing not that uncommon scenario with alts. Either way, the direction is up. Way UP!

Floki (FLOKI): Possible H&S Pattern Forming | Neckline Area Floki coin is pressuring the local neckline area, which could give us a good opportunity for a breakdown and 33% of market price movement to lower zones.
For now, we are not rushing, as the breakdown has not yet happened but we are seeing great chances for it so we are looking for further movement to lower zones and a breakdown to happen, which then would give us a good opportunity for a 33% drop!
Swallow Academy

BuyWe reach a demand zone and then break last lower high and then pullback to the area and then we enter.
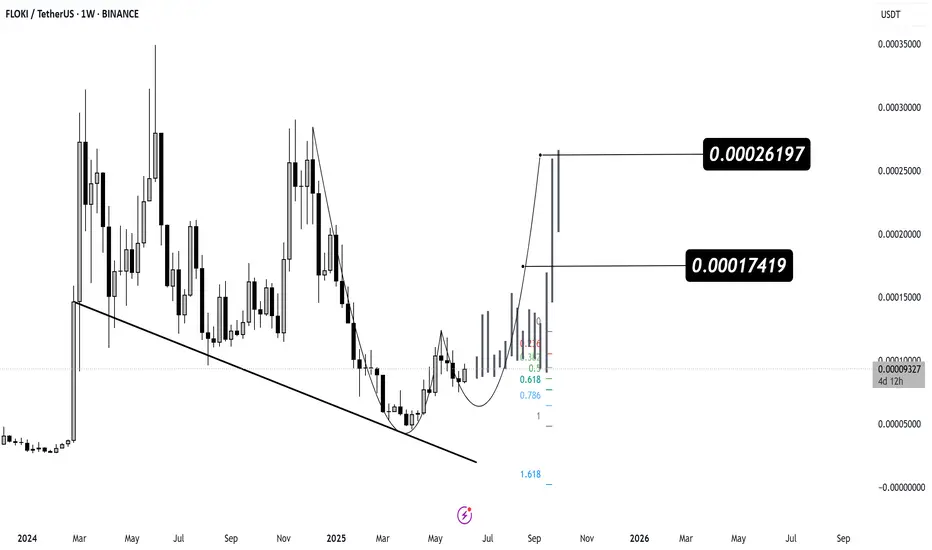
Technical Analysis – FLOKI/USDT (1W Chart
🔍 Key Technical Overview:
FLOKI has recently broken above a long-term descending trendline, signaling a potential major reversal.
The price is forming a rounded bottom pattern, indicating accumulation and a potential bullish breakout.
📈 Bullish Price Targets:
First Target: 0.00017419 USDT
↳ Based on prior structure and Fibonacci 1.0 projection.
Second Target: 0.00026197 USDT
↳ Full measured move from the rounded bottom breakout and historical resistance zone.
🧠 Technical Notes:
Fibonacci Retracement Levels show the current price hovering near the 0.382–0.5 zone, which often precedes a strong breakout.
Bullish projections (gray candles) highlight a parabolic move possibility.
✅ Strategic Outlook:
Buy Zone: Above 0.00009000 (confirmed breakout with volume)
Take Profits:
TP1: 0.000174
TP2: 0.000262
Stop Loss: Below 0.000065 (to protect against false breakout)
📌 Summary:
FLOKI is showing strong bullish momentum with a clear breakout from a long-term downtrend. A continuation toward 0.00017 and potentially 0.00026 is likely if momentum persists.
FLOKI Technical Outlook: Trend, Patterns, and Trade PlanFloki (FLOKI) continues to demonstrate robust bullish momentum on the higher timeframes, with price action respecting the prevailing uptrend 📈. After continued retracements and expansion, the structure remains constructive, and my directional bias is firmly bullish.
While the emergence of a three-drive pattern warrants some caution ⚠️, the overall trend suggests that any corrective move could present a high-probability long opportunity. Wait for a retrace to key support zones before considering entries. My targets are set at previous swing highs visible on the 4H chart, with stops placed just below the most recent low for prudent risk management.
As always, this is not financial advice—trade safe and stick to your plan! 🚀

FLOKI Correction Complete & Ready to Rally!📊 CRYPTO:FLOKIUSD found strong buying interest in the blue box area at $0.000083 - $0.000074, setting the stage for a trend continuation to the upside.
🚀 Will momentum push it toward new highs?
FLOKI/USDT – Final Sweep Before the Reversal? Watch These LevelsFLOKI has rebounded from a key Fibonacci level, but price action still sits in a high-stakes zone. One more move lower could complete a pattern that flips the script to bullish.
Key Highlights:
Price rejected from HTF resistance after bounce
0.618 Fibonacci offered strong short-term support
A liquidity sweep below recent lows could complete a bullish structure
FLOKI’s recent bounce off the 0.618 Fibonacci retracement was clean, but not yet convincing. After failing to break through high time frame resistance, price is now trading in compression, coiling between strong support and overhead resistance.
Technically, this kind of behavior often precedes a decisive move. One concern is the uncollected liquidity still resting just beneath the previous swing low. From a market structure standpoint, this opens the door to one more leg down—potentially into the same Fib zone—to flush weak hands and form a base.
This would complete what resembles a bullish three drives pattern, with each low sweeping liquidity more efficiently. If the third drive plays out and buyers step in aggressively, we could see a clean shift in structure—especially if price can break above the VWAP and reclaim the value area high.
Keep a close eye on the $0.618 zone. A final wick down into liquidity followed by strength could confirm a reversal and set the stage for FLOKI’s next breakout.
FLOKIUSDT Forming Bullish waveFLOKIUSDT is currently showcasing a strong bullish setup, supported by growing volume and technical confirmation. The recent price movement indicates accumulation at key support levels, followed by a tightening range that often precedes a significant breakout. This structure suggests high probability for a powerful upward move, aligning with the projected 80% to 90% gain. With market sentiment turning positive around meme tokens and community-driven coins, FLOKI is positioned for potential explosive growth.
The FLOKI project continues to capture attention across crypto communities due to its expanding ecosystem, including FlokiFi, NFT integrations, and utility within the DeFi space. This has helped build confidence among investors, especially as FLOKI has transitioned from a meme coin narrative to one with real-world use cases. As volume builds around this consolidation, technical traders may interpret this as a bullish continuation pattern, setting the stage for aggressive price expansion.
Technically, FLOKIUSDT is attempting a breakout from a downward channel, with recent candles showing strong rejection of lower prices and momentum starting to shift upward. Once this breakout is confirmed with sustained volume, the rally could accelerate quickly, as price targets move into the 0.000015–0.000016 range. This aligns with the 80–90% gain expectation highlighted on the chart, providing a favorable setup for swing and position traders alike.
Overall, FLOKIUSDT offers a compelling combination of bullish technicals, increasing investor interest, and narrative momentum. It’s a chart worth watching closely for breakout confirmation, especially for those looking to capitalize on mid-cap altcoin volatility during this phase of the market cycle.
✅ Show your support by hitting the like button and
✅ Leaving a comment below! (What is You opinion about this Coin)
Your feedback and engagement keep me inspired to share more insightful market analysis with you!
FLOKIUSDT 1D AnalysisFLOKI ~ 1D Analysis
#FLOKI Buy back from here with a short term target of at least 15%+ and a long term target of $0.00028