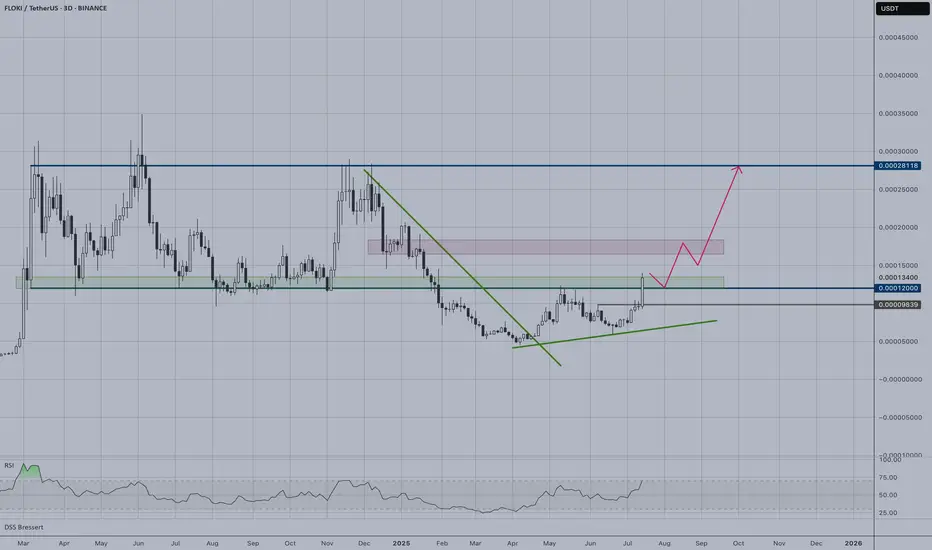
FLOKI Ready for a Big Move !📊 FLOKI/USDT Analysis
Floki just broke out of a falling wedge and flipped key resistance around 0.00012 into support. As long as price holds above this zone, I’m targeting the next major resistance levels at 0.00019 and 0.00028.
✅ Bullish market structure with strong momentum.
✅ Potential for a big move if current breakout holds.
FLOKIUSDT trade ideas
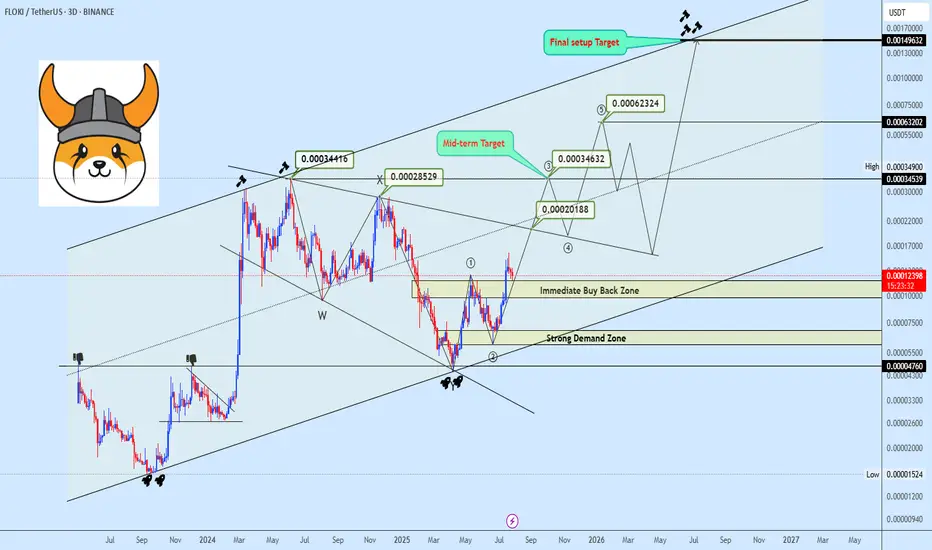
Wave 3 Loading? FLOKI Prepares for Potential Upside ContinuationFLOKIUSDT is trading within an ascending channel, recently rejecting from the upper boundary near $0.00034416. Price has since entered a prolonged consolidation phase, forming a descending broadening wedge.
The current focus remains on the $0.00020188 region; a breakout from this level would validate a potential wave 3 extension. Overall structure still targets a revisit to the channel’s upper boundary, supported by the recent bounce from the lower channel trendline.
Key levels and targets are illustrated on the chart.
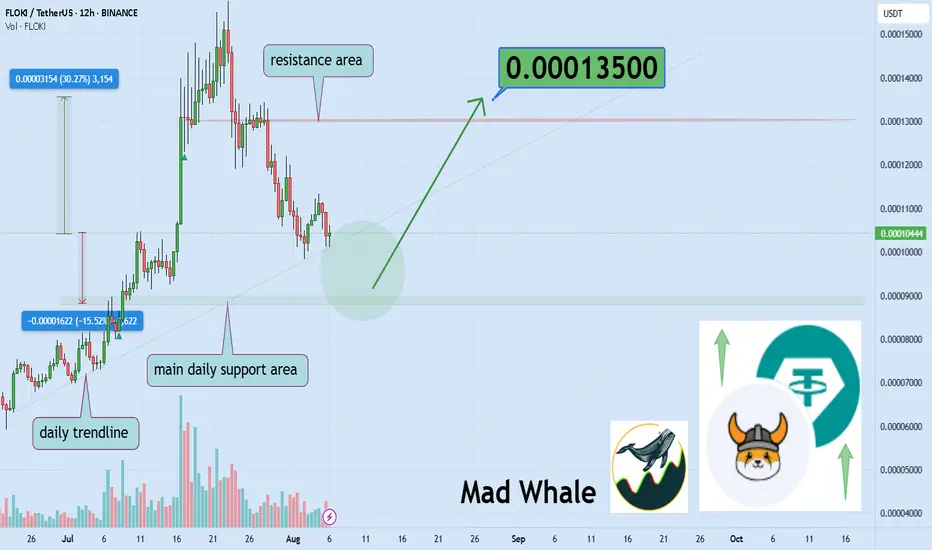
loki Tests Last Support, Could Rally 30% Toward 0.000135Hello✌️
Let’s analyze Floki’s price action both technically and fundamentally 📈.
🔍Fundamental analysis:
FLOKI's Valhalla game just hit 1M+ transactions and burns tokens with each NFT use. If daily players grow past 50K, FLOKI’s supply could shrink faster and that might boost demand.
Just like what we saw with AXS back in the day. 🎮🔥
📊Technical analysis:
BINANCE:FLOKIUSDT has lost key Fibonacci supports, with daily support as its last defense. Holding this level could lead to a 30% rally targeting 0.000135. 📉🔥
✨We put love into every post!
Your support inspires us 💛 Drop a comment we’d love to hear from you! Thanks, Mad Whale
FLOKI : Will growth continue or will prices be dumped?Hello friends🙌
✅Well, this meme coin grew well when it was first created and surprised everyone, and now that some time has passed since its creation, it has been listed on an exchange and we are going to examine together what effect it has on its price.
✅Well, when this meme coin was first created, it grew well and has given good profits to its holders so far. Now that it is listed on an exchange and more transactions are taking place, it will definitely be impressive, but the chart always has the final say.
So what does the chart tell us?
✅In the 30-minute time frame, which is considered a short-term time frame, we had a decline due to the decline in the entire market, and the price was supported in the specified support area, but not definitive support.
✅Several channels have been drawn so that in the event of a break from above or below, we can understand whether the power is in the hands of buyers or sellers.
Now, if the buyers show their strength, which they did to some extent (a trendline break and a strong pullback), we can buy in the specified areas with risk and capital management and move with it to the upcoming goals.
📉If buyers cannot dominate the price and sellers dominate more, we should wait for lower support areas.
⚠Don't forget risk and capital management, friends.⚠
🔥Follow us for more signals🔥
*Trade safely with us*

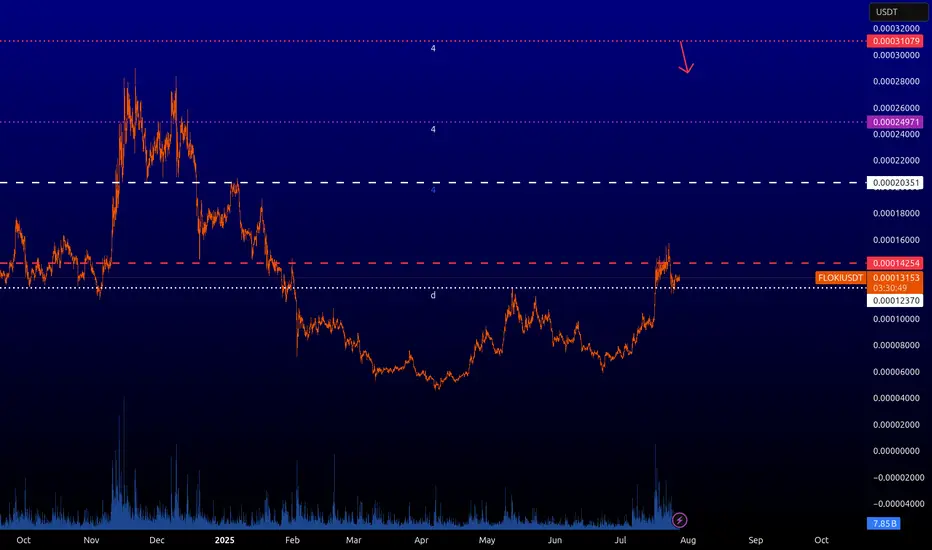
FLOKIUSD : Key levelsThese are the key levels on this ticker which I'm honestly watching for the first time. You can sell only from the level where the red arrow is. Other levels are still being formed.
Floki (FLOKI): Possible H&S Pattern Forming | Neckline Area Floki coin is pressuring the local neckline area, which could give us a good opportunity for a breakdown and 33% of market price movement to lower zones.
For now, we are not rushing, as the breakdown has not yet happened but we are seeing great chances for it so we are looking for further movement to lower zones and a breakdown to happen, which then would give us a good opportunity for a 33% drop!
Swallow Academy

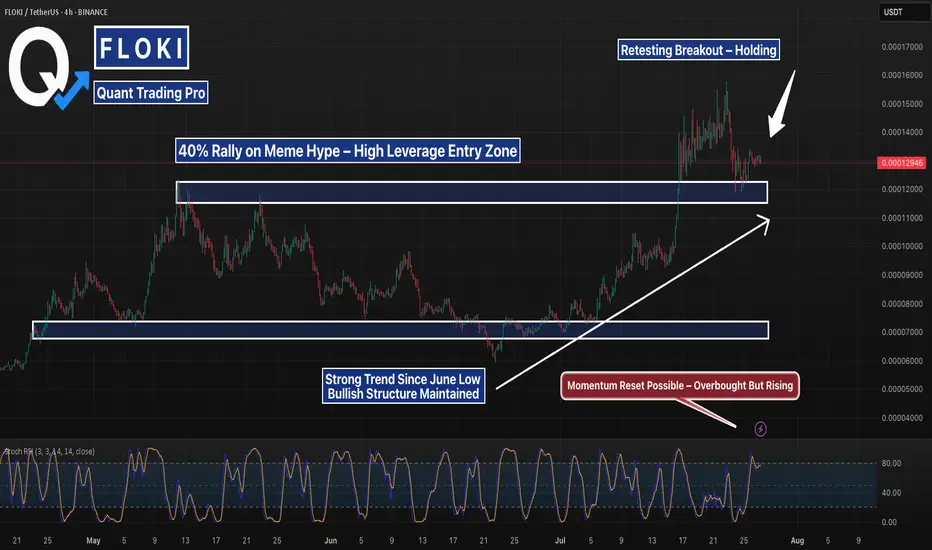
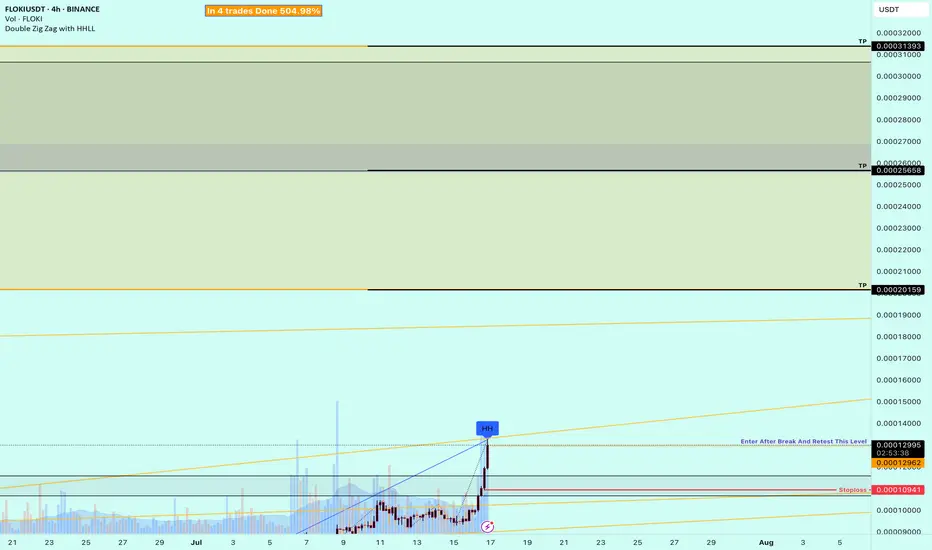
FLOKI Pulls Back After 40% Pump — Testing Breakout StructureFLOKIUSDT 4H chart shows a textbook meme-driven breakout followed by a clean pullback into prior structure. After a 40% move up in just a few sessions — driven by rising social media hype and a massive jump in futures open interest — FLOKI is now retesting the breakout base near the 0.0000120 level.
This zone served as the high of a multi-month range and is now being tested as support. Price is also riding a clear ascending trendline from the June lows, suggesting overall structure remains bullish unless that trend is broken.
Stochastic RSI is elevated but hasn't rolled over yet, signaling momentum could still push higher if support holds. If bulls defend this zone and break above the upper consolidation, the next leg could push toward the previous local highs around 0.0000170. If support fails, eyes turn to the 0.0000098 mid-range level.
Momentum cooling — structure still intact.
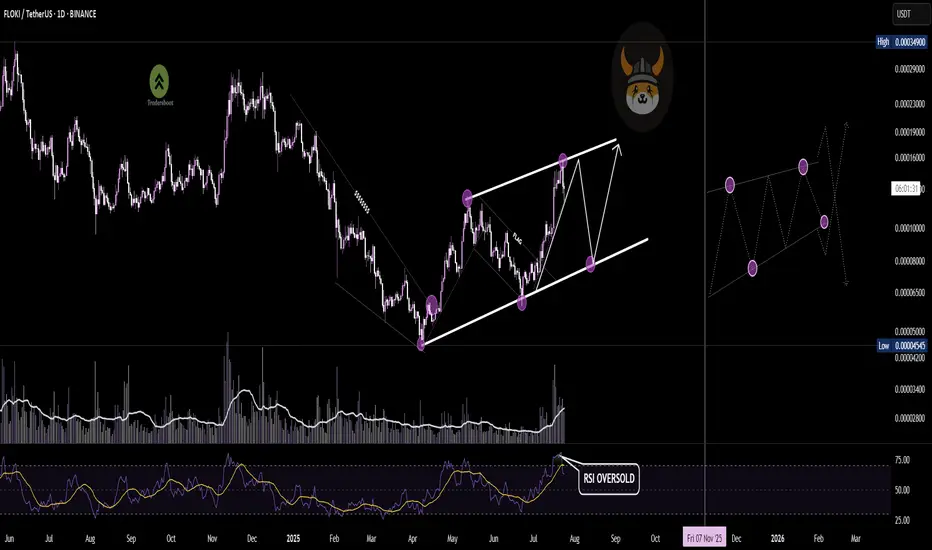
FLOKI respecting the channel beautifullyFLOKI/USDT on the daily chart is forming a well-defined ascending channel, respecting both upper resistance and lower support trendlines.
The RSI recently entered the overbought zone near resistance, suggesting short-term exhaustion. If price corrects, we could see a move toward the lower trendline, offering a potential long opportunity for another leg higher — keeping the bullish structure intact.
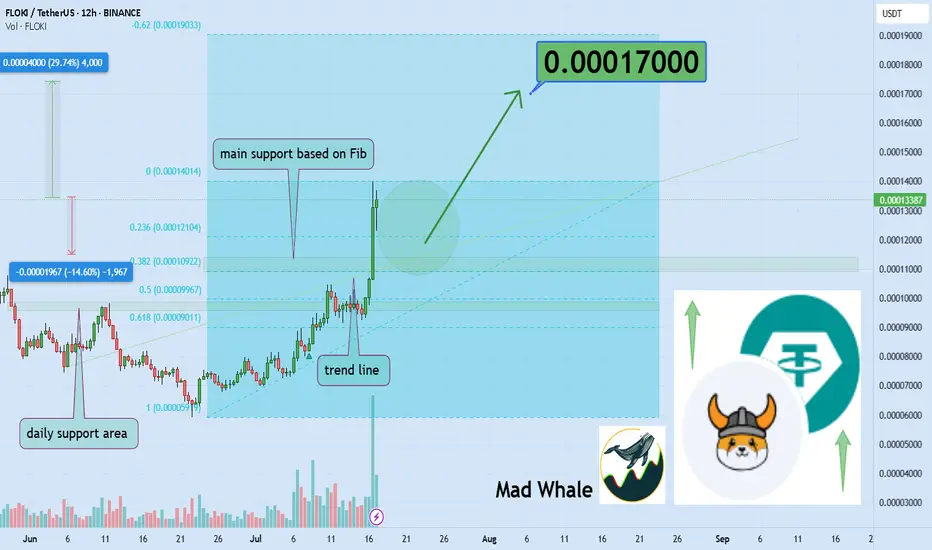
Ready For Floki’s 30 Percent Surge? Main Target 0.00017Hello✌
Let’s analyze Floki’s upcoming price potential 📈.
BINANCE:FLOKIUSDT has confidently broken through its recent resistance levels 🚀, signaling strong upward momentum. Aiming for at least a 30% gain, the main target is set around 0.00017. Keep an eye on this level as it could offer a solid opportunity for those ready to ride the next wave 📈.
✨ Need a little love!
We pour love into every post your support keeps us inspired! 💛 Don’t be shy, we’d love to hear from you on comments. Big thanks , Mad Whale 🐋
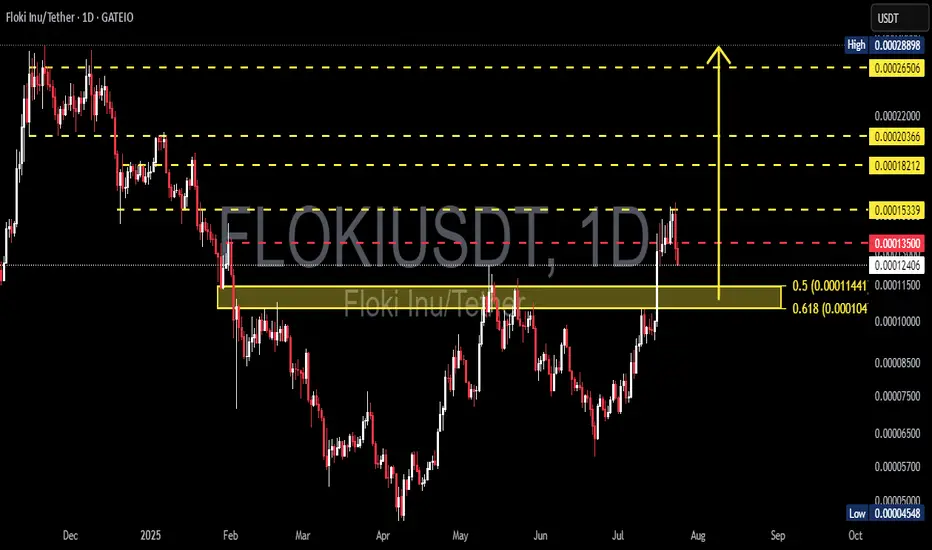
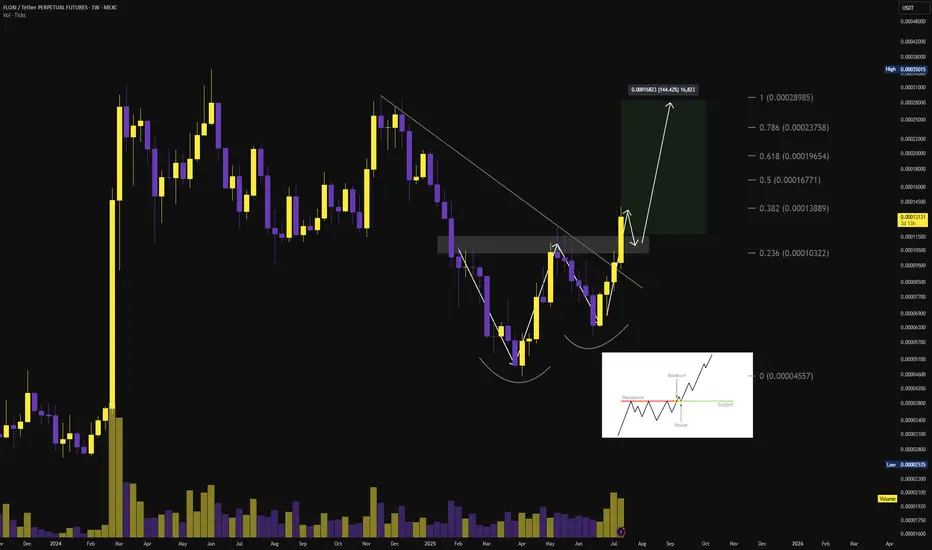
FLOKIUSDT Pullback at Fibonacci Resistance – Bounce?📊 Market Overview:
FLOKI has recently posted a remarkable rally, gaining over +200% from the swing low at 0.00004548. This surge broke through multiple resistance levels, forming a strong bullish market structure with clear Higher Highs (HH) and Higher Lows (HL).
However, this bullish momentum has now met a critical resistance at 0.00015339, which aligns with the Fibonacci 0.382 retracement level of the previous macro move. This rejection has triggered a pullback, raising questions: is this a healthy retracement, or the start of a trend reversal?
---
🧠 Technical Breakdown:
✅ Bullish Structure in Play
The recent move appears to be part of a larger impulsive wave, possibly Wave 1 or 3 of an Elliott Wave sequence.
✅ Golden Pocket Zone in Sight
The highlighted yellow box marks the Fibonacci Golden Pocket area between 0.5 (0.00011441) and 0.618 (0.0001104) — historically, this is a high-probability buy zone where bulls often regain control.
✅ Breakout Retest Potential
The current pullback could be a textbook retest of the previous breakout base, setting up for continuation — but only if this key zone holds.
---
🟢 Bullish Scenario:
If the price finds support at the 0.000110–0.000114 zone, and forms a strong bullish reversal candle (e.g., bullish engulfing, hammer), it could ignite a fresh wave upward targeting:
🔼 0.00015339 (breakout level)
🔼 0.00018212
🔼 0.00020366
🔼 0.00022000
🔼 0.00026506
🏁 0.00028898 — the previous major high and full swing target
Such a move would validate the continuation of the macro uptrend and possibly confirm Wave 3 in a larger Elliott Wave structure.
---
🔴 Bearish Scenario:
On the other hand, a daily close below 0.000110 would invalidate the bullish golden pocket thesis and potentially shift momentum in favor of the bears.
Possible downside targets include:
🔻 0.00008500 — minor support and demand zone
🔻 0.00004548 — the macro low and strong historical support
This would form a Lower High (LH) structure, which could signal the beginning of a bearish trend or extended consolidation.
---
🔍 Conclusion:
> FLOKIUSDT is now at a make-or-break level. The 0.000110–0.000114 zone is where bulls and bears will battle for control of the trend.
Hold here — and we may see a strong continuation.
Break below — and caution is warranted.
Wait for clear price action confirmation in the coming sessions before positioning. This zone will likely dictate FLOKI’s next major move.
---
💡 Pro Tips for Traders:
Watch for bullish reversal candlesticks in the golden pocket area.
Monitor volume — rising volume on a bounce increases breakout probability.
RSI divergence may provide early signs of trend reversal or continuation.
#FLOKIUSDT #FLOKI #CryptoAnalysis #AltcoinRally #FibonacciLevels #TechnicalAnalysis #BullishScenario #BearishScenario #PriceAction #CryptoBreakout #GoldenPocket #TrendReversal
Examples of Conditions for Starting a Trade
Hello, fellow traders!
Follow us to get the latest information quickly.
Have a great day!
-------------------------------------
This time, I'm going to talk about when to start and when to close a trade.
Trading has no beginning or end.
In other words, you can start a trade at any time and close it at any time.
The only question is whether you can profit from the time you start the trade and when you close it.
Therefore, it's best to be clear about why you need to start trading.
In other words, you need to be able to explain why you need to start trading now.
If you can't, it's best not to start trading.
You should also be able to explain why you're closing the trade now or selling in installments.
If you can't, it's likely that you don't have a well-established trading strategy.
A trading strategy should be developed from a broad perspective.
After that, you should develop a detailed response strategy that stabilizes your psychological state according to price volatility and guides your trading accordingly.
Therefore, a basic trading strategy is essential.
This basic trading strategy may vary depending on your investment style, so it's important to establish a basic trading strategy that suits you.
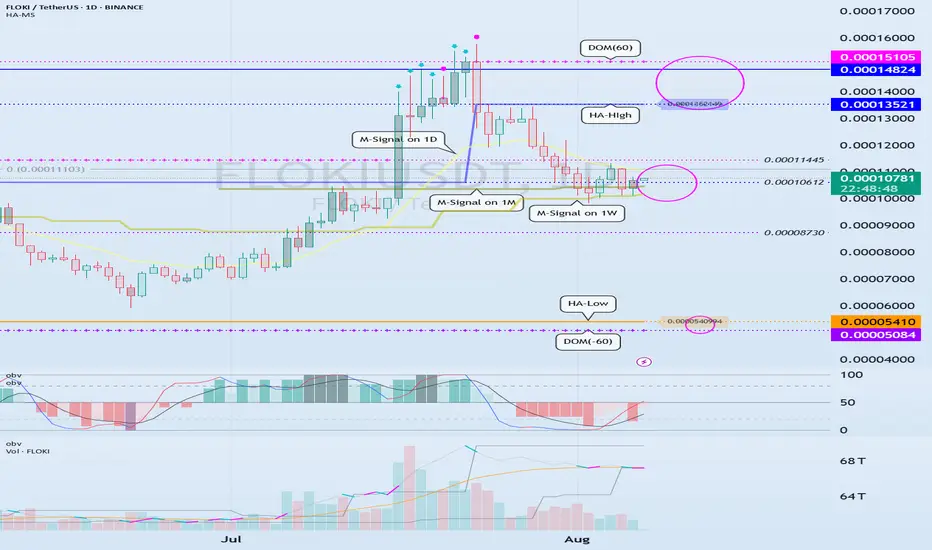
My basic trading strategy is to buy in the DOM(-60) ~ HA-Low range and sell in the HA-High ~ DOM(60) range.
------------------------------------------------------------------------------
To initiate a trade, you can determine whether support is available at important support and resistance levels or areas.
The optimal range for this is when support is found and the price rises in the DOM (-60) ~ HA-Low range.
This corresponds to the conditions for trading on the Heikin-Ashi chart.
-
Next, the M-Signal indicators on the 1M, 1W, and 1D charts converge and break upward, sustaining the price.
In other words, the price rises when support is found around the current price range of 0.000010612-0.00011445.
This represents an important turning point from a trend perspective.
-
If you bought in the above range, the sell range would be 0.00013521-0.00014824.
This sell zone corresponds to the high point, HA-High ~ DOM(60).
This means that a stepwise uptrend, or a full-blown uptrend, is likely to begin only when the price rises above the HA-High ~ DOM(60) range.
-
If you start trading at other support and resistance points or zones, it can be difficult to respond to price volatility.
Therefore, it's best to check for support and initiate trading within the DOM(-60) ~ HA-Low and HA-High ~ DOM(60) zones, if possible.
From a trend perspective, if the M-Signal indicators on the 1M, 1W, and 1D charts converge, and the price breaks upward and sustains, as is currently the case, trading is possible if support is found at the support and resistance levels near those points.
While this trading method cannot guarantee profit, it is worth developing a trading strategy and attempting it.
-
Thank you for reading to the end. I wish you successful trading.
--------------------------------------------------
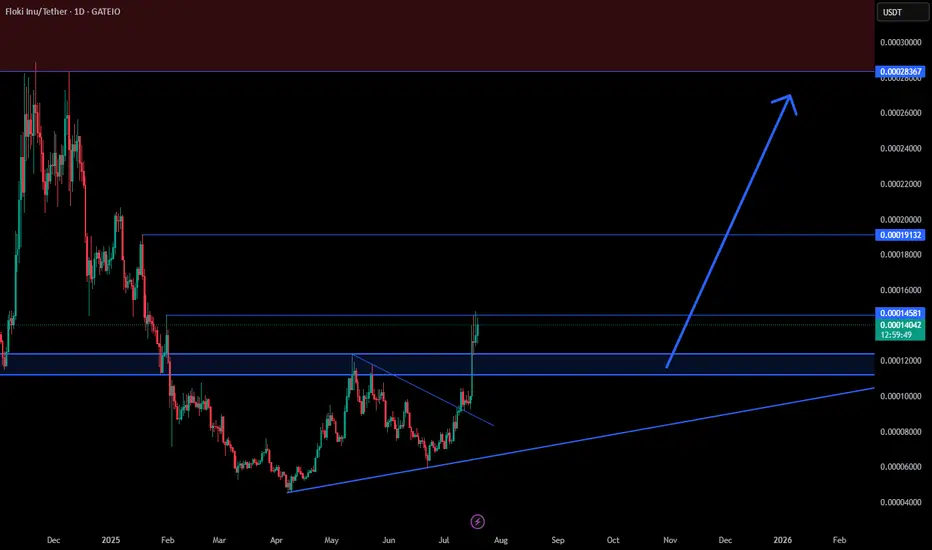
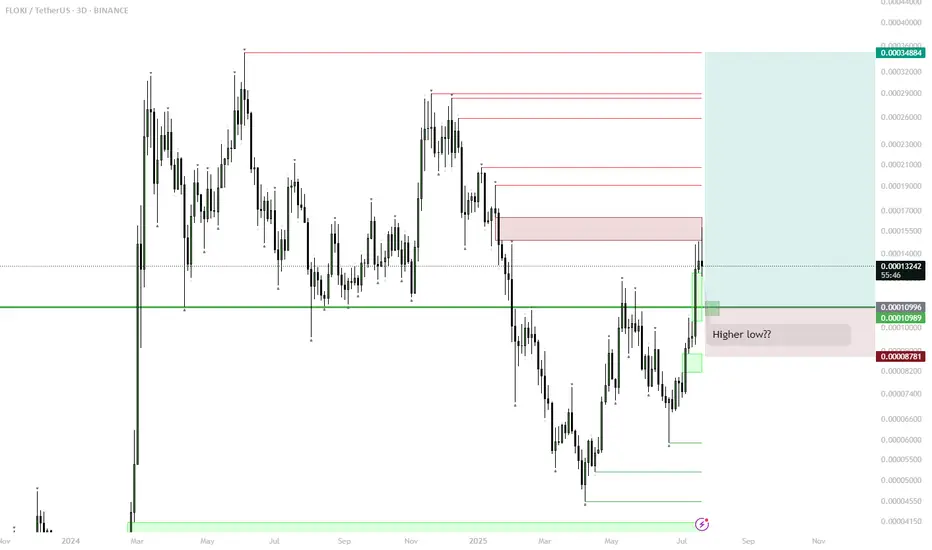
FLOKI – Range Low Setup for Next Big Move? (1D Plan)
FLOKI has reclaimed the key horizontal support, forming a possible higher low.
Currently watching the green box/range low for signs of accumulation (sideways price action) and support confirmation.
If FLOKI establishes a range or shows strength at this zone, look for a long entry with stop below the range.
Upside target is the range high and previous major resistance, offering a potential ~180% move.
Invalidation: clear breakdown and close below the green zone signals failed setup.
FLOKI is showing classic bottoming structure: reclaim of support and formation of a higher low after a prolonged downtrend. Range lows historically have provided major entries for explosive moves. If the green box zone acts as accumulation and price holds, it could set the stage for a rally back to the top of the range as seen before. This setup is favored in meme/altcoin cycles, especially when market sentiment improves. Risk is defined, reward is high.
Floki (FLOKI): Good Buying Opportunity After Break of StructureFloki coin has good potential after the recent BOS, which is followed by a sharp bullish trend. There are 2 styles too long in this situation so we shared both of them. Either way, there is a good chance to get 2x on this coin!
More in-depth info is in the video—enjoy!
Swallow Academy

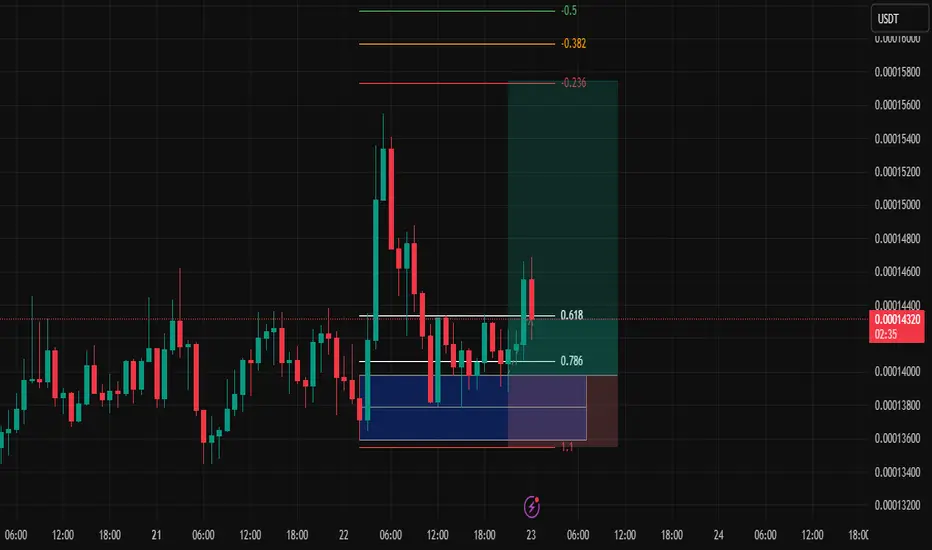
Consistency: The Pursuit of Happiness – Week 2, Trade #4📘 Week 2 – Trade #4
Strategy Journal | Futures Account**
Asset: \ BINANCE:FLOKIUSDT
Timeframe**: 1H
Entry Type**: Order Block (below the 0.786)
---
🧭 Context
This is Day 4 of my live journaling and strategy publishing process.
Normally, I don’t trade on Mondays or weekends—but recent schedule shifts had me checking the charts over the weekend and saw some SPOT trades to take on Monday. That work took up a lot of mental capital heading into Tuesday. Still, I wanted to stay consistent in the process, even if energy wasn’t fully focused on the charts.
Trade Setup & Strategy
I’ve been sitting in cash for a while. Today, I wasn’t actively hunting setups—I was waiting for one to come into my criteria , and this one did.
The asset: \ BINANCE:FLOKIUSDT
My usual entries are around the 0.618 retracement , but this time, I adjusted based on my internal bandwidth and risk sensitivity.
Instead, I entered below the 0.786 , directly on the order block.
Why?
Because when my mind isn’t 100% on the charts, I don’t want to overexpose myself. Order block entries reduce my stop size and allow for better risk-to-reward profiles. It’s a cleaner, more defensive entry compared to FVGs or mid-OTE zones.
So yes—I’ve gone a little off script from my usual 0.618 entries, but not outside the logic of the framework. It’s a tweak based on context and mental clarity.
📊 Market Structure & Bias
I’m looking for a run of the previous day’s high.
But here’s the wrinkle: that high is a Monday high. And Monday’s range often gets targeted later in the week, so there’s potential—but no guarantees.
London PM session consolidated.
NY AM lacked strong momentum.
That leaves NY PM or Wednesday Asia/NY as potential breakout windows.
I’m letting it run, no interference.
🔍 Risk, Entry, and Strategy Notes
Entry: Order Block, below 0.786
Bias: Take out previous day’s high
Timeframe: 1H
Stop: Tighter than my usual 0.618 entries
Mental Capital: Split between trading futures and Spot
Objective: Stay consistent with journaling and process
Trade Management: No touch. Let it do what it does.
📌 Reflections
This is a good representation of adapting the strategy without breaking it. Fewer trades, less risk, more focus—and ideally, cleaner results.
This also confirms something I’ve been leaning into:
> **I'd rather take fewer, higher-conviction trades at cleaner levels.**
Let’s see if this one plays out. Win or loss, the goal remains the same:
Consistency → Clarity → Repeatability.
---
Result to be published once the trade concludes.
This journal remains part of a longer strategy documentation series.
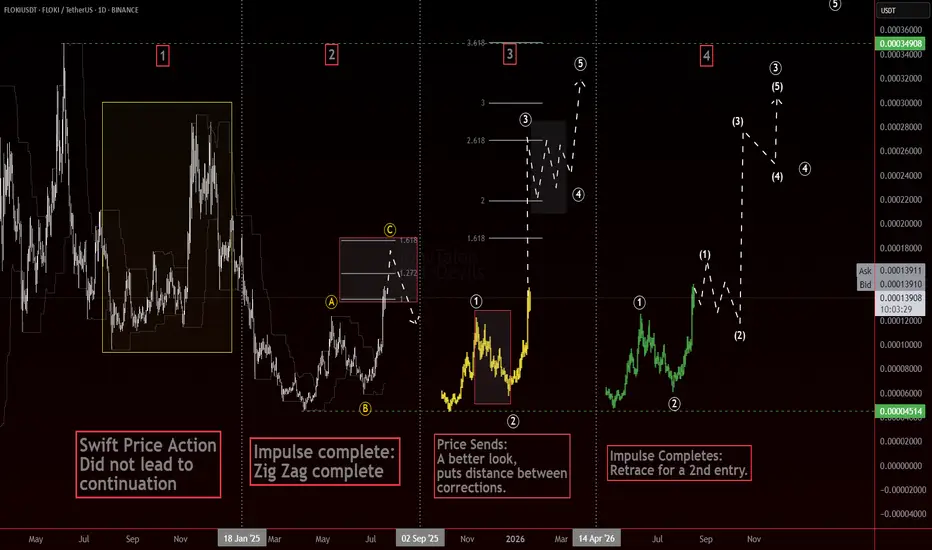
APA!? Always Plan Ahead! Are you ready!?Which number will play? 🤔
Swift price action makes the chart light up. It grabs your attention, makes it feel like something big is happening. And often it is. But sometimes, those sharp moves stall out just as quickly as they started.
That’s why we Always Plan Ahead.
Some alts gave us a clean #ElliottWave anchor. Structurally, it looks like a potential wave 3. Strong momentum, hitting projection zones, and solid separation from prior corrections at the smaller degree. Exactly what you want to see.
But fast doesn’t always mean forward.
Without a proper follow-through or a complete structure, one wave doesn’t tell the whole story. That’s why it’s key to wait for the next pieces to print. A wave 3 might be in play, but we still need confirmation—whether it unfolds into a 5-wave impulse, stalls into a correction, or pivots entirely.
The chart shows a few possibilities.
1 A swift move that didn’t lead to continuation.
2 A Zig Zag that completing.
3 A better-looking impulse with space between the corrective moves.
4 An impulse that completes but sets us up for a 2nd entry
The question now:
Which number will play? … or something else entirely?
That’s where planning comes in. You don’t need to know the outcome to be ready for it.
Stay sharp. Stay patient. And most of all—
Always Plan Ahead.
$FLOKI | Dual Reversal Structure Detected SEED_DONKEYDAN_MARKET_CAP:FLOKI has executed a high-conviction breakout from a converging double bottom + inverse head & shoulders formation — both classic bullish reversal patterns.📊🔥
💥 Technical Breakdown:
• Double bottom with neckline break confirms demand zone absorption
• Breakout with retest and expanding volume = institutional-grade confirmation
• Target zones aligned with Fibonacci extensions and prior HVN zones
🎯 Fib Extension Targets:
→ 0.0001965 (0.618)
→ 0.0002375 (0.786)
→ 0.0002898 (full measured move)
📈 Structure + volume = conviction. This is how trend reversals are born.
FLOKI | Reclaim of Trading ZoneFLOKI is showing a strong bullish reversal pattern as it reclaims the critical trading zone.
Key Technical Signals:
Clean breakout from descending wedge formation
RSI showing bullish divergence and momentum shift
Price reclaiming major support zone as new resistance turns support
Volume supporting the upward move
Entry Strategy:
Retest of the trading range low around 0.000012
Risk Factors:
Bitcoin's overall market direction could impact this altcoin move. A failure to hold above the green support zone would invalidate the bullish thesis.
Buy Trade Strategy for FLOKI: Tapping Into Memecoin UtilityDescription:
This trading idea is centered on FLOKI, a cryptocurrency that originated as a memecoin but has evolved into a broader ecosystem project with real-world utility. Backed by a vibrant community and inspired by Elon Musk’s Shiba Inu, FLOKI aims to differentiate itself through initiatives such as Floki University (crypto education), Valhalla (an NFT metaverse game), and strategic charity partnerships. The project's growing utility and branding strength position it as a serious contender among memecoins shifting toward tangible use cases.
Despite its promising development roadmap, FLOKI remains a high-risk asset due to its origins in speculative hype and the unpredictable nature of retail-driven trends. External factors like market sentiment, regulatory scrutiny, and overall crypto market conditions can strongly influence its price action. Investors should exercise caution and apply disciplined risk management when considering exposure to FLOKI.
Disclaimer:
This trading idea is for educational purposes only and does not constitute financial advice. Cryptocurrencies like FLOKI are highly speculative and involve substantial risks, including the complete loss of capital. Always conduct independent research, consider your financial situation, and consult a licensed financial advisor before making any investment decisions. Past performance is not indicative of future results.
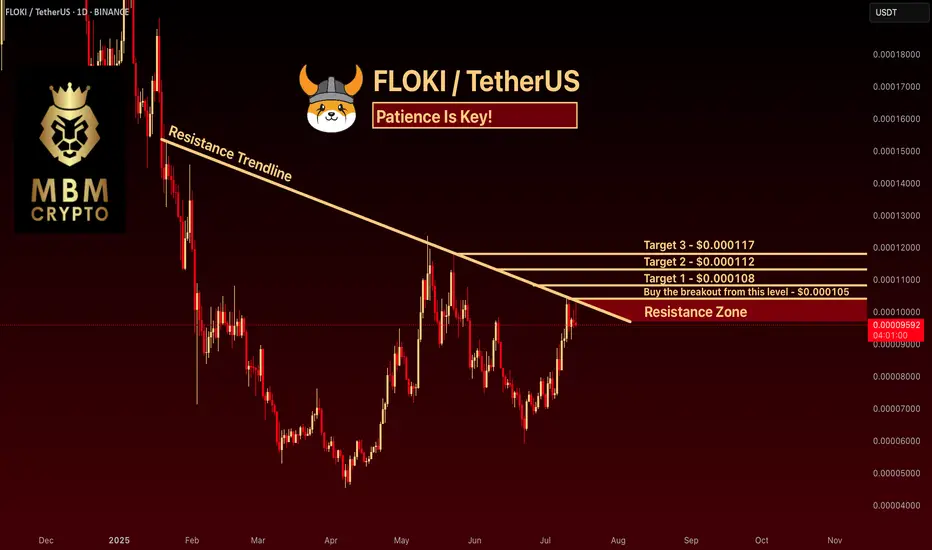
FLOKI: The optimal entry price! Trading Setup
If you’re considering trading FLOKI, here’s a quick setup that may help you.
The idea is: Buy when the price breaks above $0.000105 and take profits at the levels shown in the chart.
Targets:
1. $0.000108
2. $0.000112
3. $0.000117
-------------------------------------------
About our trades:
Our success rate is notably high, with 10 out of 11 posted trade setups achieving at least their first target upon a breakout price breach (The most on TW!). Our TradingView page serves as a testament to this claim, and we invite you to verify it!
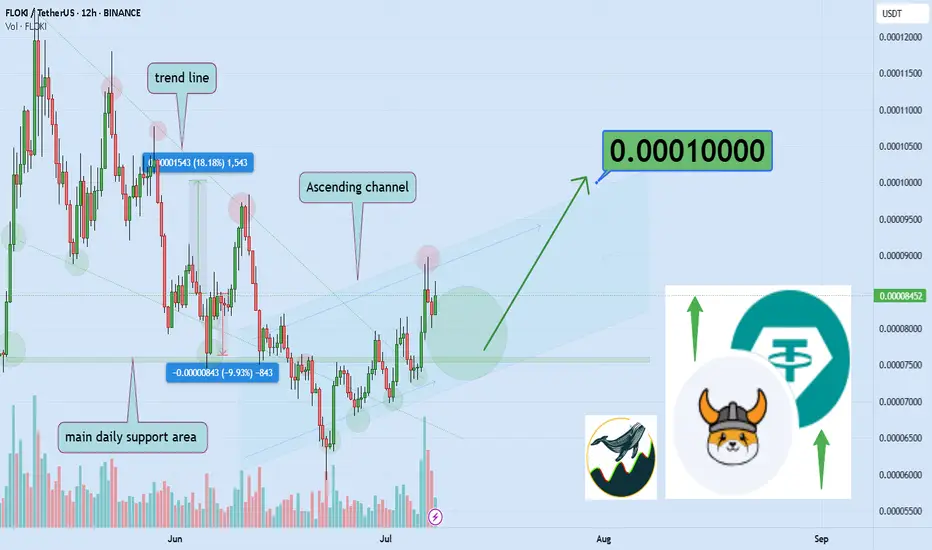
Floki Eyes Explosive 18% Rally Toward 0.00010 Resistance LevelHello✌
All previous targets were nailed ✅! Now, let’s dive into a full analysis of the upcoming price potential for Floki 🔍📈.
BINANCE:FLOKIUSDT has recently stabilized within a newly developed ascending channel following a series of sharp pullbacks. Price is currently hovering near a significant daily support zone, which may serve as a strong base for a potential bullish reaction. I’m watching for an upward move of around 18%, with a short-term target at 0.00010. 📊🚀
✨ Need a little love!
We pour love into every post your support keeps us inspired! 💛 Don’t be shy, we’d love to hear from you on comments. Big thanks , Mad Whale 🐋
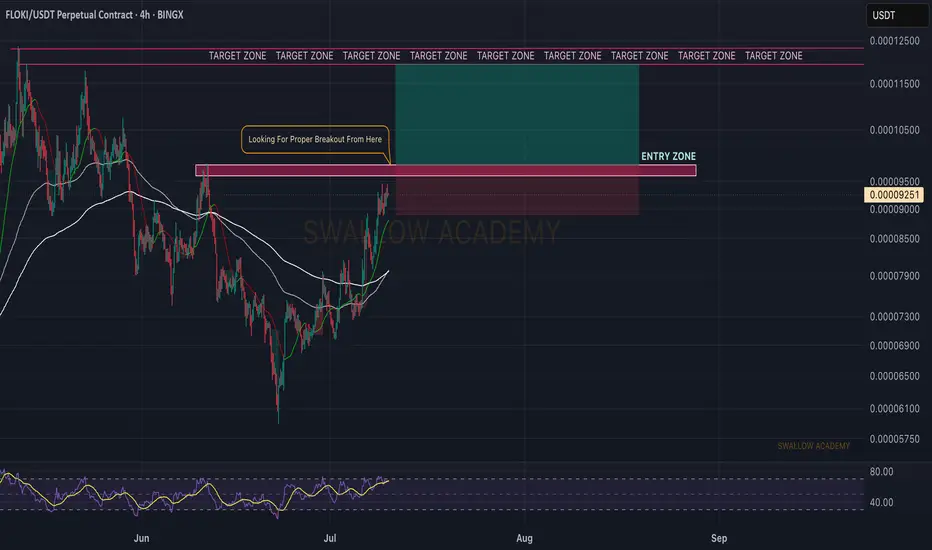
Floki (FLOKI): Looking For Buy Entry | Aiming For +22%Floki has been in a healthy bullish trend here after buyers overtook the zone of EMAs. With current momentum on markets, we might see a proper breakout from the local resistance area, which is marked as our entry as well.
As soon as we see a breakdown there, we are going to go into a long position, but keep in mind—there is a huge bearish CME gap that we have to pay attention to, as if we see any strong sell-off, then this would be our target for short.
Swallow Academy
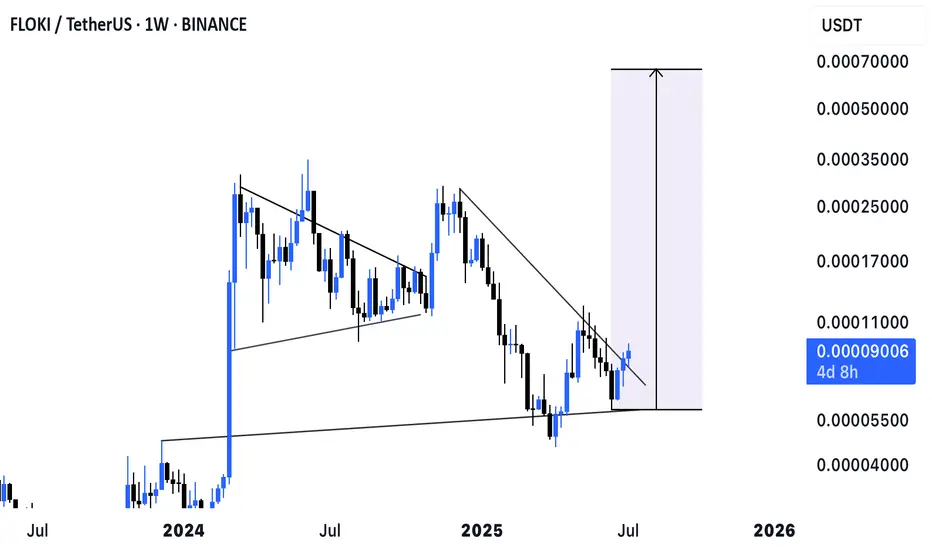
$FLOKI Weekly Breakout Alert!SEED_DONKEYDAN_MARKET_CAP:FLOKI Weekly Breakout Alert!
Price just broke a major downtrend on the weekly chart 📈
Accumulation rising, exchange reserves at 10-month low.
Valhalla mainnet is live—real utility kicking in.
This could be the start of a big pump. Targets: $0.0003 → $0.0006
#FLOKI #MemeCoin
#FLOKI/USDT#FLOKI
The price is moving within a descending channel on the 1-hour frame and is expected to break and continue upward.
We have a trend to stabilize above the 100 moving average once again.
We have a downtrend on the RSI indicator, which supports the upward move by breaking it upward.
We have a support area at the lower limit of the channel at 0.00008150, acting as strong support from which the price can rebound.
Entry price: 0.00008490
First target: 0.00008713
Second target: 0.00008887
Third target: 0.00009129
