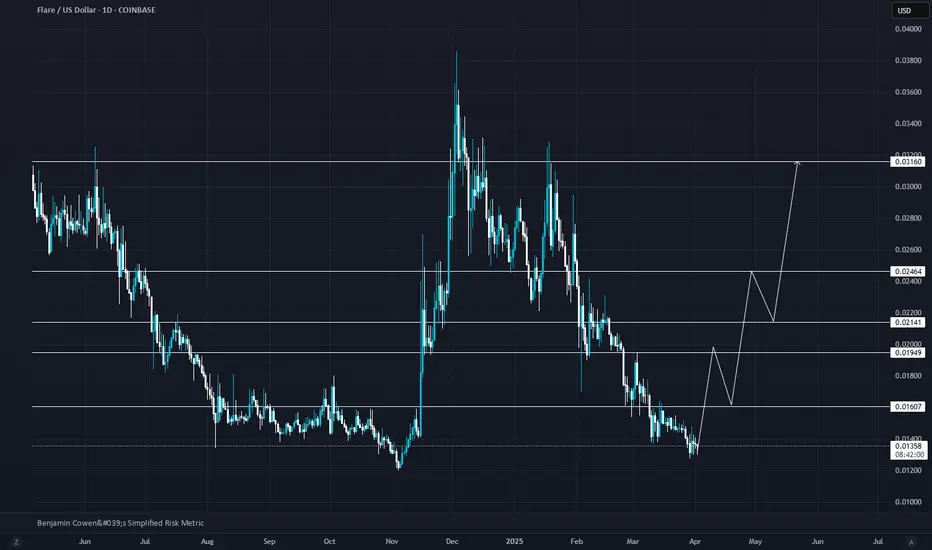
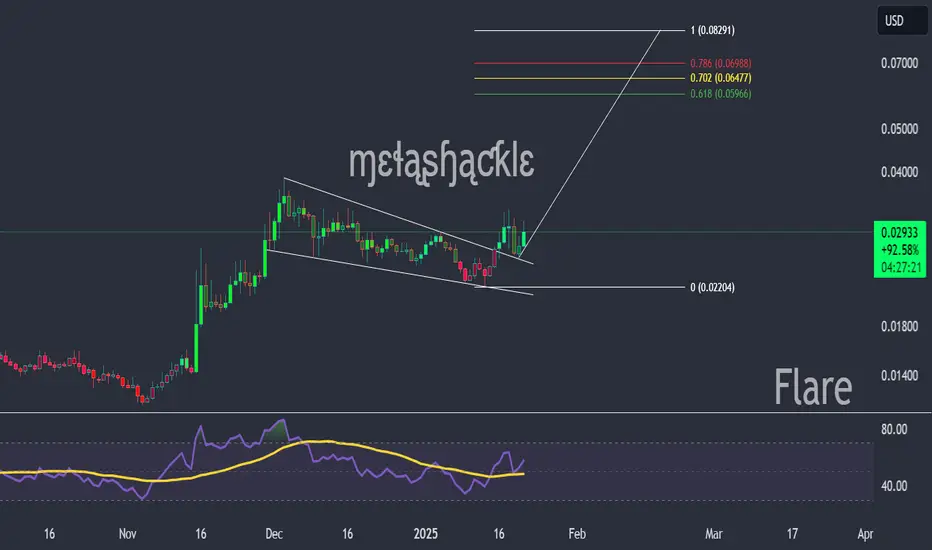
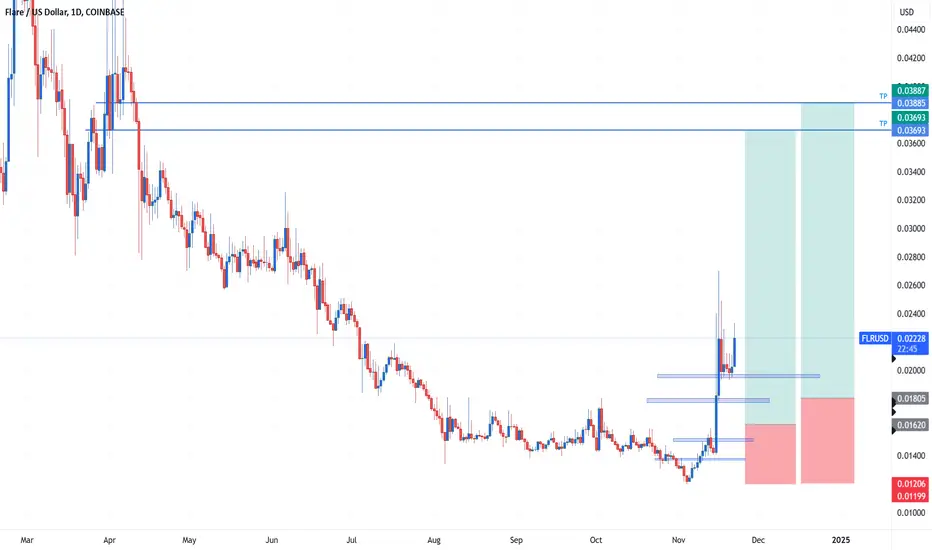
FLR/USD: Anticipating a Bullish Reversal from Key Support LevelsFLR/USD is showing strong potential for a bullish reversal after recently bouncing off critical support. The chart illustrates possible upward momentum through clearly marked horizontal resistance levels. Monitoring each of these levels closely will provide strategic entry and exit points.
Stay vig
Key stats
Related pairs
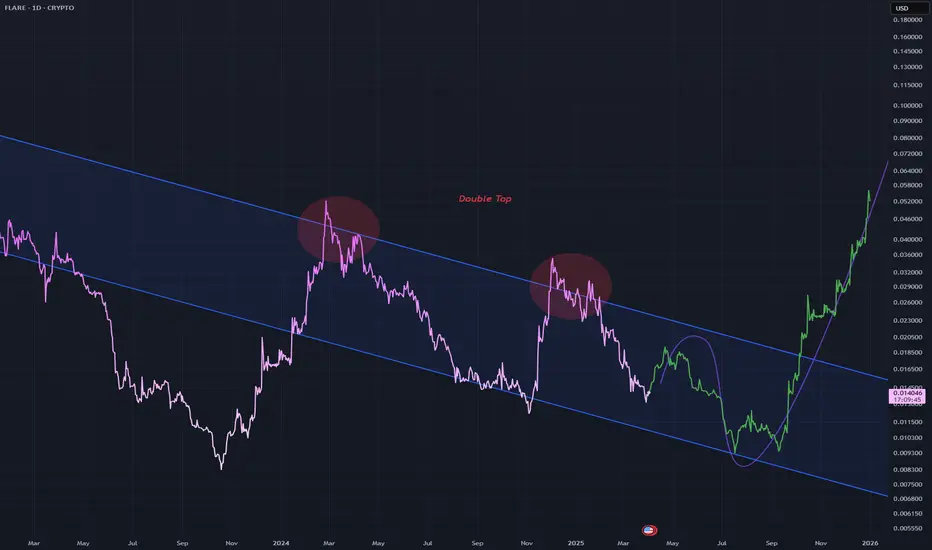
FLRUSD - Double Top A double top will push price down to the bottom of this channel in blue
From there price can form a bottom and start to head upwards rapidly once the bottom has formed
The double top is responsible for the current downward move
Daily chart
FLRUSD Currency Quote | Chart & Forecast SummaryKey Indicators On Trade Set Up In General
1. Push Set Up
2. Range Set up
3. Break & Retest Set Up
Notes On Session
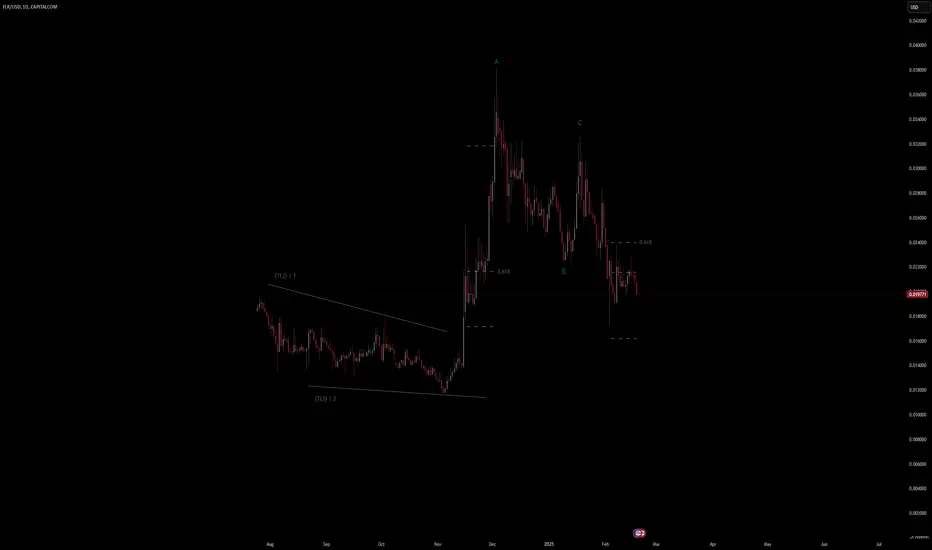
# FLRUSD Currency Quote
- Double Formation
* Trendline 1&2 | Entry Area | Long Support
* 1st Retracement + 0.618 Area | Subdivision 1
- Triple Formation
* ABC Flat Feature | Subdivisio
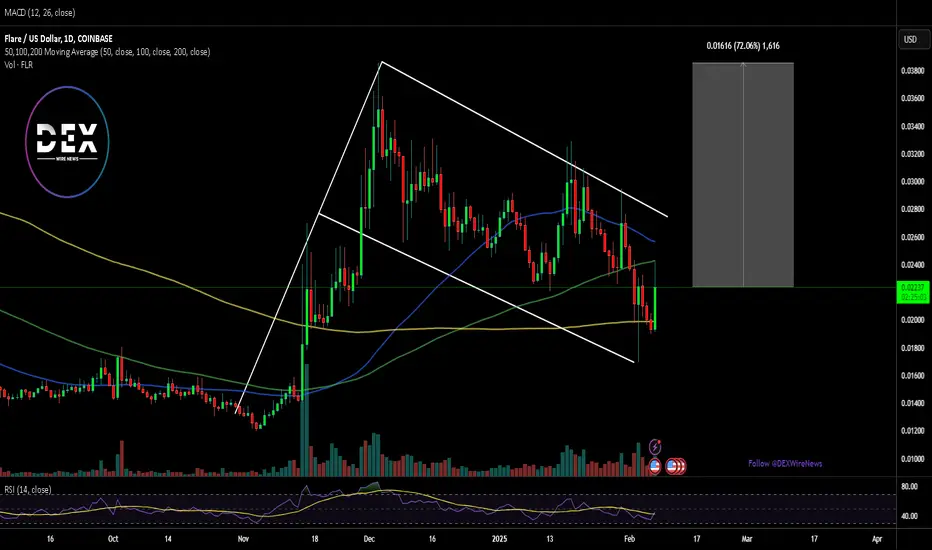
Breaking: $FLARE Soars 16.71% Amidst Bullish Flag PatternThe cryptocurrency market is no stranger to volatility, but Flare Network’s native token, NYSE:FLR , is making waves with a remarkable 16.71% surge today. Despite the broader crypto landscape remaining bearish, NYSE:FLR is defying the odds, showcasing strong technical and fundamental indicators t
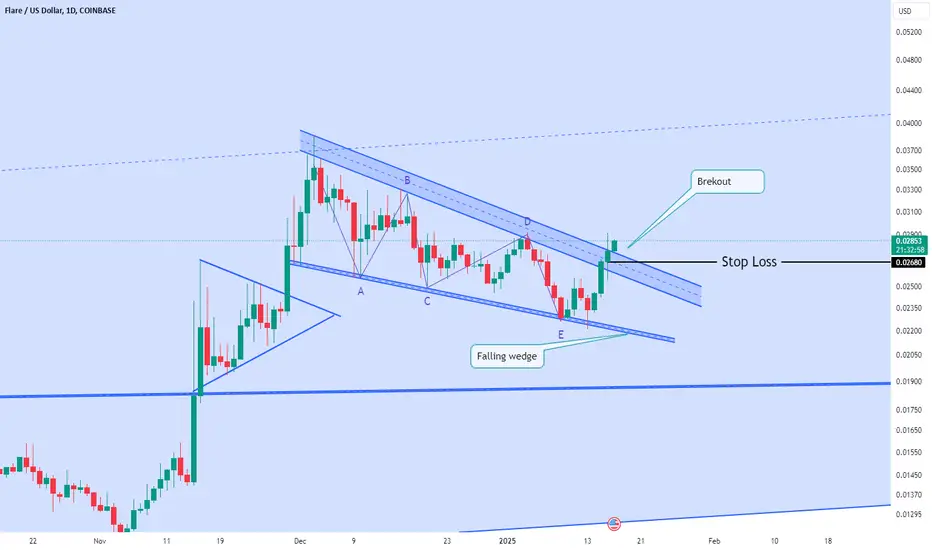
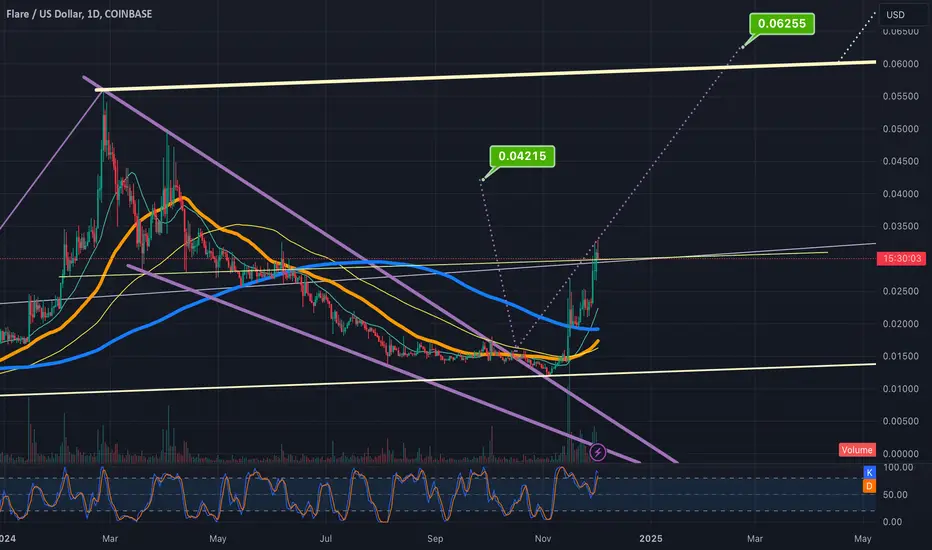
FLARE is setting up for a potential 100% + bullish move!After a successful backtest of the bullish descending wedge's upper trendline, Flare looks to be setting up for a move to the $0.06 - $0.07 range. If this move plays true, Flare could easily double over the next 3 to 6 weeks.
Good luck, and always use a stop-loss!
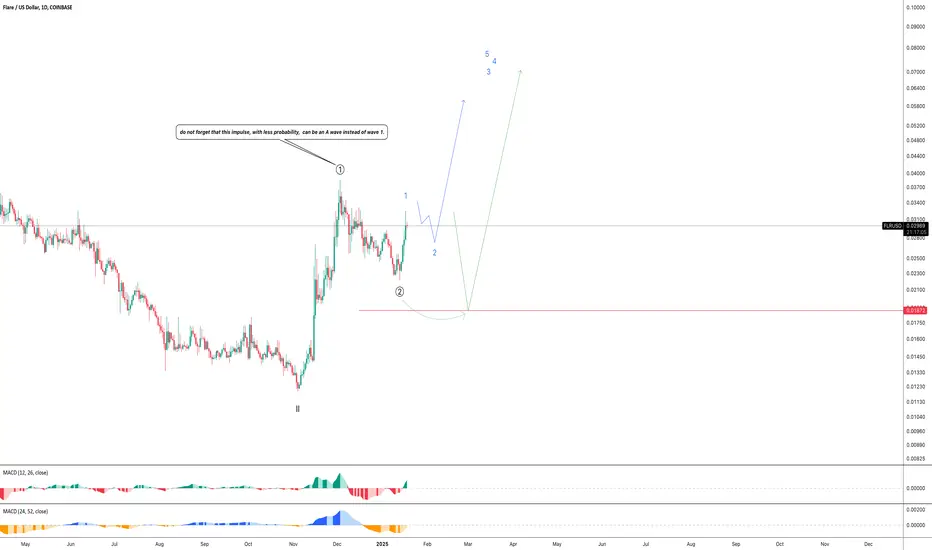
FLR updateThere is nothing I can add to my last idea of FLR except that there might be another correction down to red level line and starts from there.
For now I am waiting to see if this Intermediate impulse goes true.
Thanks
Falling wedge breakout - Alt COIN KingThis is ready to blast, This is also one of the alt coin have great capacity to go up
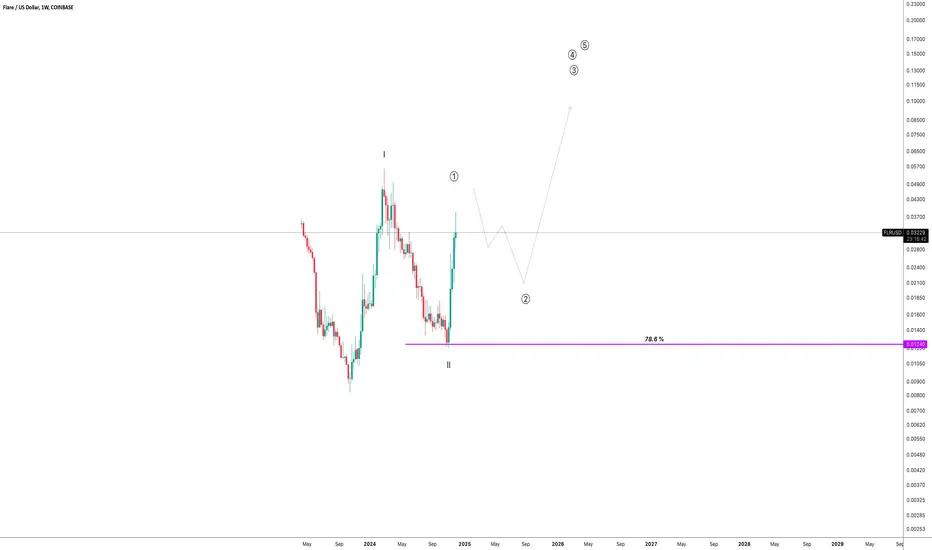
FLR in weekly chart I do not have anything more than that I published for this symbol in my last idea and it is a complementary road map for the future.
If you have not been able to get in this coin, please wait for a correction in this weekly chart and then start investing.
Please check my last idea of this chart.
Tha
FLR (Flare) Cryto Retracement Entry PotentialWith so much bullish wicking on the previous upside move, we may see a retracement for a market test at structure break areas. This would bea nice dollar cost average entry.
Flare breaking up from falling wedge that is also a bullpennantThe shorter dotted purple line is the breakout target for just the falling wedge alone. The much longer dotted purple line is the measured move / breakout target line for the entire pennant. As we can see the price action has treated this longer dotted purple line as exact wick resistance here now a
See all ideas
Displays a symbol's price movements over previous years to identify recurring trends.
Frequently Asked Questions
FLR (FLR) reached its highest price on Dec 3, 2024 — it amounted to 0.038074 USD. Find more insights on the FLR price chart.
See the list of crypto gainers and choose what best fits your strategy.
See the list of crypto gainers and choose what best fits your strategy.
FLR (FLR) reached the lowest price of 0.010811 USD on Apr 7, 2025. View more FLR dynamics on the price chart.
See the list of crypto losers to find unexpected opportunities.
See the list of crypto losers to find unexpected opportunities.
The safest choice when buying FLR is to go to a well-known crypto exchange. Some of the popular names are Binance, Coinbase, Kraken. But you'll have to find a reliable broker and create an account first. You can trade FLR right from TradingView charts — just choose a broker and connect to your account.
You can discuss FLR (FLR) with other users in our public chats, Minds or in the comments to Ideas.