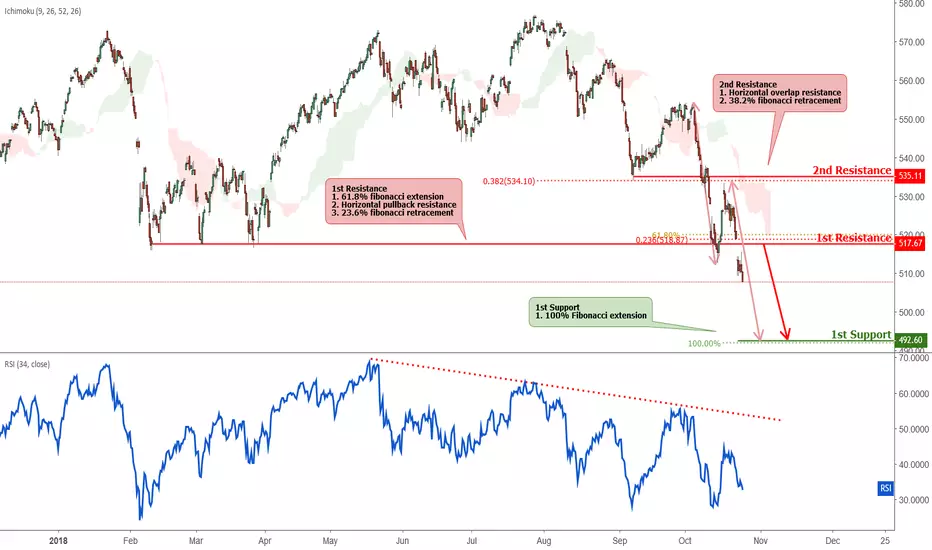
AEX approaching resistance, potential drop! AEX is approaching our first resistance at 517 (horizontal pullback resistance, 23.6% Fibonacci retracement, 61.8% Fibonacci extension) where a strong drop might occur below this level pushing price down to our first support at 492 (100% Fibonacci extension).
RSI (34) and ichimoku cloud is also facing bearish pressure where we might see a corresponding drop in price.
NL25 trade ideas
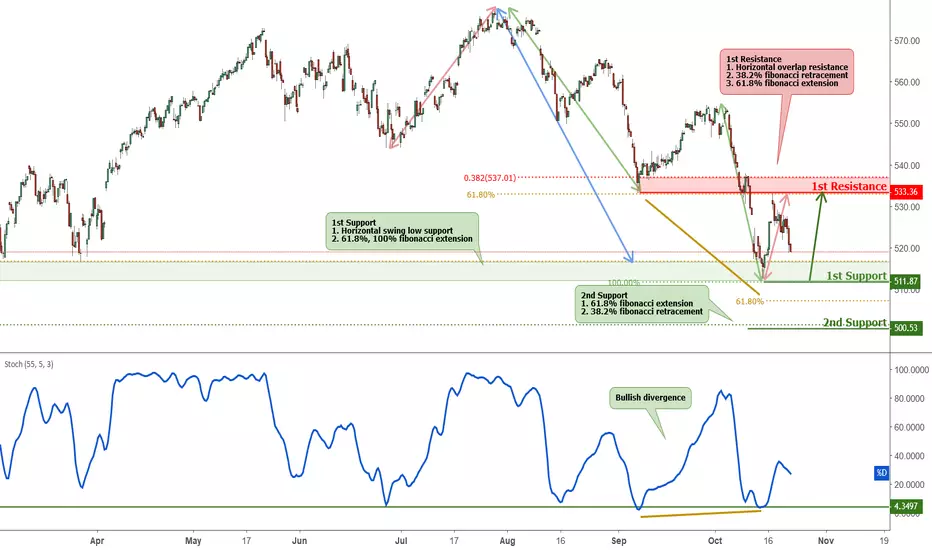
AEX is approaching support, potential bounce! AEX is approaching our first support at 506 (horizontal swing low support, 100% Fibonacci extension, 38.2% Fibonacci retracement) where a strong bounce might occur above this level pushing price up to our first resistance at 533 (horizontal overlap resistance, 38.2% Fibonacci retracement).
Stochastic (55,5,3) is also seeing a bullish divergence and we might see a corresponding bounce in price should it bounce off this level.

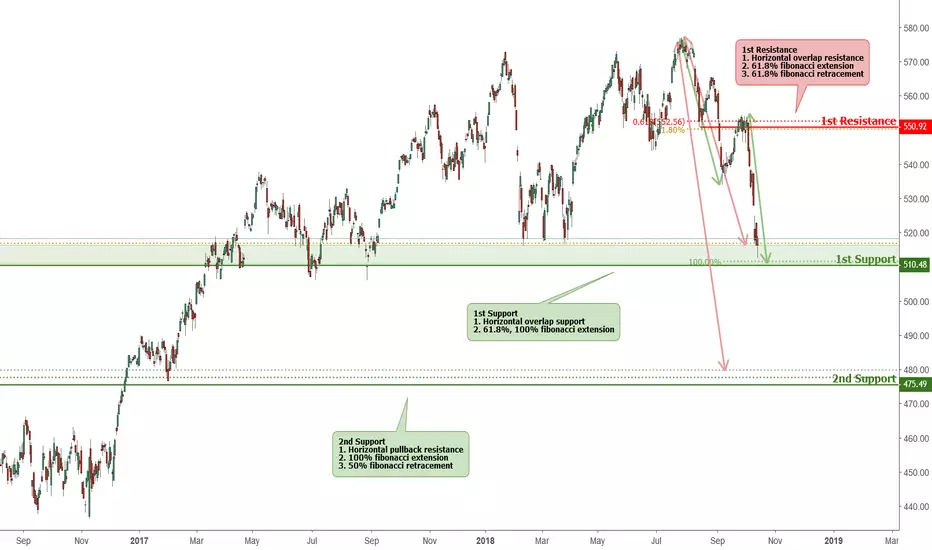
AEX approaching support, potential bounce! AEX is approaching our first support at 511 where a strong bounce might occur above this level pushing price up to our major resistance at 533 (horizontal overlap resistance, 38.2% Fibonacci retracement, 61.8% Fibonacci extension). Stochastic (55,5,3) is also approaching support and seeing a bullish divergence and we might see a corresponding rise in price should it bounce off this level.
Trading CFDs on margin carries high risk.
Losses can exceed the initial investment so please ensure you fully understand the risks.
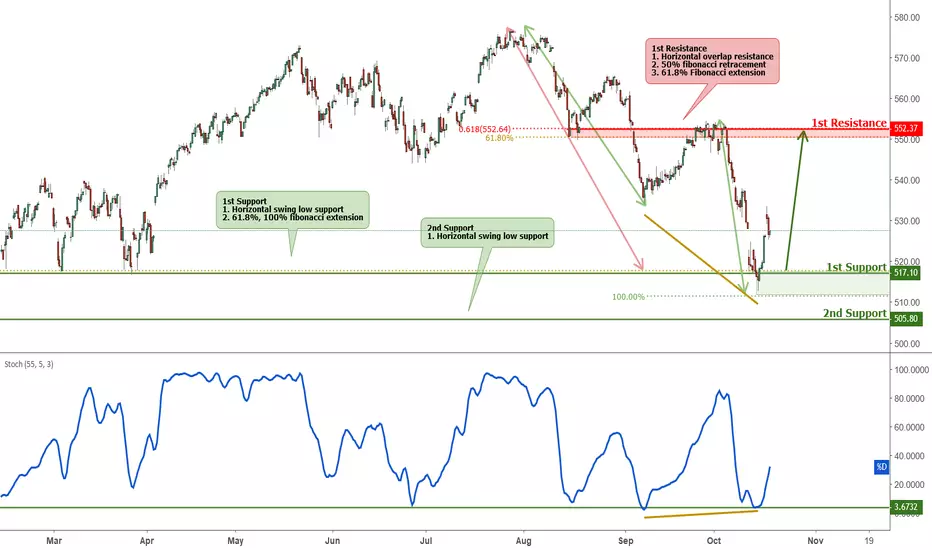
AEX approaching support, potential bounce! AEX is approaching our first support at 517.10 (horizontal swing low support, 61.8%, 100% Fibonacci extension ) and a strong bounce might occur above this level pushing price up to our major resistance at 552.37 (horizontal overlap resistance, 50% Fibonacci retracement ). Stochastic (55,5,3) is also seeing a bullish divergence and approaching support where a bounce off this level might see a corresponding rise in price.

AEX approaching support, potential bounce! AEX is approaching our first support at 517.10 (horizontal swing low support, 61.8%, 100% Fibonacci extension) and a strong bounce might occur above this level pushing price up to our major resistance at 533.25 (horizontal pullback resistance, 100% Fibonacci extension, 50% Fibonacci retracement). Stochastic (55,5,3) is also seeing a bullish divergence and approaching support where a bounce off this level might see a corresponding rise in price.

AEX- Daily Key ElementsKey levels to look out for AEX . Please refer to our 4hr chart for a strategic view!
DOUBLE TOPS ADAM & EVE (AEX) (NETHERLANDS)Dutch index has double top formation and it is just above the neckline. After breakout formation will be more reliable. Target price has been given on the chart. Good luck !

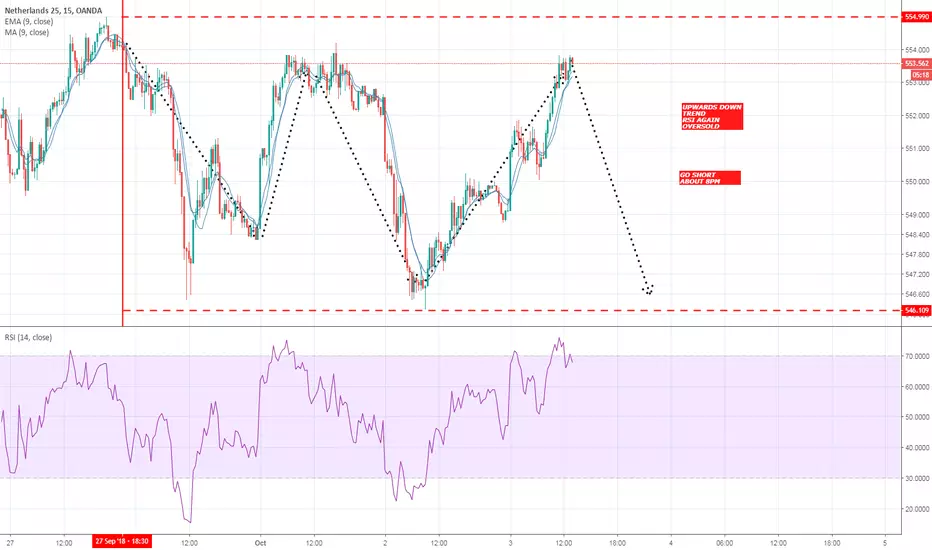
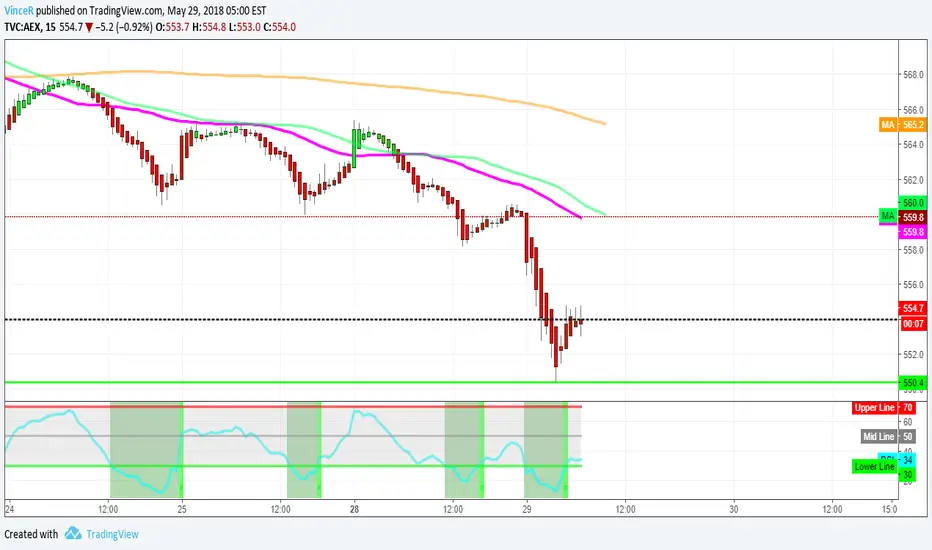
Great set up for another potential short move Perfect example of Support becomes Resistance.
Price bounced of nicely from the FIB level 61.80% with a bearish engulfing candle.
TP: Near 535.00 level
SL: above 555.000

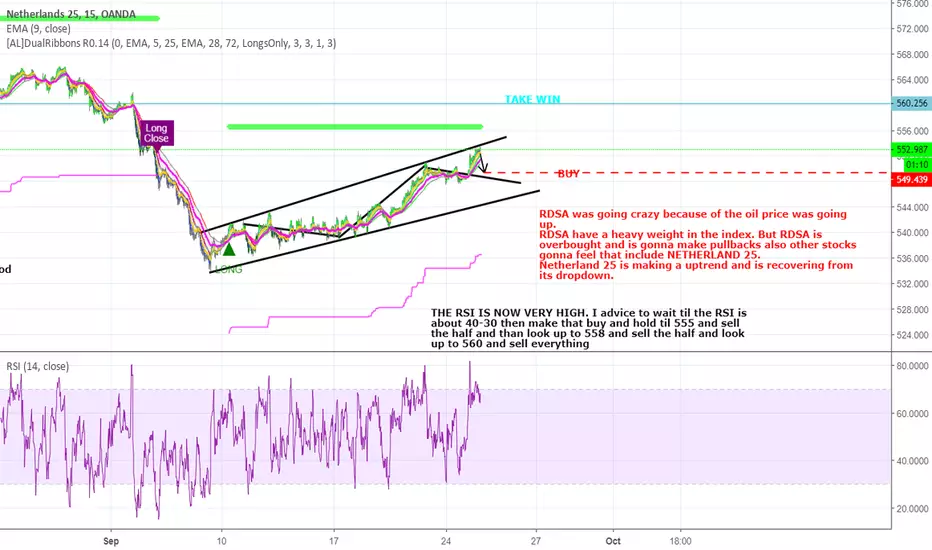
NETHERLANDS 25 (AEX)I will update the FUNDEMENTALS soon . (working on it) but lets wait and watch for the buy point.
And soon i will update you if the fundemental is going with the TA.
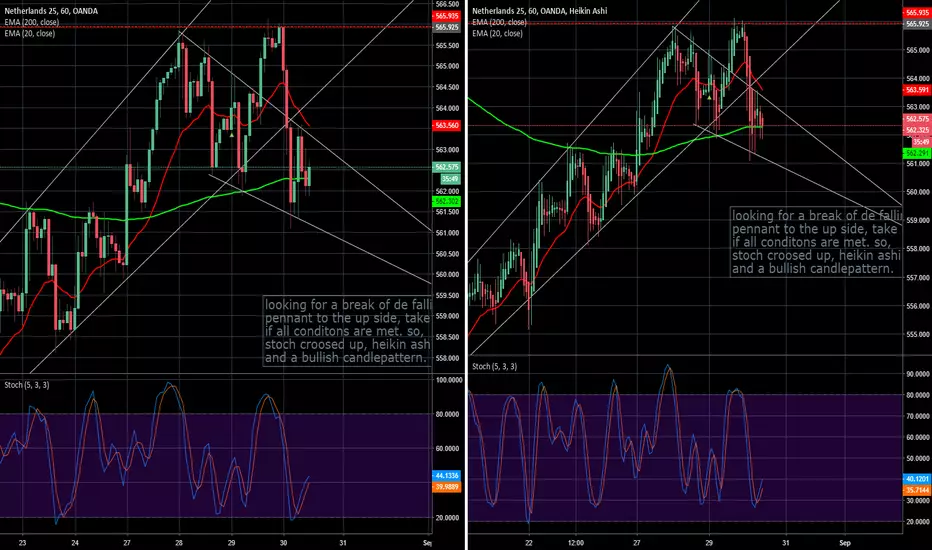
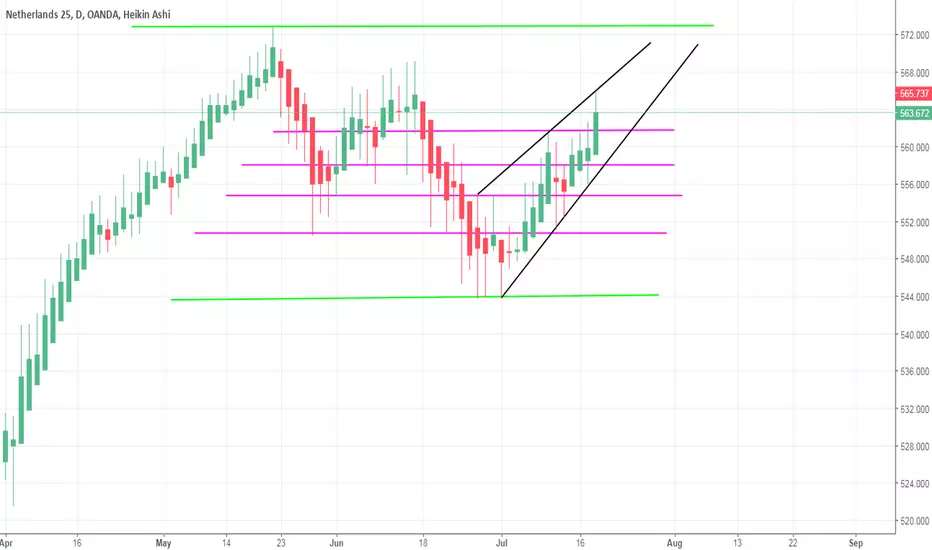
bullish falling pennentOANDA:NL25EUR . Looking for a break of de falling pennant to the up side, take de entrie if all conditons are met. so,
stoch croosed up, heikin ashi green and a bullish candlepattern.
long nl 25, hit on bottom channelim going long OANDA:NL25EUR because price has hit de bottom of te rising channel. the k line has crossed de d line up on stoch and heikin ashi has turned green.

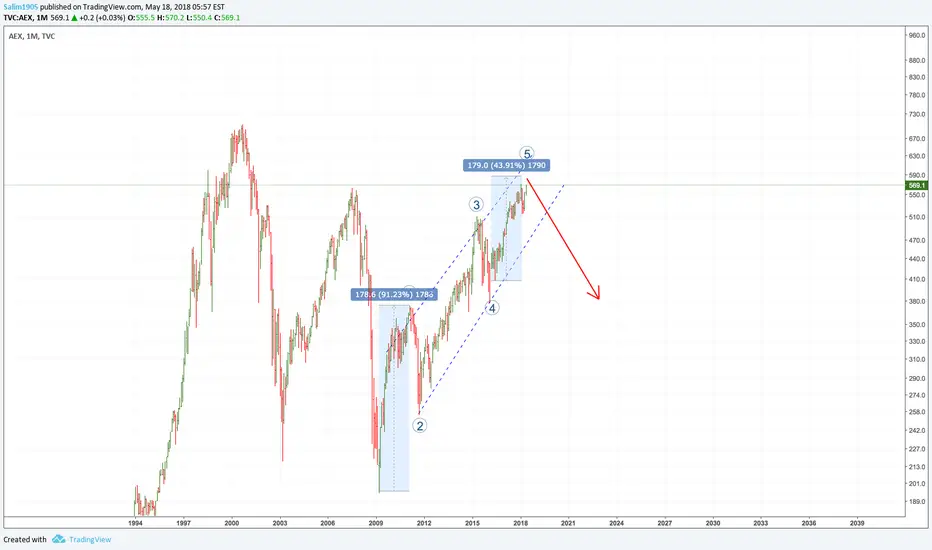
Long slow bullNow that the dutch AEX broke it's 2007 for some time .. what are the new expectations?
This is just a TA based view on patterns and indicators on weekly chart.
As we see the previous two bullruns put into trending channels we can see that the current one is the longest and less strong in terms of run up power.
With the top of 2007 behind us and the ATH of 703.18 it might be an even longer bull.
Leading US indexes have seen a stronger bull and are currently in consolidation phase for another leg up.. lack of selling pressure, multiple bullish patterns forming etc.. wich will drag other indices such as the AEX along with them.
The recent weekly trending channel suggests that for reaching the ATH of 703.18 would not be before 2023! wich brings us into another 4 years of bull at least.. as long global economy is presenting growth and announcing supportive measures wherever needed.
For now.. the bull is still on.
Just ride it.

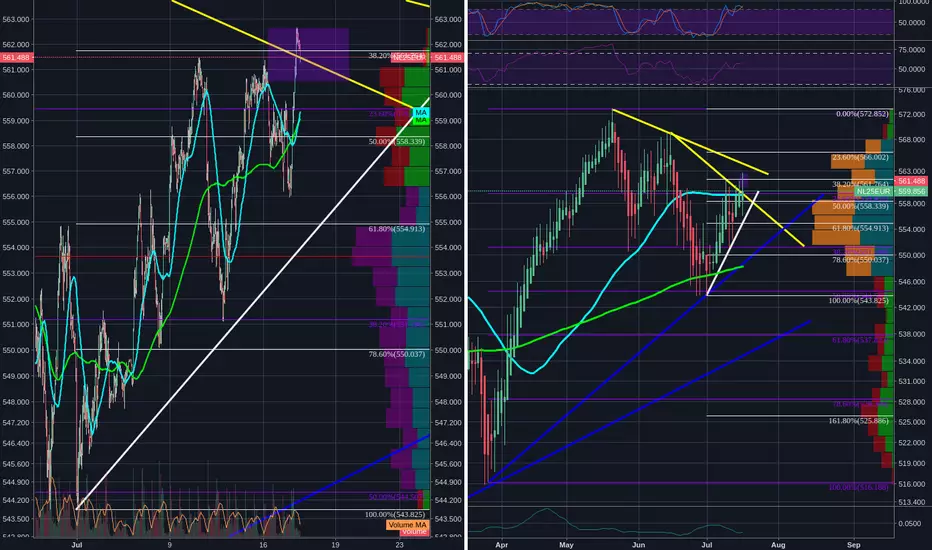
NL25EUR-Will look to actively allocate, on the condition that the price remains above the yellow trend line(first one)
-Similar setups can be observed on OANDA:DE30EUR and OANDA:FR40EUR
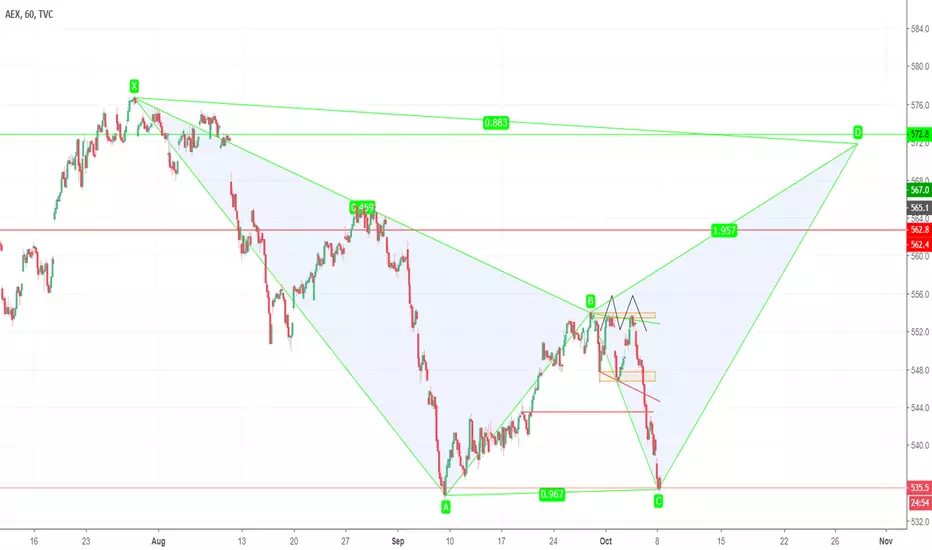
AEX possible bullish bat setupI'm in the process of learning harmonics - please don't blindly trade based off this.


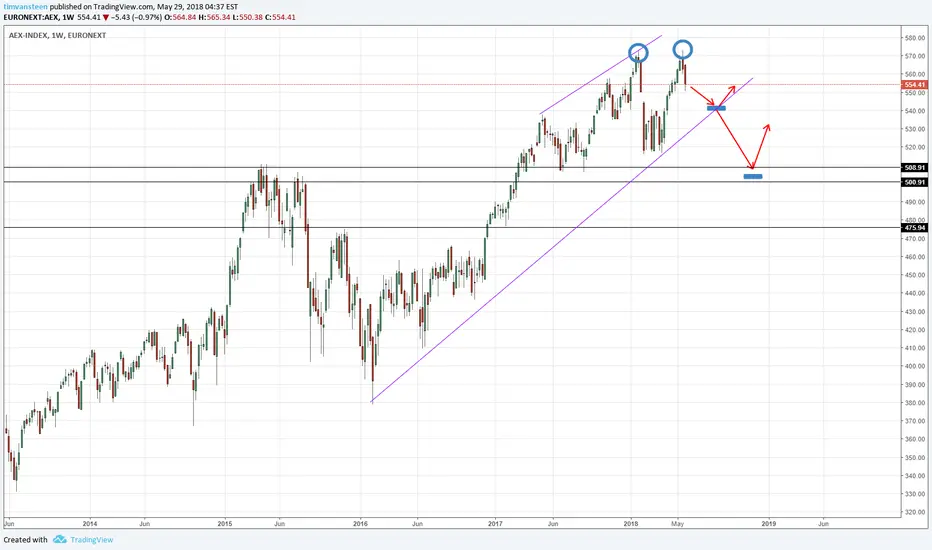
Another EUROPE stock market that's going bearishAEX is running out of steam and created a zone of rejection at the all time highs. Price is now likely to go down.
What might potentially happen:
- Price goes down to 540 area and bounce back
- Prices goes down to 540 area and break further down towards the 500-510 area.
AEX bull run over?Just an idea, I used fractals from the run before and it looks like the current situation. the RSI is bearish, and the 12345 eliott wave SHOULD be completed. This is just an experiment, don't trade based on this.
