FORMUSDT Forming Bullish WaveFORMUSDT is currently shaping a bullish wave pattern, signaling a potential upward continuation in price. This technical structure is typically characterized by impulsive moves followed by brief consolidations, suggesting growing investor confidence. The pair has recently shown strength with higher
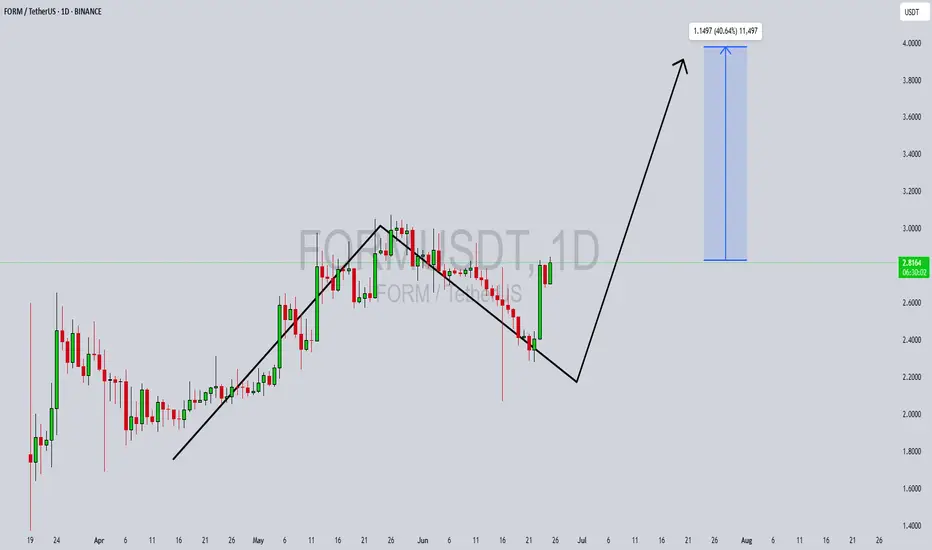
$FORM/USDT Breakout.$FORM/USDT just reclaimed a key demand zone after a breakout below the trendline.
The strong bullish candle signals a possible reversal, with upside potential toward $3.4456.
As long as the price holds above $2.6072–$2.7054, bulls are in control. MACD also hints at a momentum shift.
DYRO, NFA
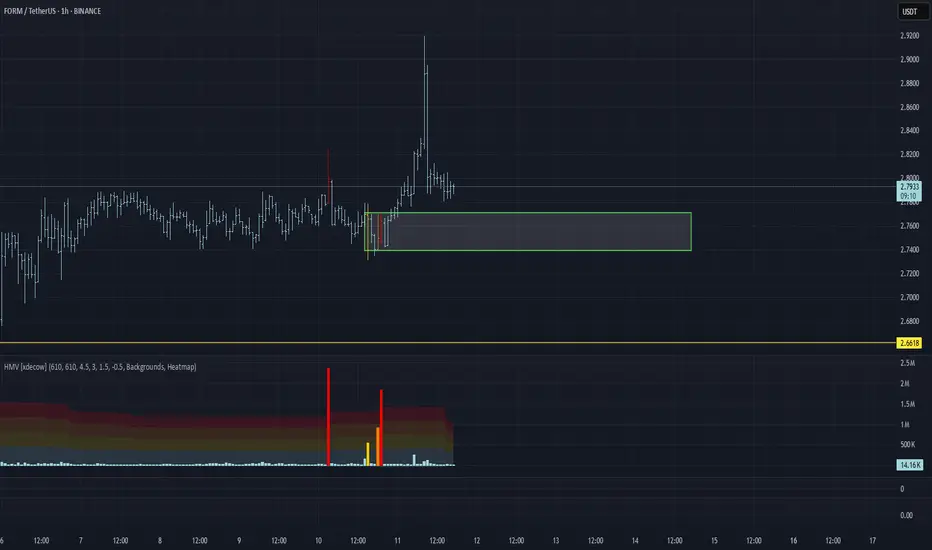
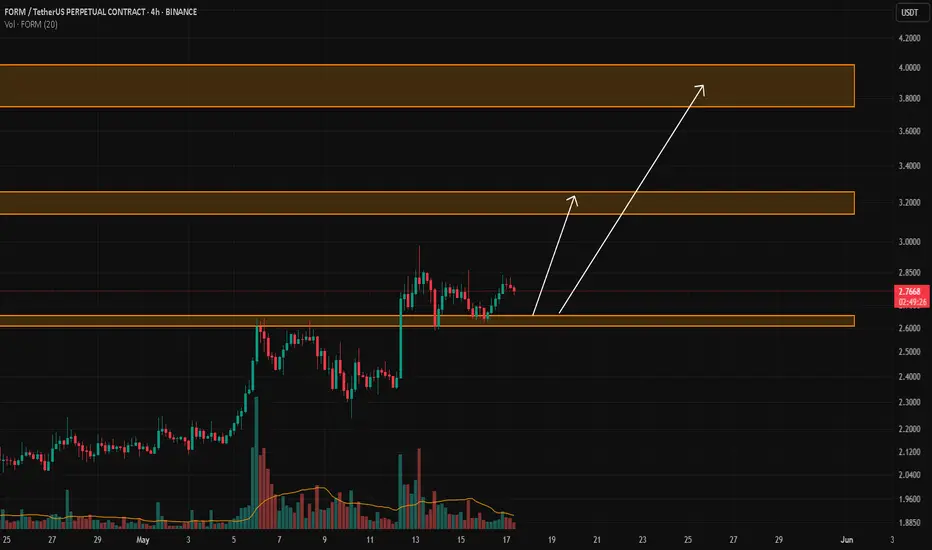
FORM/USDT Analysis: Another Growth Wave Possible
For this token, abnormal buying by a large player has been visible for several days, followed by strong moves with very low volume.
One of these zones is $2.77–$2.74. We consider buying from this zone if a reaction appears.
This publication is not financial advice.
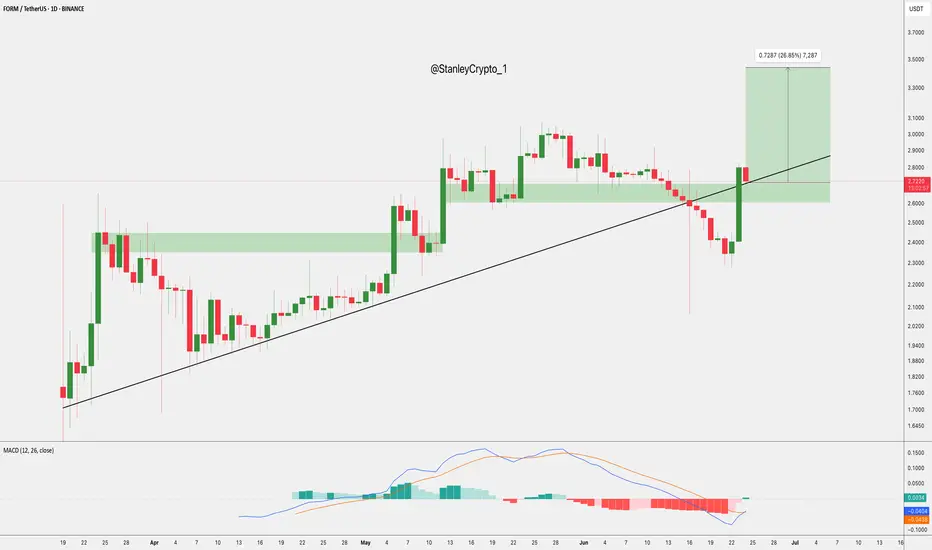
FORM/USDT – A Classic Breakout in Play
Date: May 13, 2025
FORM is finally breaking free from its long consolidation. After a textbook accumulation phase, we’re seeing a clean breakout above the $2.75 horizontal resistance, supported by rising volume and a strong RSI push into overbought territory.
📊 Technical Snapshot:
Breakout Level

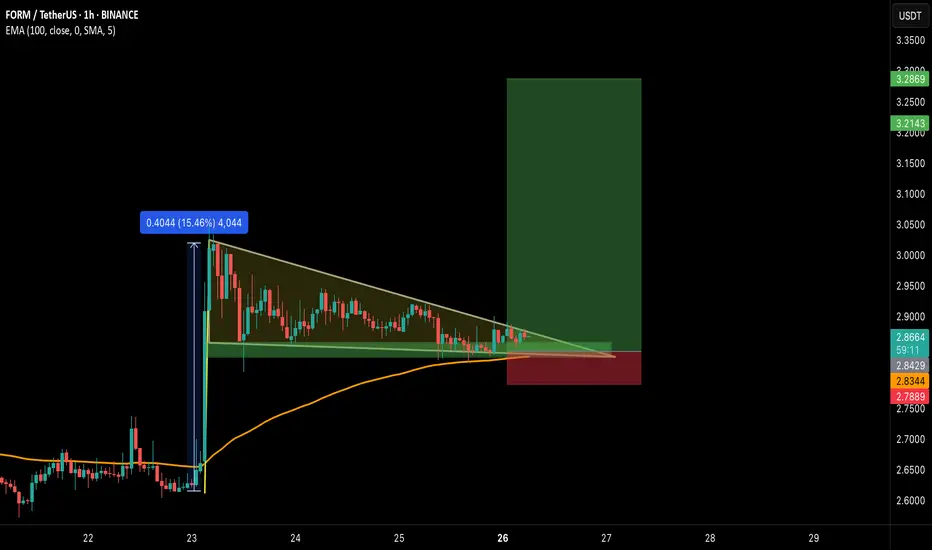
FORM/USDT: LONG SCALP SETUP!!🚀 FORM Bull Pennant Breakout – 15% Potential Incoming?! 👀🔥
Hey Traders! If you're all about high-conviction plays and real alpha, smash that 👍 and tap Follow for more setups that actually deliver! 💹💯
FORM is consolidating within a bullish pennant on the 1H chart after a strong 15% impulse move — c
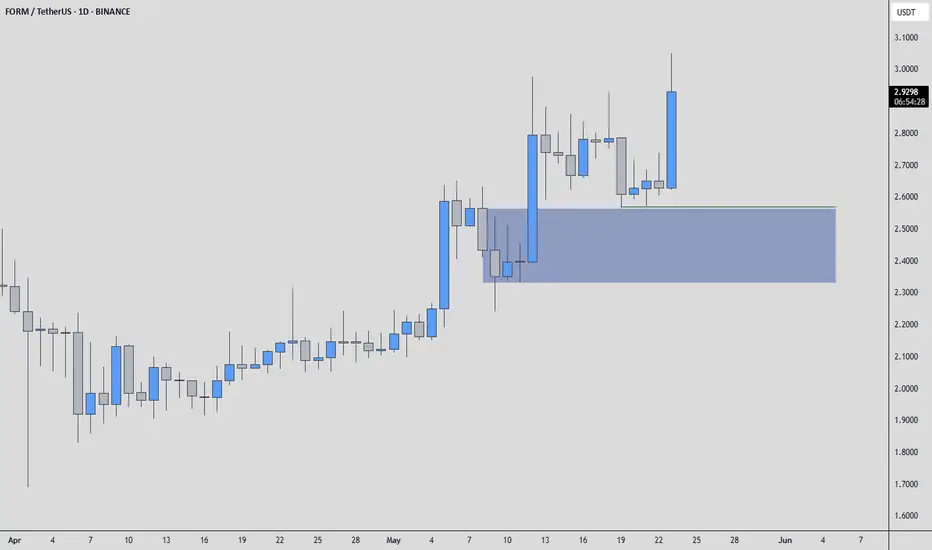
FORMUSDT | Buyer Interest Around the Blue BoxFORMUSDT is showing active buyers, and the blue box below stands out as a strong potential demand zone.
If price returns there, I’ll be looking for confirmation on lower timeframes. The setup is simple — strong zone, active interest, and a clear structure to lean on.
“I will not insist on my short
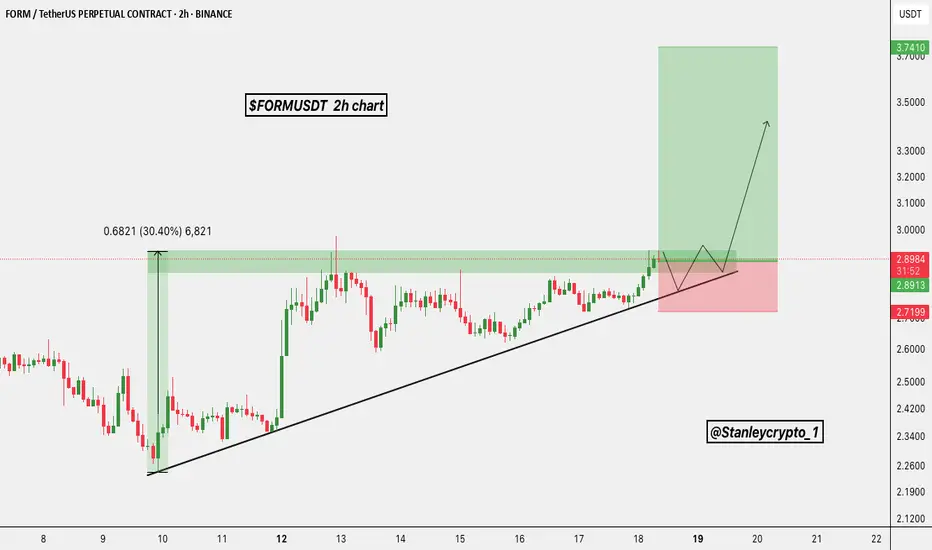
$FORM Trade Setup 2H ChartPrice is consolidating below key resistance after a strong 30% move.
- Forming higher lows with bullish structure
- Breakout + Retest scenario in play
- Target: $3.74
- Stop-loss: $2.72
Watch for a breakout and retest entry for a low-risk, high-reward move! 👀🚀
DYRO, NFA
FORM/USDTKey Level Zone: 2.6080 - 2.6550
HMT v8.1 detected. The setup looks promising, supported by a previous upward/downward trend with increasing volume and momentum, presenting an excellent reward-to-risk opportunity.
HMT (High Momentum Trending):
HMT is based on trend, momentum, volume, and market str
FORM PERPETUAL TRADE ,Sold From $2.76FORM PERPETUAL TRADE
FORM SELL SETUP
Currently $2.76
Sold From $2.76
(Trading plan If FORM go up to $2.86
will add more shorts)
Expecting target $2.67 OR DOWN
Incase of early exist will update this anaylsis
Its not a Financial advice

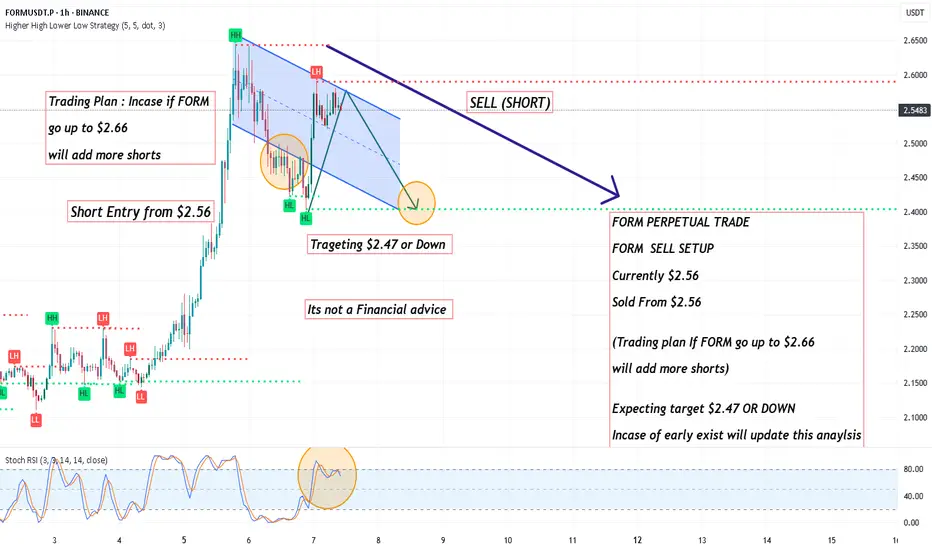
FORM PERPETUAL TRADE , Sold From $2.56FORM PERPETUAL TRADE
FORM SELL SETUP
Currently $2.56
Sold From $2.56
(Trading plan If FORM go up to $2.66
will add more shorts)
Expecting target $2.47 OR DOWN
Incase of early exist will update this anaylsis
Its not a Financial advice
See all ideas
Summarizing what the indicators are suggesting.
Oscillators
Neutral
SellBuy
Strong sellStrong buy
Strong sellSellNeutralBuyStrong buy
Oscillators
Neutral
SellBuy
Strong sellStrong buy
Strong sellSellNeutralBuyStrong buy
Summary
Neutral
SellBuy
Strong sellStrong buy
Strong sellSellNeutralBuyStrong buy
Summary
Neutral
SellBuy
Strong sellStrong buy
Strong sellSellNeutralBuyStrong buy
Summary
Neutral
SellBuy
Strong sellStrong buy
Strong sellSellNeutralBuyStrong buy
Moving Averages
Neutral
SellBuy
Strong sellStrong buy
Strong sellSellNeutralBuyStrong buy
Moving Averages
Neutral
SellBuy
Strong sellStrong buy
Strong sellSellNeutralBuyStrong buy