Thu 2024 10 03 - Short -||| Stats |||
Stats Day:
** 08:00 H4 double color, - Short
** 09:30 VOLD ???, AD ???, Senti ???, Agio St ???, Lg ???, - Range/Long/Short
** 09:45 VOLD ???, AD ???, Senti ???, Agio St ???, Lg ???, - Range/Long/Short
** 16:15 VOLD ???, AD ???, Senti ???, Agio St ???, Lg ???, - Range/Long/Short
Stats Week:
** Fri US NFP 14:30:,
** Mon Morning rule - pending,
** Tue return to W1 trend and not a W1 trend change - pending,
Stats Month:
** Oct turn,
Stats Year:
** US Election,
||| Trade Taken |||
Trade Taken:
** Time frame:
* H4
** Time:
* 08am,
Set-Up:
** Trigger for trade:
* 8am H4 double color Short,
* m45 close outside m45 BB Long/Short
Risk Reward:
** Risk:
* H4 double start
** Target:
* R 1:1 as still against H3 trend
* although a smaller H3 confirmed counter trend (3 H3 Mom) started,
GER40 trade ideas

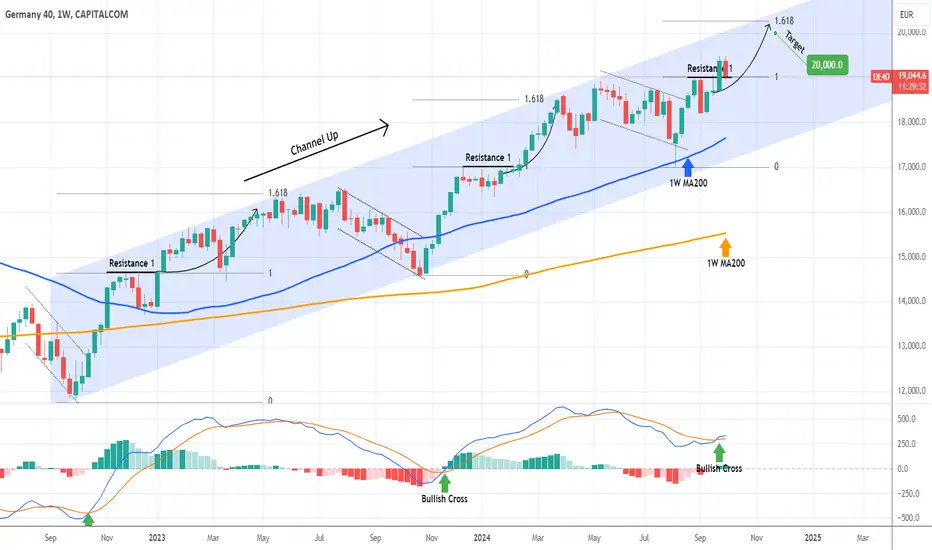
DAX This week offers a great buying opportunity.DAX (DE40) has been trading within the same Channel Up since the bottom of the Inflation Crisis on the week of October 03 2022. The recent August 05 rebound on the 1W MA200 (blue trend-line) was nothing but the start of the new Bullish Leg of the pattern, the 3rd in total.
The previous two, following their respective Bearish Legs (dotted Channel Down), they first reached a Resistance just above the previous High and after a pull-back and break-out above it, the continued for the 2nd part of the Leg.
It appears that in symmetrical terms, we are exactly there, right before the start of the 2nd phase of the Bullish Leg. Interestingly enough, the 1W MACD completed a Bullish Cross just last week (been the most solid bottom confirmation in the past Legs) so if anything, the rally could be even stronger.
In any case, keeping in mind the strict Resistance offered by the Higher Highs trend-line of the Channel Up, our target is still 20000, which is just below the 1.618 Fibonacci extension. That is the Fib level where both previous Higher Highs of the Channel Up were priced.
-------------------------------------------------------------------------------
** Please LIKE 👍, FOLLOW ✅, SHARE 🙌 and COMMENT ✍ if you enjoy this idea! Also share your ideas and charts in the comments section below! This is best way to keep it relevant, support us, keep the content here free and allow the idea to reach as many people as possible. **
-------------------------------------------------------------------------------
💸💸💸💸💸💸
👇 👇 👇 👇 👇 👇
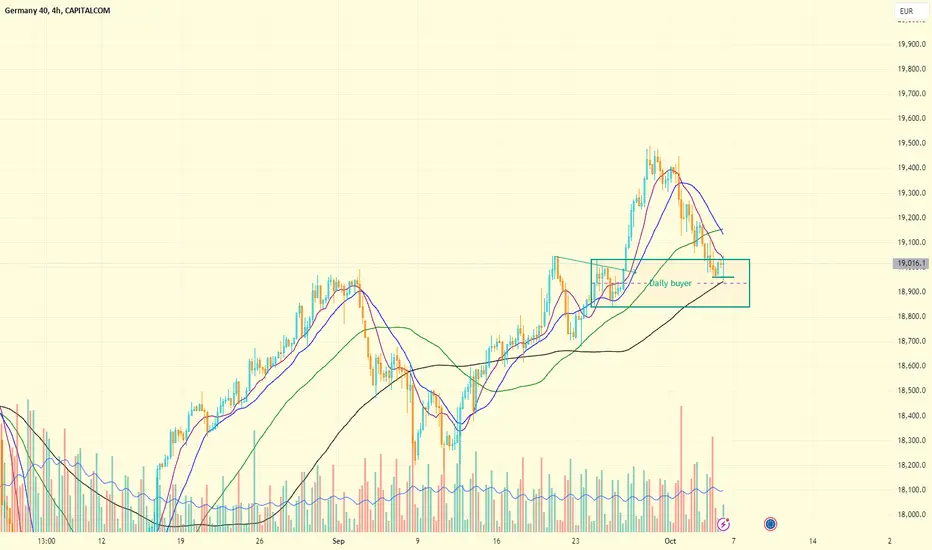
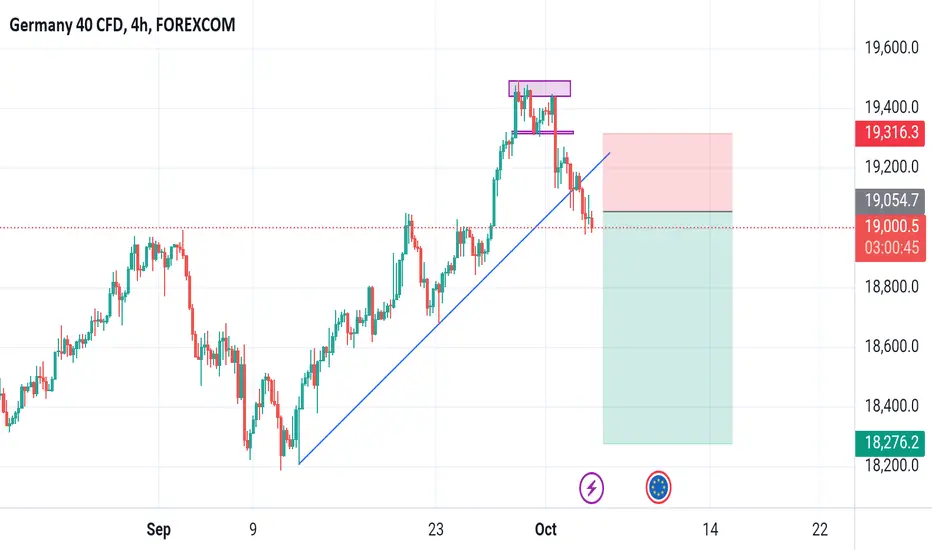
DE40The German index DE40 has reached a zone where Daily timeframe buyers might step in, with a good chance of driving the price back up.
The signal is to buy, but where to find the exact entry is something that each individual can figure out. I prefer to buy now, with a stop-loss slightly below the daily lows or if you are searching for best R:R, then wait until the price enters even deeper into the zone.
In any case, stay cautious, as NFP could also cause some price fluctuations.
Trade safe!
GER40 intraday short IdeaContext short
target PDL
entry Asia H or NY 1h Fractal or London sweep Frank

Dax nfp short ?Dax sell idea,
Weekly sell, monthly sell,
Us election coming,
War of Israel Iran, increase in oil price not good for European countries.
, combine with your setup,
DAX H4 | Bullish bounce off 61.8% Fibonacci support?The DAX (GER30) has reversed off a pullback support and could potentially climb higher from here.
Buy entry is at 19,000.03 which is a pullback support that aligns with the 61.8% Fibonacci retracement level.
Stop loss is at 18,800.00 which is a level that lies underneath a pullback support and the 78.6% Fibonacci retracement level.
Take profit is at 19,337.11 which is a pullback resistance that aligns close to the 61.8% Fibonacci retracement level.
High Risk Investment Warning
Trading Forex/CFDs on margin carries a high level of risk and may not be suitable for all investors. Leverage can work against you.
Stratos Markets Limited (www.fxcm.com):
CFDs are complex instruments and come with a high risk of losing money rapidly due to leverage. 62% of retail investor accounts lose money when trading CFDs with this provider. You should consider whether you understand how CFDs work and whether you can afford to take the high risk of losing your money.
Stratos Europe Ltd (www.fxcm.com):
CFDs are complex instruments and come with a high risk of losing money rapidly due to leverage. 59% of retail investor accounts lose money when trading CFDs with this provider. You should consider whether you understand how CFDs work and whether you can afford to take the high risk of losing your money.
Stratos Trading Pty. Limited (www.fxcm.com):
Trading FX/CFDs carries significant risks. FXCM AU (AFSL 309763), please read the Financial Services Guide, Product Disclosure Statement, Target Market Determination and Terms of Business at www.fxcm.com
Stratos Global LLC (www.fxcm.com):
Losses can exceed deposits.
Please be advised that the information presented on TradingView is provided to FXCM (‘Company’, ‘we’) by a third-party provider (‘TFA Global Pte Ltd’). Please be reminded that you are solely responsible for the trading decisions on your account. There is a very high degree of risk involved in trading. Any information and/or content is intended entirely for research, educational and informational purposes only and does not constitute investment or consultation advice or investment strategy. The information is not tailored to the investment needs of any specific person and therefore does not involve a consideration of any of the investment objectives, financial situation or needs of any viewer that may receive it. Kindly also note that past performance is not a reliable indicator of future results. Actual results may differ materially from those anticipated in forward-looking or past performance statements. We assume no liability as to the accuracy or completeness of any of the information and/or content provided herein and the Company cannot be held responsible for any omission, mistake nor for any loss or damage including without limitation to any loss of profit which may arise from reliance on any information supplied by TFA Global Pte Ltd.
The speaker(s) is neither an employee, agent nor representative of FXCM and is therefore acting independently. The opinions given are their own, constitute general market commentary, and do not constitute the opinion or advice of FXCM or any form of personal or investment advice. FXCM neither endorses nor guarantees offerings of third-party speakers, nor is FXCM responsible for the content, veracity or opinions of third-party speakers, presenters or participants.

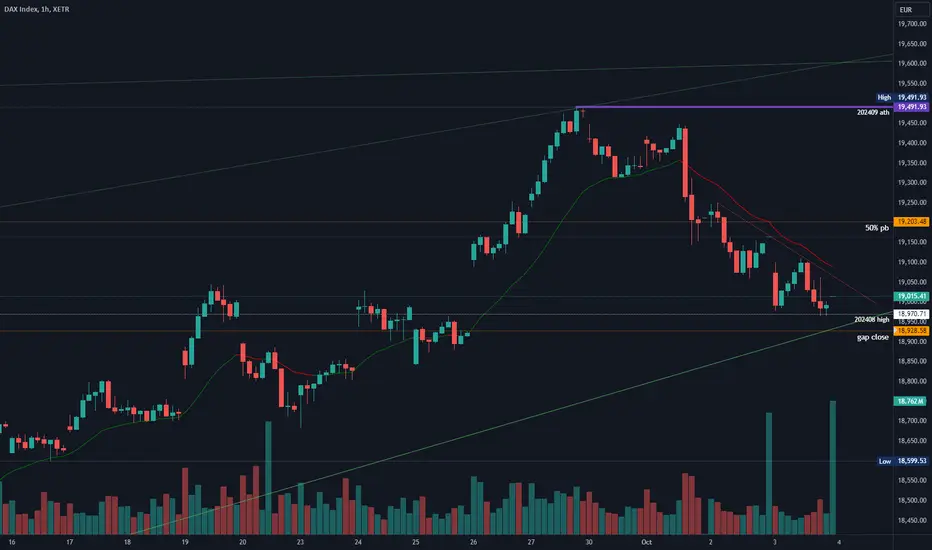
2024-10-03 - priceactiontds - daily update - daxGood Evening and I hope you are well.
tl;dr
dax - Look at the xetra 1h chart because it’s clearer there than on futures. 4 legs down and we have not touched the 1h 20ema on xetra since Tuesday. Strong follow through selling and there is an open gap down to 18928. Since we are seeing continues episodes of buying, I do expect this gap to get closed on a spike and we might go neutral or green into the weekend. We are right at the bull trend line from beginning of August and I highly doubt it will get broken on the second touch.
comment : Clear picture on the xetra chart. Close enough to the bull trend line to expect a big bounce upwards to 19200 or higher. If bears win this, next good support is 18800ish. I favor the bulls if they break strongly above the 1h 20ema tomorrow.
current market cycle: bull trend (big trend line is currently at 18950 on xetra)
key levels: 19000 - 20000
bull case: Bulls are trying and buying in between the bear legs and one side will give up for a bigger move soon. Since this is the second touch of the bull trend line from early August, I have to favor the bulls. Their first target is a 1h bar close above 19100 and if the move is strong enough, we see more bears giving up and they will probably wait before shorting again higher. Second target is 19200 (50% pullback).
Invalidation is below 18800.
bear case: Bears continue to sell every rip near the 1h 20ema but the selling is getting weaker and they barely made new lows today. It’s either go big or go home for the bears. Strong break below the bull trend line 18900 is their only option or give up and try to short higher (19200 or wait for 19500).
Invalidation is above 19150.
short term: Neutral again at 19000. Big round number, should be huge support and my bias is bullish for tomorrow.
medium-long term - Update from 2024-09-01: 4 Months left in 2024 and I do think the market is in a trading range where the upper area is around 19000 and the lower area is probably 17000 or 16000 if something bigger comes up. Since we are at the very top, I expect the market to go some sideways before trying to go down again. Next 2000 Points will be made to the downside but it’s too early to short this.
current swing trade : None
trade of the day: Short near the 1h 20ema, again. Or buying 19000. Obvious trades in hindsight…
dax40 bearishDAX broke its 4-hour uptrend. Currently, if it breaks the 18,980 support, it can gradually retreat to the 18,550 level.

DAX LONG FROM SUPPORT|
✅DAX is going down now
But a strong support level is ahead at 18,900
Thus I am expecting a rebound
And a move up towards the target at 19,200
LONG🚀
✅Like and subscribe to never miss a new idea!✅

GER40 BUY POSITION Trendline Breakout and Retest, additional Double Top Reversal Pattern confirming change of Market direction
DAX TodayDAX Today for me is still short.
this is my view just my
Remember about risk and BE and Closed
Wed 2024 10 02 - Short -||| Stats |||
Stats Day:
** 08:00 H4 double color, - NO
** 09:30 VOLD ???, AD ???, Senti +3, Agio St ???, Lg ???, - Range
** 09:45 VOLD ???, AD ???, Senti -11, Agio St ???, Lg ???, - Range/Long/Short
** 16:15 VOLD ???, AD ???, Senti ???, Agio St ???, Lg ???, - Range/Long/Short
Stats Week:
** Fri US NFP 14:30: - pending,
** Mon Morning rule, - Fr turn, exp Tu We break flag upside,
** Tue return to W1 trend and not a W1 trend change, - pending
Stats Month:
** Oct turn,
** Mid Nov end,
Stats Year:
** US Election,
||| Trade Taken |||
Trade Taken:
** Time frame:
* H3
** Time:
* 12pm,
Set-Up:
** Trigger for trade:
* Momentum Short,
* Senti +22,
* VOLD AD
** Mom Width:
* 6 candles - strong,
** Mom Type:
* 3rd directional - risk at last Mom turn,
Risk Reward:
** Risk:
* last Mom Turn,
** Target:
* R 1:1 as momentum at against trend
DAX Buy this pullback, the rally will be resumed.DAX has completed 3 straight red days.
At the same time it has been rejected on the Rising Resistance from April.
We don't think this is the start of a larger correction, as the same rejection back in late 2023 was contained above the 1day MA50 and then resumed the rally to the 1.618 Fib.
Buy and target 20200 (Fib 1.618).
Follow us, like the idea and leave a comment below!!

Little Short-SnackHere is just another Snack for today maye or maybe not. I need to write something here, so i can post my trades but i dont know what exactly i can add to this

DAX: Anticipating a Healthy Retracement Amid Weak Eurozone DataThe DAX is showing signs of losing momentum after three consecutive bullish days, despite making new highs. Technically, it’s time for a healthy retracement towards the 19,100 zone to provide a solid base for continued bullish action. I plan to take advantage of the pullback, profiting from the downside move. If the price spikes and hits the stop loss, I will reenter the trade once the setup confirms itself again.
Technical Analysis:
• The 4H chart suggests that the market is struggling to maintain bullish momentum after the recent highs.
• A retracement towards 19,200 is expected, aligning with key support and Fibonacci levels, which would signal a healthier continuation of the uptrend.
• The price action appears to be in need of consolidation before further bullish progression.
Fundamental Analysis:
On the fundamental side, the Eurozone economy continues to struggle, as reflected in the recent PMI data. Manufacturing PMI figures across Europe are underwhelming, with most of the key economies showing contraction or slower growth:
• Spanish PMI (53.0) exceeded expectations, but other economies, such as Italy (48.3) and France (44.6), show weaker performance.
• The overall sentiment in the Eurozone remains fragile, which may further support the case for a pullback in the DAX index before any sustained bullish moves.
Given the technical and fundamental outlook, I’m positioning for a retracement in the DAX, expecting a drop to 19,100. If the trade does not play out and spikes toward my stop loss, I’ll be prepared to reenter once conditions align again. It’s essential to stay patient and trust the setup.
Note: Please remember to adjust this trade idea according to your individual trading conditions, including position size, broker-specific price variations, and any relevant external factors. Every trader’s situation is unique, so it’s crucial to tailor your approach to your own risk tolerance and market environment.

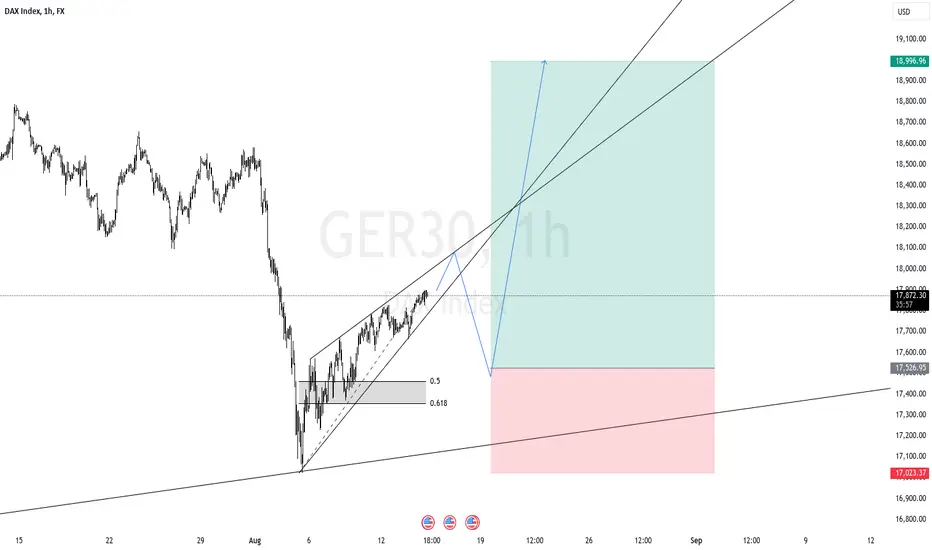
GER30 LONG BUYStructure: The chart displays a rising wedge formation, which is generally a bearish pattern, but in this context, it appears to be approaching the upper boundary of the wedge. The chart also highlights a Fibonacci retracement zone (between the 0.5 and 0.618 levels) where a potential entry point could occur. The price has been consolidating within this wedge, and there seems to be a potential breakout scenario developing.
Trade Setup: The trade idea here appears to be a potential breakout to the upside. The target price is projected within the green area, above 18,800 points, aiming for a continuation of the current bullish momentum. The stop loss is strategically placed below 17,526 points in the red area, to protect against a possible bearish reversal if the wedge fails to hold.