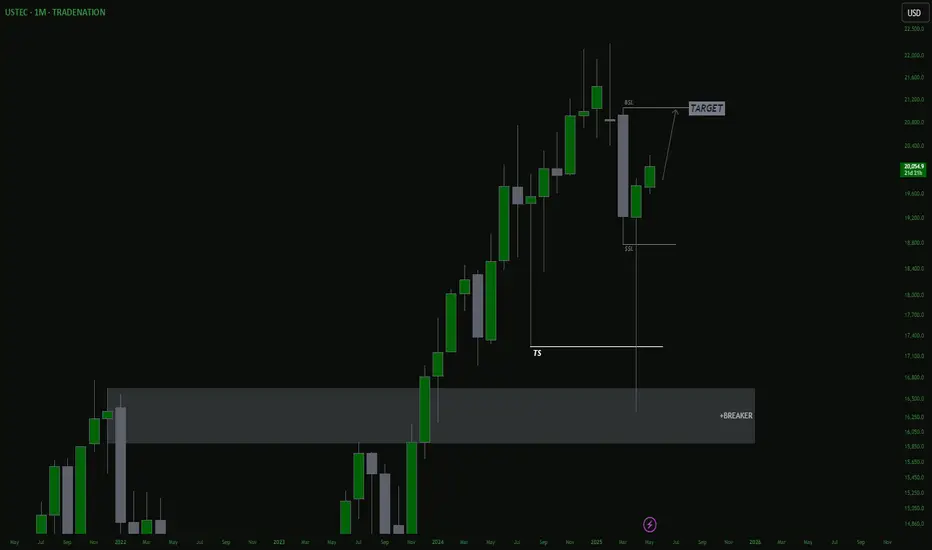
WEEKLY IDEAif price breaks 20352.8 then the last up close candle before the break will officially be a *BREAKER BLOCK*... Still looking for buy setups on lower time frames
US100 trade ideas

MONTHLY CRTHello everyone, looking at the monthly chart, i see price has tested the breaker block, that's a buy for me this month targeting ''Marchs candle high''
NAS100 BUY Trade ideia. 1-10RRNAS100 BUY Trade ideia. 1-10RR. After the TP hit from yesterday Im still expecting more bullish momentum so Im waiting to see if I can get this 1-10RR or at least 1-5RR from this. Remember we need confirmations to enter the trade. It has to brake structure in 5min before we enter.
Lets see

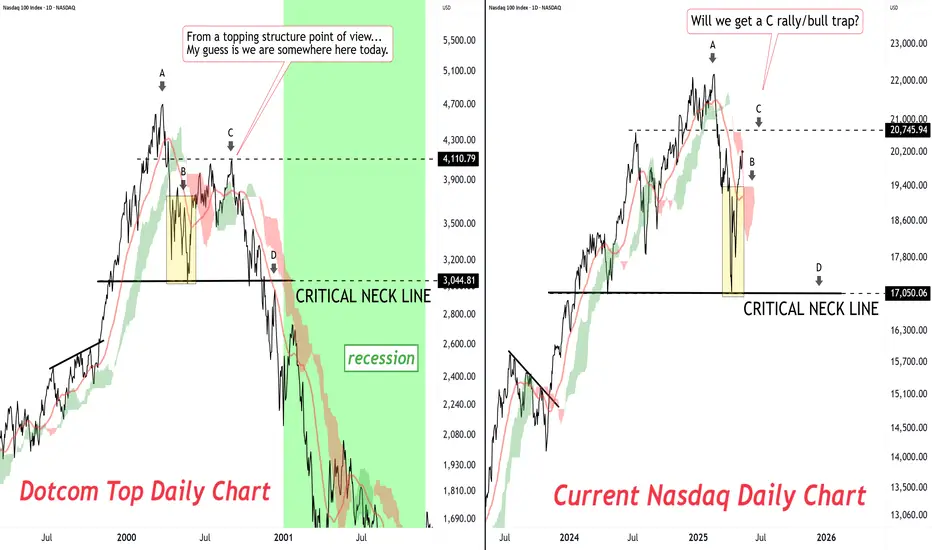
V-shape bounce in progress for the Nasdaq.V-shape bounce in progress for the Nasdaq.
If we start getting closes above the 20-21K area, this should challenge all-time highs once again.
Neckline to get bearish is still at 17K.
Never front run a possible topping pattern.
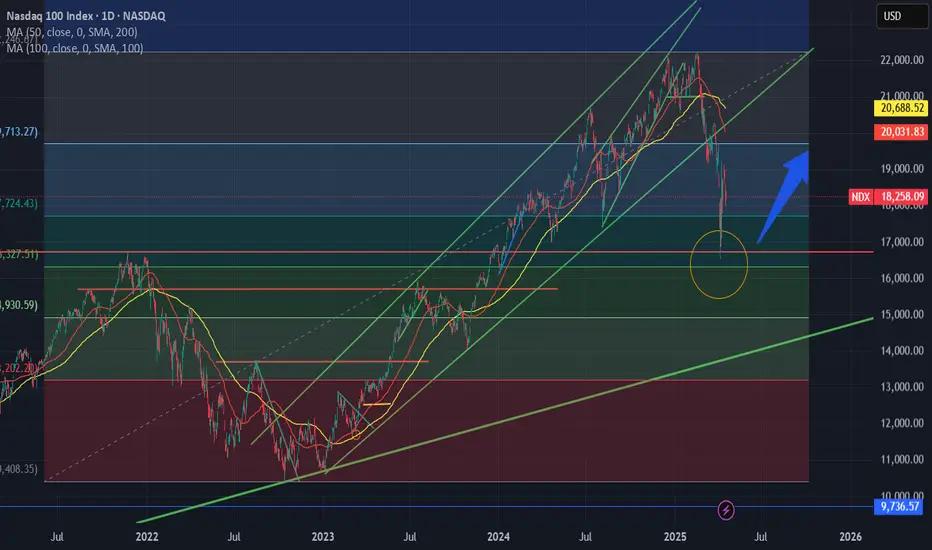
Long - assuming nothing else blows upThe recent drop seems to be due by policy that is still ambiguous and evolving, good chance trade war dies down when deals are made. other than that, NDX bounced off a previous high and has momentum to at least revert to the ma
Hanzo : NAS100 15m: Bullish Confirmed After Liquidity Trap Nas100 – Hanzo’s Strike Setup
🔥 Timeframe: 15-Minute (15M)
——————
💯 Main Focus: Bullish After Break at 19950
We are watching this zone closely.
👌 Market Signs (15M TF):
• Liquidity Grab + CHoCH at 19930
• Liquidity Grab + CHoCH at 19650
• Strong Rejections seen at:
➗ 19750 – Major support / Key level
➗ 20100 – Proven resistance
Hanzo : NAS100 15m: Breakout Zone Confirmed After Liquidity Trap

US100 - Liquidity sweep likely before bullish continuationFollowing a significant upward move last week, the US100 (Nasdaq 100 index) has entered a period of consolidation, currently exhibiting a ranging structure characterized by lower highs and relatively equal lows. This pattern typically suggests a tightening market where bullish momentum is cooling but not yet decisively reversed.
The presence of equal lows is particularly notable from a liquidity perspective. In retail trading behavior, such levels often attract a high concentration of stop-loss orders placed just below the support zone. Market participants perceive these lows as a reliable level of support, but in doing so, they inadvertently create a pocket of liquidity just beneath them.
Institutional players and market makers are well aware of these dynamics. It's common in such scenarios to witness what is known as a liquidity sweep, a short-term move below support levels to trigger stop-losses, fill large buy orders, and shake out weaker hands before the market resumes its dominant trend.
Given the current context, there's a high probability that we may see a downside sweep targeting the liquidity resting beneath the equal lows. This move would likely be swift and sharp, clearing out stop orders before a potential bullish reversal unfolds. If confirmed, such a move could mark the end of the current range and initiate a new impulsive leg higher in the broader uptrend.
Traders should watch for signs of price rejection or bullish divergence following the sweep as potential confirmation of this scenario. Until then, it’s prudent to remain patient and avoid getting trapped in the chop, especially near well-watched support zones.
-------------------------------
Thanks for your support.
- Make sure to follow me so you don't miss out on the next analysis!
- Drop a like and leave a comment!

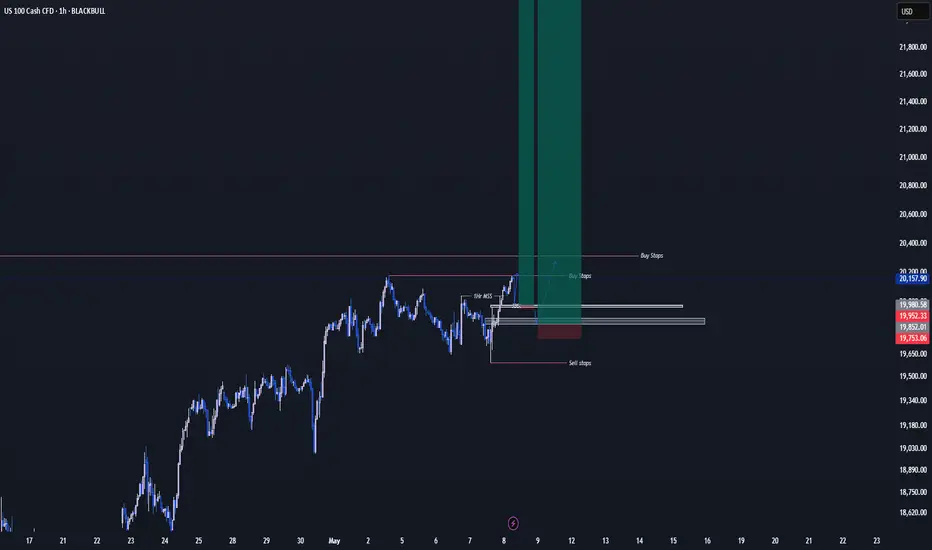
X2: NQ/US100/NAS100 Short - Day Trades 1:2X2:
Risking 1% to make 2%
NAS100, US100, NQ, NASDAQ Short for day trade, with my back testing of this strategy, it hits multiple possible take profits, manage your position accordingly.
Risking 1% to make 2%
Use proper risk management
Looks like good trade.
Lets monitor.
Use proper risk management.
Disclaimer: only idea, not advice

Nas faq intra day buys setupRe accumulation setup for nasdaq intra day buys , market structure on daily looking bullish
NASDQhe image shows a daily chart (1D) of the Nasdaq 100 (US100) on TradingView, with a detailed technical analysis suggesting a possible continuation of the long (bullish) trend, supported by various price levels, trendlines, and visual cues. Here's a description based on the chart:
🟦 Current Context
The price has recently broken above a key resistance area around 20,016 – 20,038, which may now act as support.
The current candle is bullish (green) and closes above this range, showing buyer strength.
There is a clear upward trend starting mid-April, with higher lows and consecutive bullish candles.
📈 Key Technical Elements
A target is marked at 21,009.5, highlighted by an orange horizontal line.
A light blue rectangle represents a potential projected move range, starting around the 20,000 zone and aiming toward 21,000.
A red box below the current price likely indicates the invalidation area or stop-loss zone.
Intermediate support levels include:
19,756.0 (blue line)
19,226.9 (orange line)
18,304.8 (deeper support)
🔁 Potential Long Continuation Scenario
If price holds above the 20,000 – 20,038 zone, we may see an acceleration toward the 21,009 target.
The overall pattern suggests a breakout from a consolidation phase, followed by a retest of the broken level (now support), and a potential upward continuation.
The diagonal trendlines indicate the formation of a broad ascending channel.
📅 Timing
The projected target may be reached within the coming weeks: a vertical black line is marked on May 21, 2025, possibly indicating the expected timeframe for the move.
✅ Conclusion
There is a clear bullish market structure, with a resistance breakout and well-defended supports. Unless there’s a false breakout or negative macro news, the long projection toward 21,009 appears technically valid.

a strategy i made with chatgpt in the works before market openThe strategy involve the use of to EMAs. The 10 and 20 EMAs. and i have an alert on Tradingview that tells me when the golden cross occurs and on the next candle after the golden cross thats where i am supposed to enter the trade but since i am working at this time i missed my entry but still got a good entry on the next reset and took a 2.5:1 trade and it panned out.

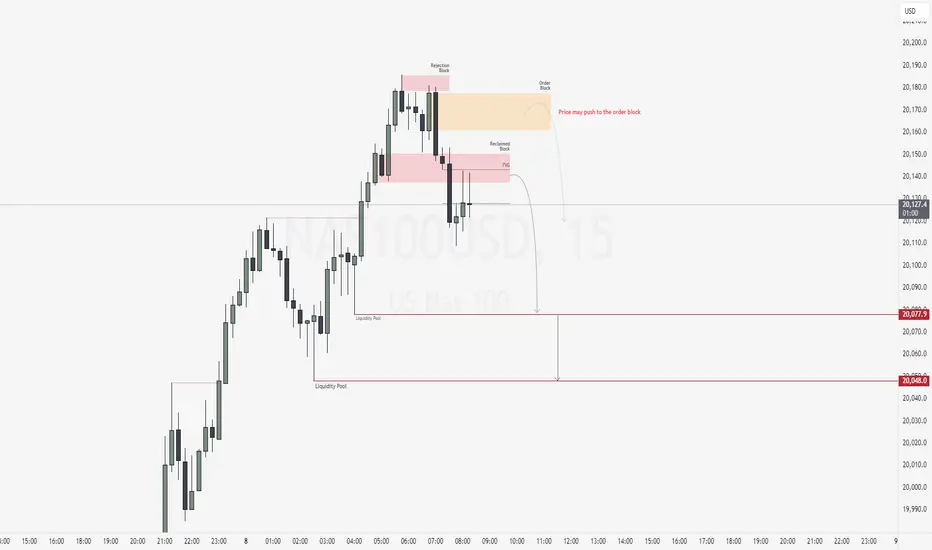
NAS100USD: Bearish Confluence Builds as Market WeakensGreetings Traders,
Despite the broader bullish context on NAS100USD, current confluences suggest a potential short-term move to the downside. As we enter the New York session—with a key news release on the horizon—we anticipate heightened volatility. The critical question now becomes: where is price most likely to draw?
Key Observations:
1. Shift in Market Structure:
Price failed to break above the previous high and instead formed a lower high, signaling weakness and suggesting a possible reversal. This lower high, marked by multiple rejection wicks, forms what we identify as a rejection block—a zone often used by institutions to initiate sell orders.
2. Displacement and Bearish Arrays:
Following this rejection, the market displayed strong displacement to the downside, confirming a market structure shift. This supports the likelihood of bearish continuation and increases the validity of bearish institutional arrays holding as resistance.
3. Current Zone of Interest:
Price is now trading within a fair value gap (FVG) aligned with a reclaimed order block—a strong confluence area for potential bearish continuation. Just above this zone lies a bearish order block and another FVG, which may act as a secondary resistance should price wick higher before moving down.
Trading Plan:
Wait for confirmation at the current resistance zones before considering entries. If validated, look to target the liquidity pools resting at lower, discount price levels.
Stay patient, trade with precision, and let the market confirm your idea.
Kind Regards,
The Architect
Nas100 Bullish- I'm looking for an retracement to buy otherwise I'll wait until i see something nice.
-It would be nice to see a sell off when the new york open starts
When Stocks & Bond Move Opposite Direction - Its implicationWhen Stocks & Bond Move Opposite Direction what does it mean?
We have observed a divergence between the stock and bond markets since 2020. While U.S. Treasury bonds entered a bear zone, the stock markets continued their upward climb. What are the implications of this decoupling?
Will the stock market resume its uptrend and hit new highs? Or is this merely a retracement before further downward pressure?
Micro E-mini Nasdaq Futures and Options
Ticker: MNQ
Minimum fluctuation:
0.25 index points = $0.50
Disclaimer:
• What presented here is not a recommendation, please consult your licensed broker.
• Our mission is to create lateral thinking skills for every investor and trader, knowing when to take a calculated risk with market uncertainty and a bolder risk when opportunity arises.
CME Real-time Market Data help identify trading set-ups in real-time and express my market views. If you have futures in your trading portfolio, you can check out on CME Group data plans available that suit your trading needs tradingview.sweetlogin.com
Trading the Micro: www.cmegroup.com

Technical Breakdown on US 100 1H TimeframeTechnical Breakdown on US100 1H Chart using Volume Profile, Gann, and CVD + ADX
1. Key Observations (Volume, Gann & CVD + ADX Focused)
a) Volume Profile Insights:
Value Area High (VAH): 20,080
Value Area Low (VAL): 19,720
Point of Control (POC):
Recent Session: 19,828.32
Previous Session: 19,760.96
High-volume nodes: Between 19,750 – 19,830 (acceptance zone with strong historical interest).
Low-volume gaps: 19,840 – 19,950 and above 20,100 (potential fast-move areas).
b) Liquidity Zones:
Stop Clusters Likely at:
Above 20,100 (psychological level and channel top).
Below 19,720 (value rejection zone).
Order Absorption Zones:
19,828 – 19,850 shows thick absorption based on CVD response and price stall.
c) Volume-Based Swing Highs/Lows:
Swing High: 20,080 (volume spike with slight wick rejection).
Swing Low: 19,700 (demand step-in area).
d) CVD + ADX Indicator Analysis:
Trend Direction: Uptrend (strong green candle series with rising CVD).
ADX Strength:
ADX > 20 with DI+ > DI- → Confirmed uptrend.
CVD Confirmation:
Rising CVD + bullish price action → Strong demand from market buyers, aligning with breakout above POC.
2. Support & Resistance Levels
a) Volume-Based Levels:
Support:
VAL: 19,720
POC (Current): 19,828.32
POC (Previous): 19,760.96
Resistance:
VAH: 20,080
Round number & psychological level: 20,100
b) Gann-Based Levels:
Gann Swing Low: 19,700
Gann Swing High: 20,080
Key Retracement Levels (Range: 19,700 – 20,080):
1/2: 19,890
1/3: 19,827
2/3: 19,953
3. Chart Patterns & Market Structure
a) Trend: Bullish (confirmed by rising ADX + CVD).
b) Notable Patterns:
Breakout from consolidation range above POC (strong volume confirmation).
Ascending channel structure supporting higher lows.
No divergence in CVD → healthy trend continuation signal.
4. Trade Setup & Risk Management
a) Bullish Entry (If CVD + ADX confirm uptrend):
Entry Zone: 19,828 – 19,850 (retest of POC/consolidation base)
Targets:
T1: 20,080 (VAH/Swing High)
T2: 20,200 (Channel Top)
Stop-Loss (SL): 19,700 (below swing low)
RR: ~1:2.3 minimum
b) Bearish Entry (If CVD + ADX flip bearish later):
Entry Zone: 20,080 – 20,100 (failure to break channel top)
Target:
T1: 19,828 (POC retest)
Stop-Loss (SL): 20,150 (above channel breakout zone)
RR: ~1:2
c) Position Sizing: Risk only 1-2% of capital per trade. Avoid oversized trades in extended trends.
Understanding the Crab's Potential Ascent Before the DescentCurrent market analysis suggests a potential temporary surge in the Nasdaq index, colloquially referred to as a "crab walk," possibly reaching a level of 20.4 before a significant correction.
While this upward movement may present short-term opportunities, it is crucial to recognize its potential transience.
