Dow Jones Technical Outlook – July 2025The Dow Jones is currently trading in a tight consolidation range just below its major resistance zone near 45,200.
After a strong bullish rally, the index is showing signs of exhaustion with lower volatility and sideways price action — forming a potential rectangle pattern. This type of structure typically signals a continuation or reversal, depending on the breakout direction.
📌 Key Levels to Watch:
Resistance: 45,200 – A breakout above this level may trigger a strong upside rally toward
Support: 44,050 – A breakdown below this can open the door for a retest of 43,200 or even 42,000.
Price is coiling — the market is waiting. The next breakout could set the tone for weeks to come.
US30 trade ideas
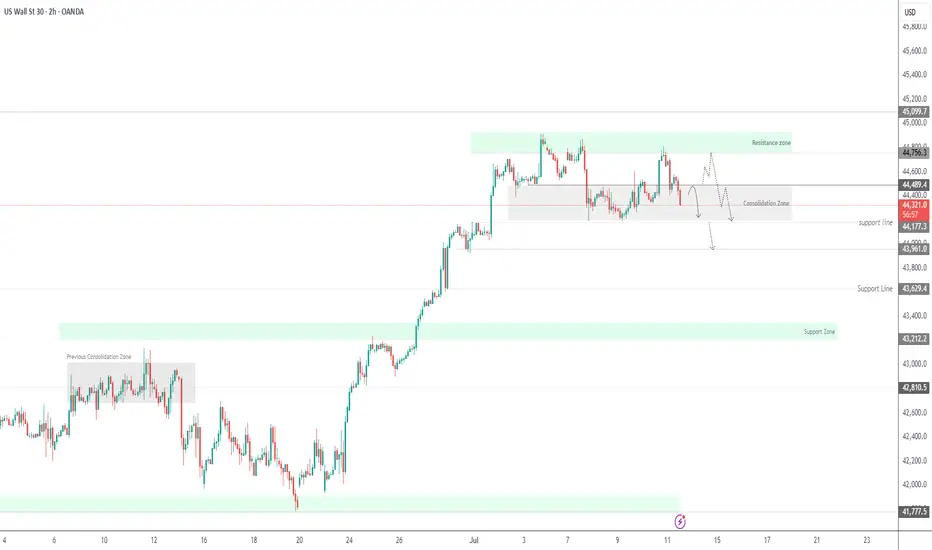
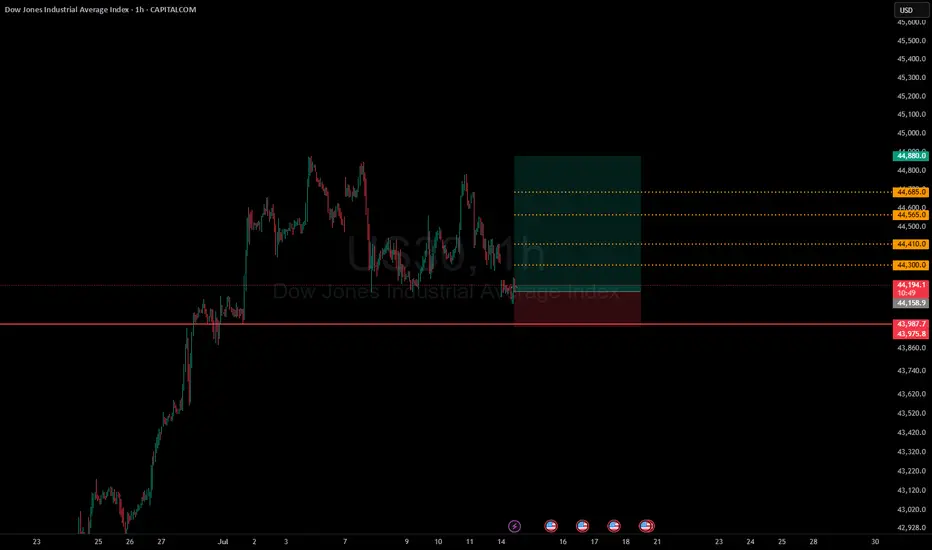
US30 Bearish Below 44490 – Watching 44180 US30 Analysis
US30 remains bearish below 44490, with downside targets at 44180 and 43960.
A 1H close below 44180 would confirm continuation toward 43630.
To turn bullish, price must break above 44490.
Pivot: 44430
Resistance: 44460, 44550, 44760
Support: 44180, 43960, 43630
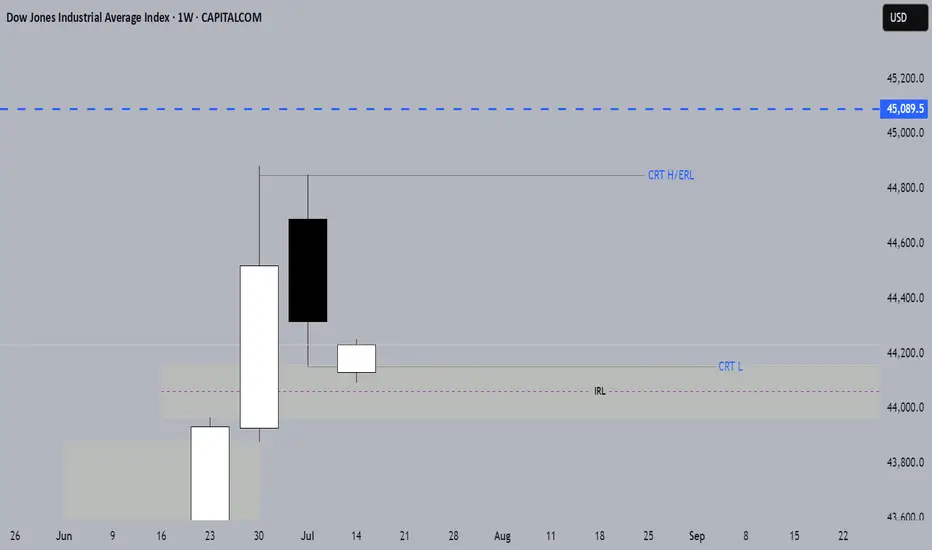
US30 BULLISH/ CRT, ERL&IRL CONFIRMATIONUS30 TO 45089.5
July is historically one of the Dow’s best-performing months.
WEEKLY CRT
IRL TO ERL
BUYTrend Line Break
Previous Day Volume
Rejection Point
Untapped Order Point
London Session
High Structure Swing
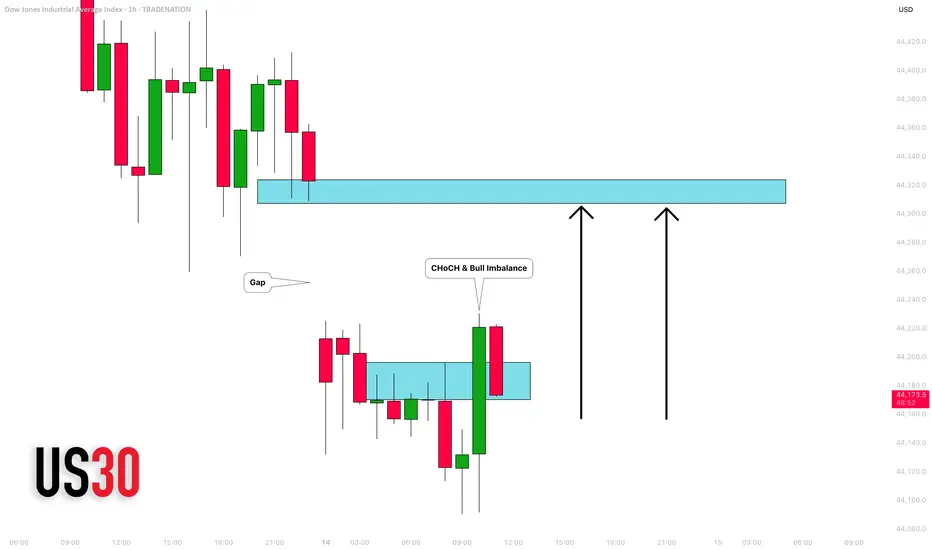
DOW JONES INDEX (US30): Classic Gap Trade
I see a gap down opening on US30 index.
As always, there is a high chance that this gap is going to be filled.
A bullish imbalance candle and a local change of character CHoCH
indicate a highly probable rise to a gap opening level.
Target - 44300
❤️Please, support my work with like, thank you!❤️
I am part of Trade Nation's Influencer program and receive a monthly fee for using their TradingView charts in my analysis.
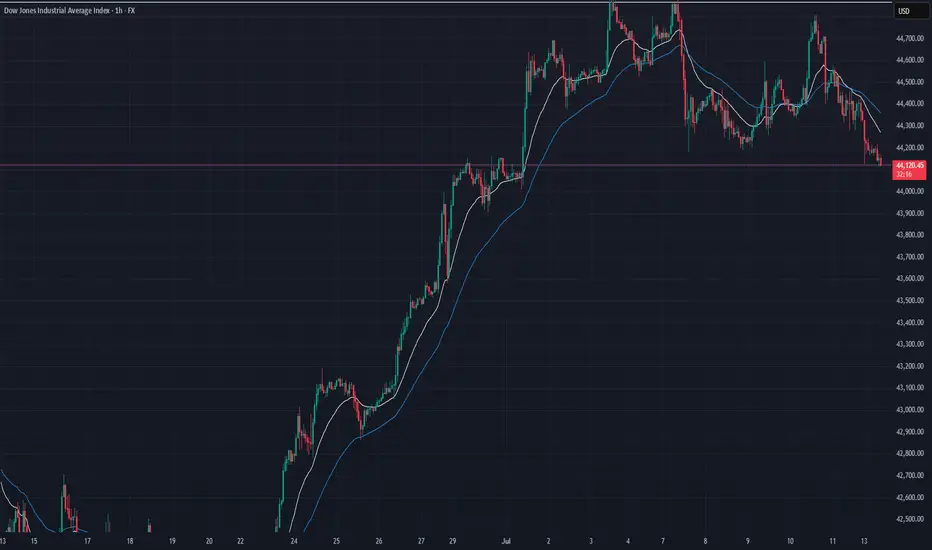
US30 Market Recap – 07/14/2025📍 US30 Market Recap – 07/14/2025
We’ve officially broken down out of the consolidation range between 44,220–44,867 📉
The structure is now shifting bearish, with price printing a series of lower highs and lower lows, and EMAs flipping to the downside. Sellers are in control heading into the week.
📊 Current Structure:
Bearish market shift confirmed below 44,220
EMAs (20 & 50) now angled downward and acting as dynamic resistance
Trendline support from June rally is broken
Last bounce attempt from 44,260 was weak and quickly faded
🔑 Key Levels:
🔽 Support: 43,800 → 43,600 → 43,300
🔼 Resistance: 44,220 → 44,400 zone
🧭 Pivot zone: Watch 44,000 psychological level for reactions
💡 Trade Setup Ideas:
🔻 Short Setup (Trend Continuation):
Entry: Retest + rejection near 44,220 or descending EMAs
TP1: 43,800
TP2: 43,600
SL: Above 44,300
⚠️ Avoid longing unless we reclaim and hold above 44,400 with strong momentum.
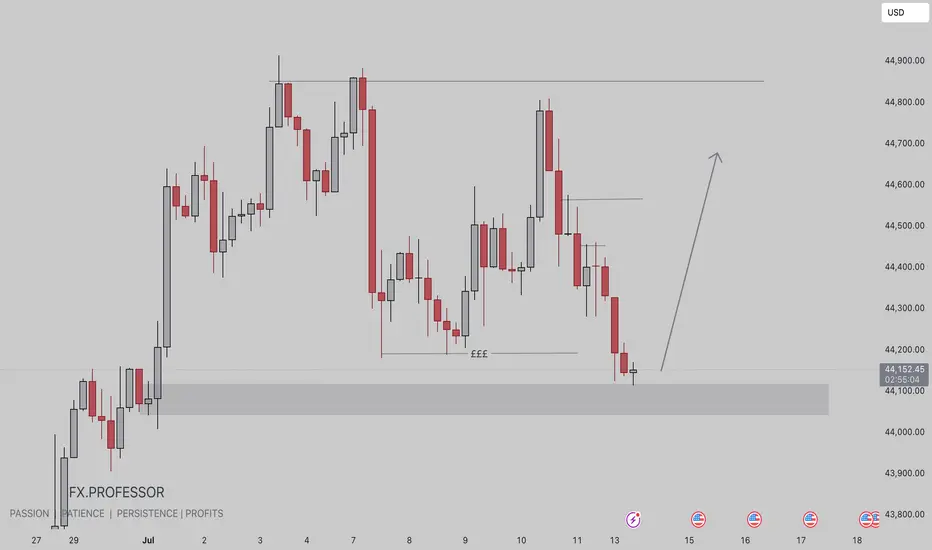
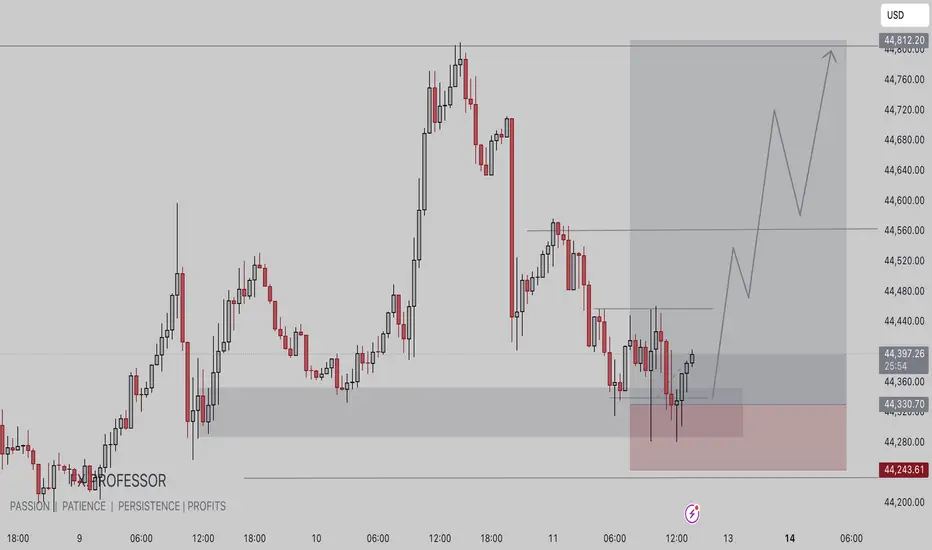
US30 BUY IDEA • Extreme Demand Zone Entry:
Price has cleanly tapped into a refined demand zone between ~44,050 to 43,994, a prime area for institutional entries. This aligns with a previous accumulation zone from late June.
• Triple Equal Lows (₤₤₤) Swept:
Clear liquidity grab beneath the equal lows, suggesting SMC-style inducement to fuel bullish orders.
• High R:R Setup in Play:
The long setup offers an expansive upside toward the 44,851 level — representing a premium retracement zone, inefficiency fill, and possible internal BOS confirmation.
14.07.25 Morning ForecastPairs on Watch -
FX:NZDCAD
FX:USDJPY
FX:EURUSD
OANDA:US30USD
A short overview of the instruments I am looking at for today, multi-timeframe analysis down to what I will be looking at for an entry. Enjoy!

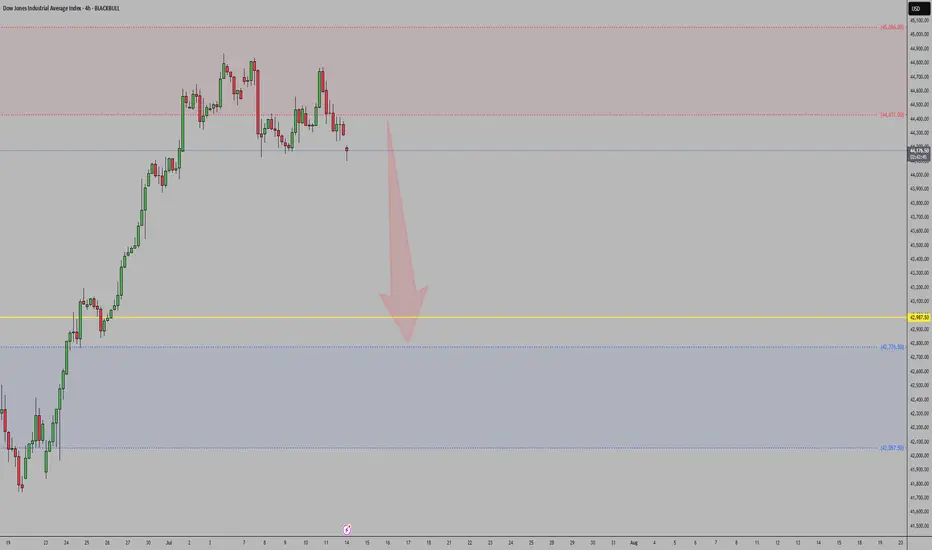
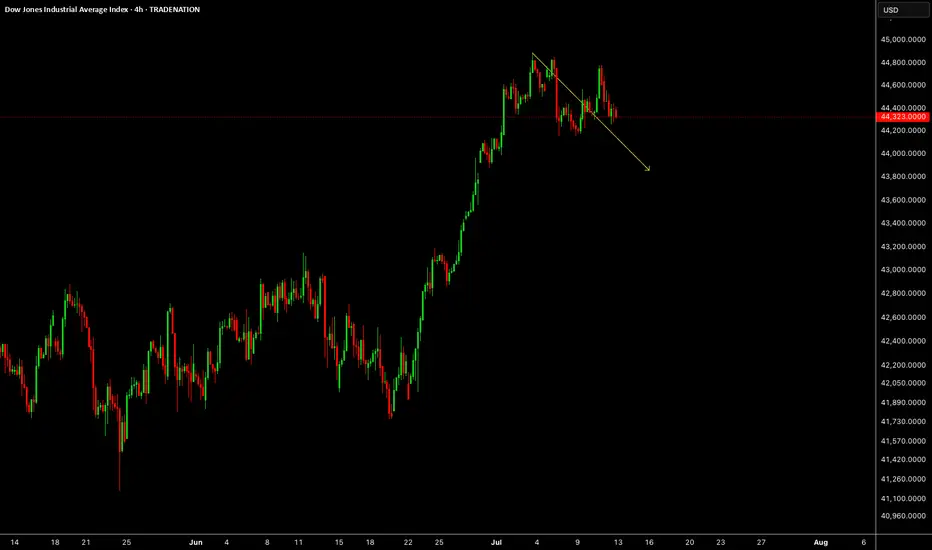
US30Net long positions are decreasing, signaling that institutional speculators are reducing exposure.
Commercials are increasing short positions, suggesting smart money expects downside in US equities.
Price rejected strongly from a weekly supply zone, failing to break previous highs.
A bearish break of structure (BOS) has occurred, with price forming a lower high and lower low pattern.
This aligns with broader macro conditions (stronger USD, rising yields).
Bias remains bearish — looking to sell pullbacks into premium zones or supply areas.
Crystal ball market Crystal ball market ..market insights are invaluable! Their team provides actionable advice and their customer service is top-notch. A trusted broker in this industry!
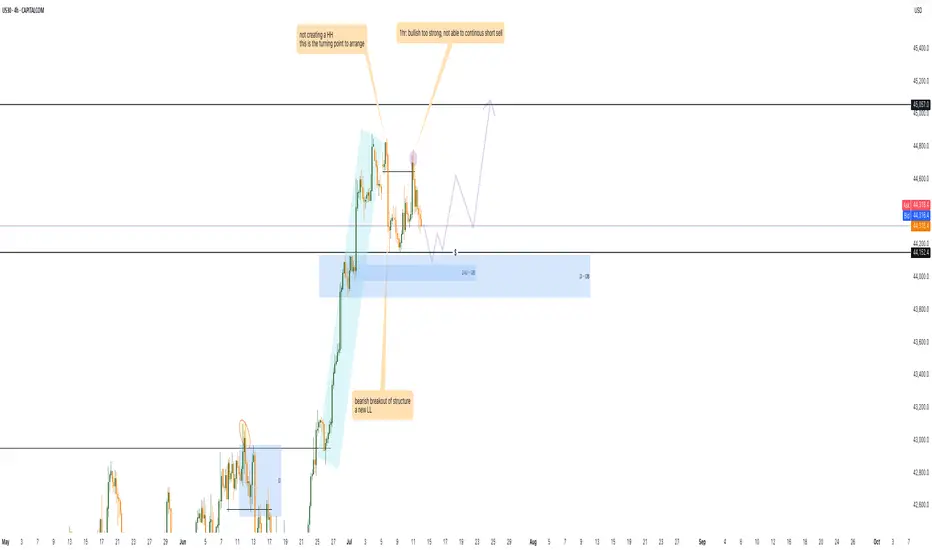
correctionIt is expected to fluctuate within the current support level and then continue the upward trend.
If the index breaks through the green support level, the correction to the next support level is possible.
US30US30 needs some more correction before we go bullish again.
Disclosure: We are part of Trade Nation's Influencer program and receive a monthly fee for using their TradingView charts in our analysis.
US30 prepare for the bullish 1. there is double bottom at 44152 level, i will tend to wait for the sweep meaning the price go down and hit the 4hr order block.
2. wait for 15m/ 30m TF a strong bullish momentum.
3. retest the 44152 around level or 0.618 to enter the market to long
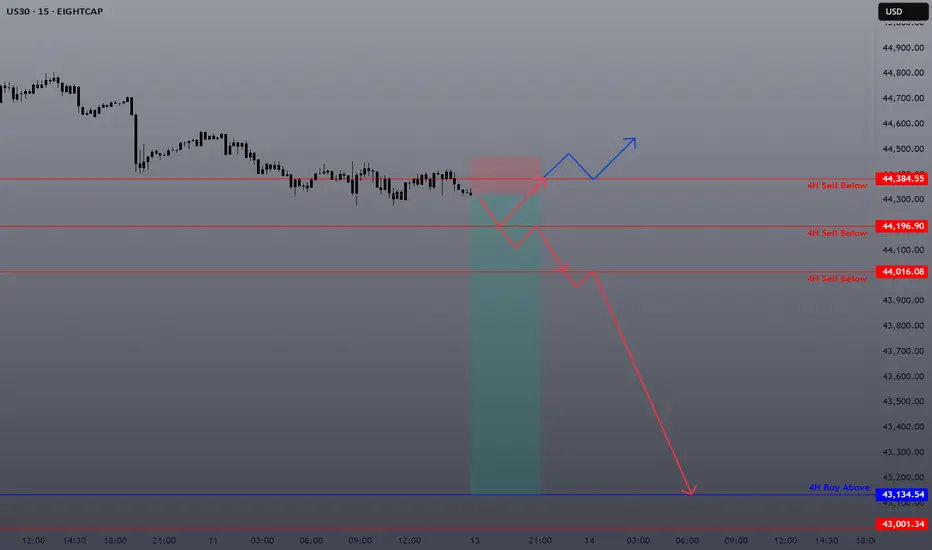
US30 Sell continuationUS 30 appears to be running SSL. 4H levels identified. Looking for Break & retest. If support does not hold on to any level, expect the bulls to return and take over.
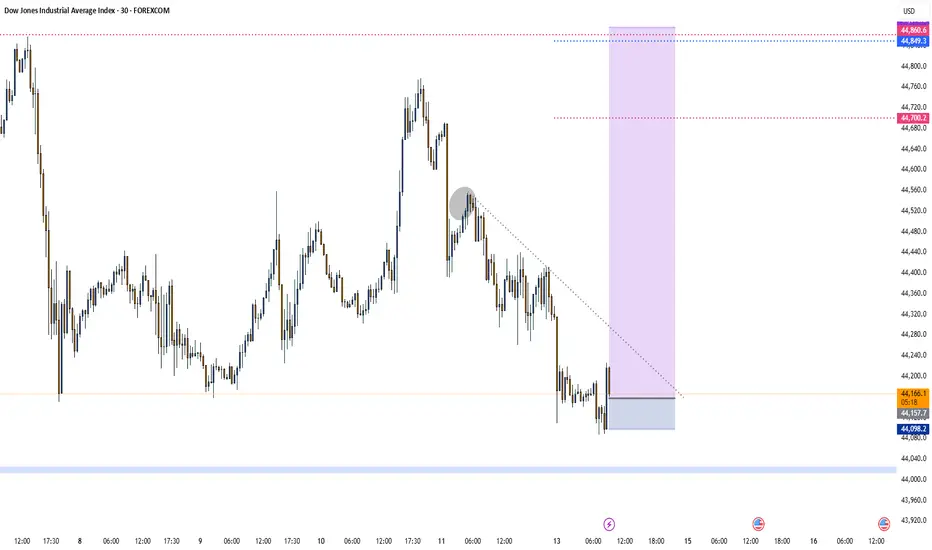
Dow Jones Potential DownsidesHey Traders, in the coming week we are monitoring US30 for a selling opportunity around 44,270 zone, US30 is trading in an uptrend and currently seems to be attempting to break it down, if we get dips below the trend we will be looking for a potential retrace towards further downsides.
Trade safe, Joe.

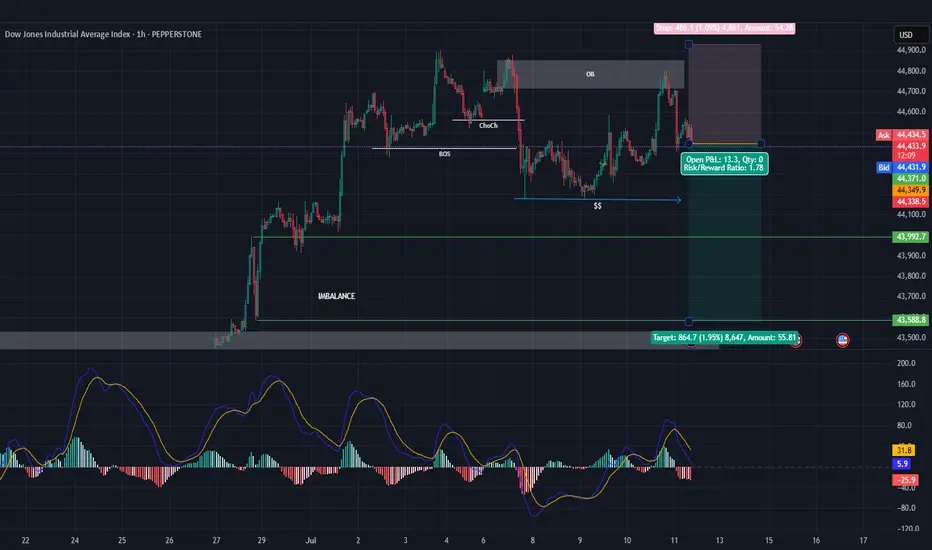
US30SIGNAL: BUY
A) SETUP: B (h1 wave5 to Correction)
B) CONFIRMATION:
1) SBT: done
2) RSI DIVERGENCE: done
3) MOMENTUM CANDLE: done
C) RR = 1:3

US30 TradeA dip into my point of interest to clear liquidity resting there will trigger our long trade scenario
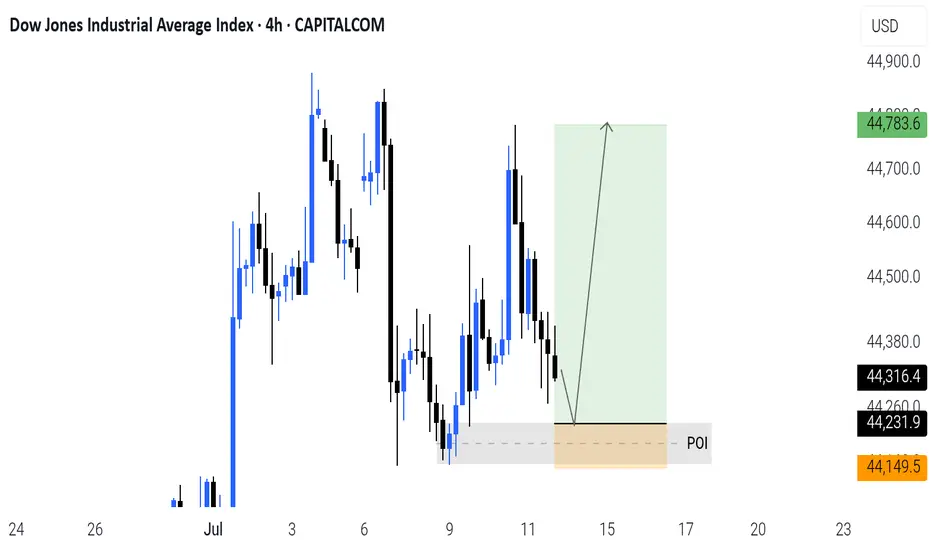
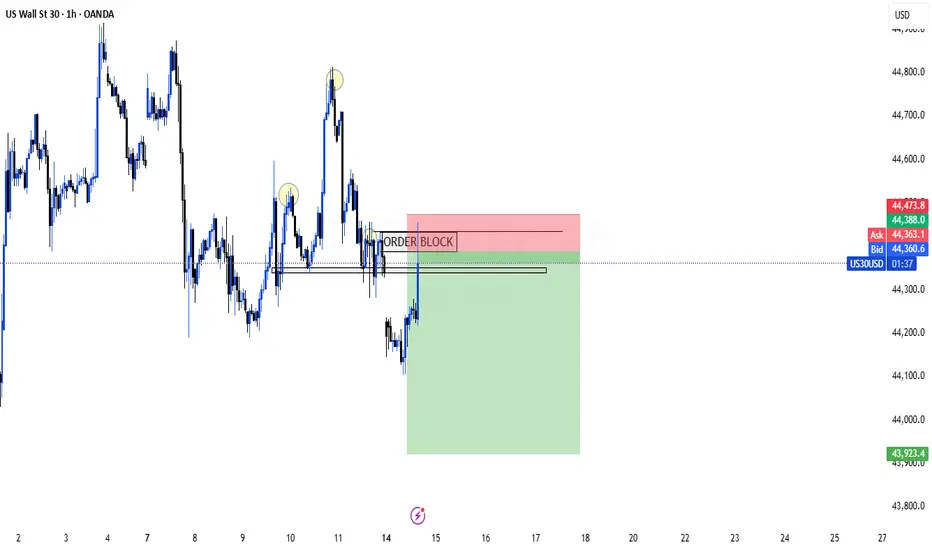
US30 BUY IDEA🔍 Key Technical Highlights:
• Demand Zone Entry:
• Price tapped into a strong demand zone (gray box) around 44,280 – 44,330, signaling potential institutional buying interest.
• Liquidity Grab:
• Sell-side liquidity has been swept just below the previous lows, which aligns with a classic SMC liquidity manipulation before a bullish move.
• Projected Market Structure Shift:
• Price is forming a higher low, hinting at a potential reversal and bullish BOS (Break of Structure).
• Expecting a multi-leg bullish move, targeting 44,812 area, filling imbalance and reaching premium zones.
• Risk-Reward Outlook:
• Stop loss placed just below the demand zone.
• Take profit aligned with previous highs and inefficiency zone — a favorable R:R ratio for swing traders.
⸻
🧠 Smart Money Narrative:
1. Sweep of liquidity below demand.
2. Institutional buy orders triggered.
3. Low-risk buy opportunity with clear internal structure shift.
4. Bullish continuation toward premium pricing and unfilled imbalances.
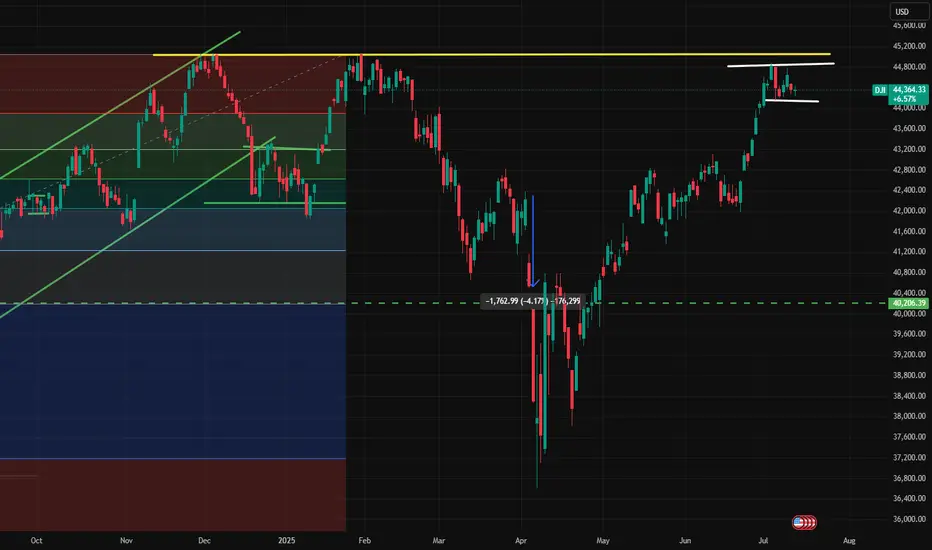
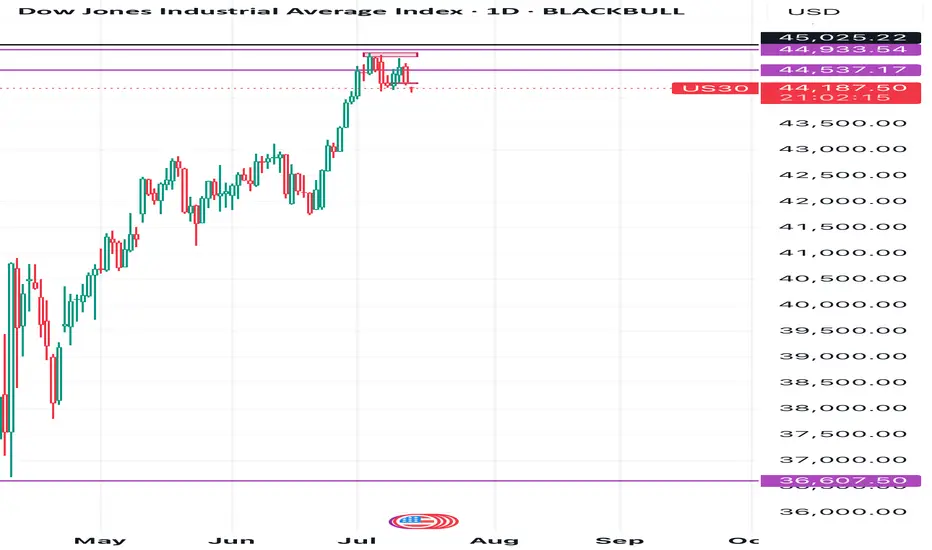
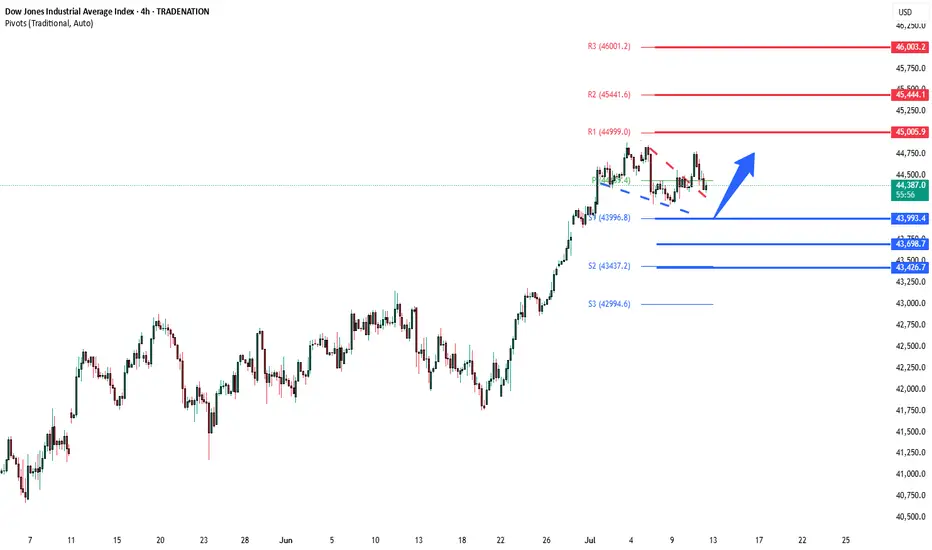
DowJones bullish breakout retest?Key Support and Resistance Levels
Resistance Level 1: 45000
Resistance Level 2: 45445
Resistance Level 3: 46000
Support Level 1: 44000
Support Level 2: 43700
Support Level 3: 43430
This communication is for informational purposes only and should not be viewed as any form of recommendation as to a particular course of action or as investment advice. It is not intended as an offer or solicitation for the purchase or sale of any financial instrument or as an official confirmation of any transaction. Opinions, estimates and assumptions expressed herein are made as of the date of this communication and are subject to change without notice. This communication has been prepared based upon information, including market prices, data and other information, believed to be reliable; however, Trade Nation does not warrant its completeness or accuracy. All market prices and market data contained in or attached to this communication are indicative and subject to change without notice.
US30 Market Recap – 07/11/2025📍 US30 Market Recap – 07/11/2025
Another range-bound day on US30 as price continues to chop between key zones. Bulls pushed into 44,700, but failed to hold gains. We’re now sitting near the mid-range, and market indecision is growing 🤔
📊 Current Structure:
Range: 44,220 (support) ↔️ 44,867 (resistance)
Mid-range: 44,500 zone acting as key pivot
EMA structure still mixed: 20 EMA trying to cross back above 50 EMA
Lower highs building since last test of 44,867 = signs of seller presence
🔑 Key Levels:
🔼 Resistance: 44,701 → 44,867
🔽 Support: 44,260 → 44,220
⚠️ Mid-zone chop: 44,400–44,500 (avoid fomo entries here)
💡 Trade Setup Ideas:
🔻 Short Setup (If rejection holds below 44,500):
Entry: Rejection candle or break/retest under 44,400
TP1: 44,260
TP2: 44,100
SL: Above 44,600
🔼 Long Setup (Only above 44,700 reclaim):
Entry: Strong close + retest above 44,700
TP: 44,867 highs
SL: Below 44,500
🚫 NO-TRADE ZONE: 44,350–44,500 chop range = indecision zone ⚠️

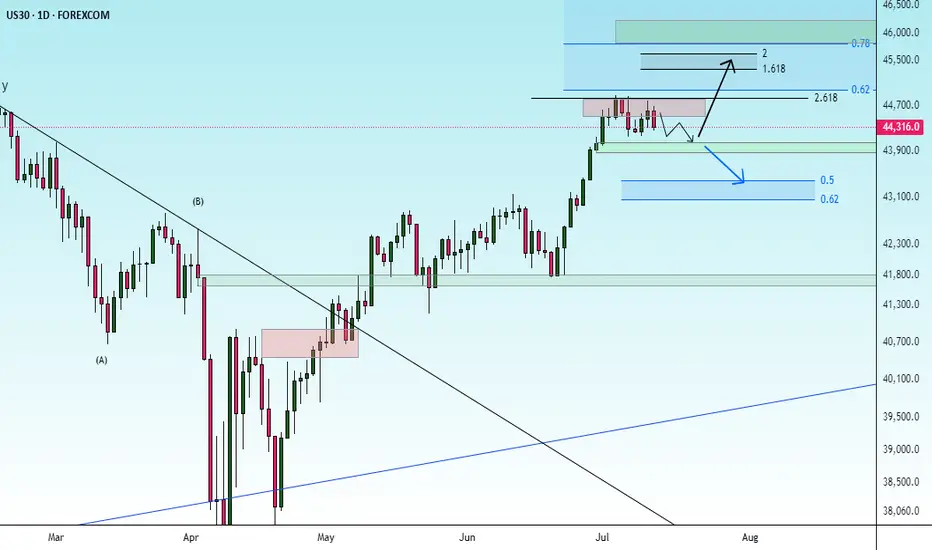
US30 - Short SellThe Dow Jones aka US30
* Overall trend is bullish
* Currently trading the retracement with the following points.
1. Valid OB
2. Liquidity to the sell side
3. Imbalance to the sell side
4. Price failed to break the previous HH activating the Bear positions, the question is How Deep The Retracement Will Be ? So we are closely monitoring the price action to adjust at any changes that the market might face.