DXY 4Hr And Daily Bearish ( A minor & aslight bull trend)The DXY (US Dollar Index) could potentially rise to the 100.257 level to complete a bullish structure or flag pattern. However, it's also possible that it may face rejection around its current zone and resume its bearish trend, targeting support levels between 99.00 and 98.25.
As always, our entries should be guided by what the market and its structure are showing us. For now, the broader trend for the DXY remains bearish until it potentially reaches the lower support zone around 96.00 – 94.00, or even below that range.
This extended downside expectation is driven by several fundamental factors: anticipations of interest rate cuts in the coming months, potential tax policy changes under Trump, and persistent inflation concerns within the U.S. economy.
In light of these uncertainties, the market demands extra caution at this stage.
Good luck and trade safe!
USDX trade ideas
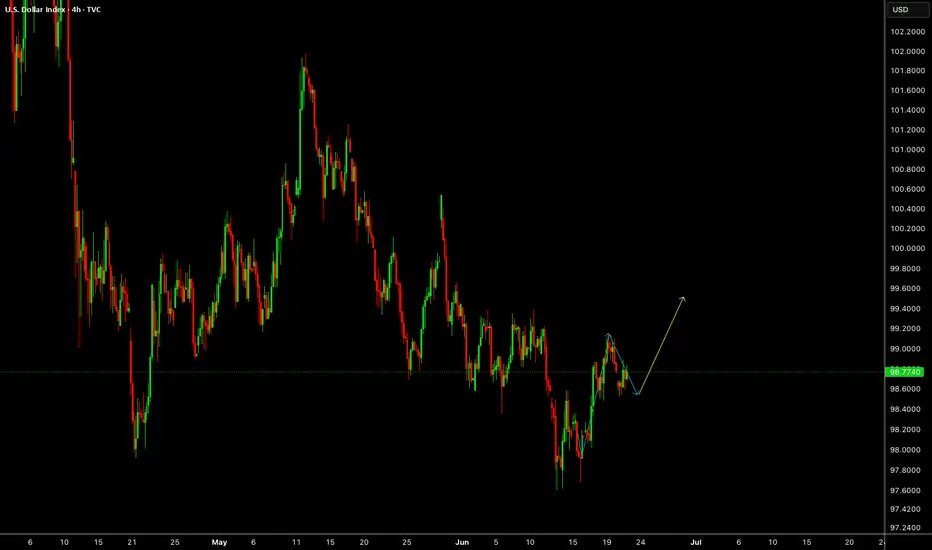
DXY IS BULLISHA possible upward move might take place . Looking forward to go long until resistance area . I will wait and see how it goes .
Happy Trading
DXYDXY needs some correction and further upside as upside isn't done yet.
Disclosure: We are part of Trade Nation's Influencer program and receive a monthly fee for using their TradingView charts in our analysis.
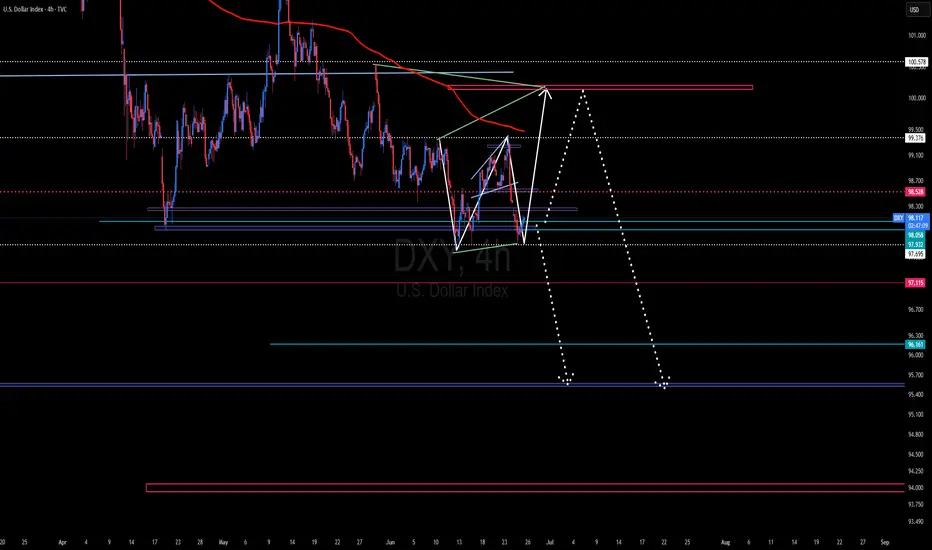
Outlook for Trump's Second TermExpecting price to retest the bottom descending channel and return to the moving averages next year. From there, price will likely rebound hard and surge back upwards to continue the muti-decade ascent.

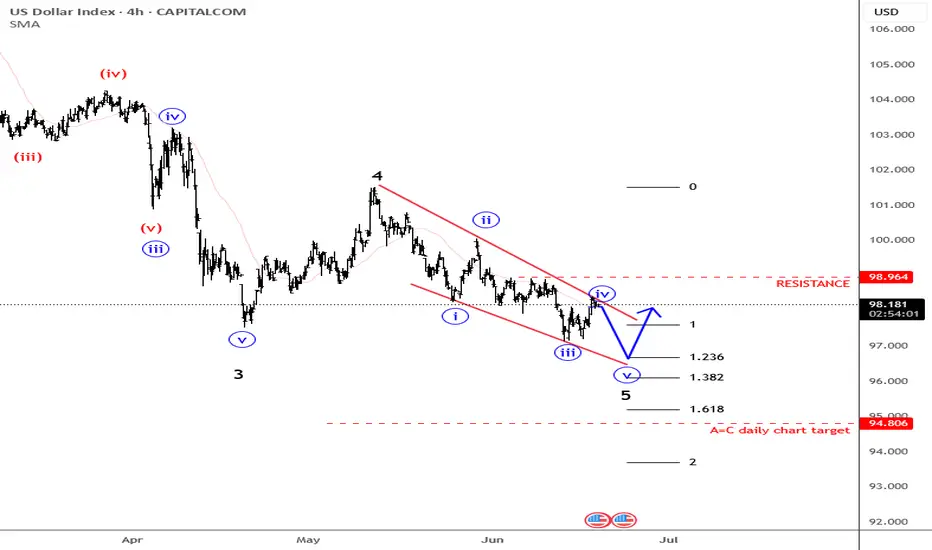
Dollar In Fifth Wave-Reversal In Trend May Not Be Far Away.The Fed will announce its latest policy decision later, and expectations are that Powell will keep rates on hold, especially after last week's slightly higher inflation print and still solid US jobs data. We can see some stabilization in the US dollar ahead of this event, but we have to keep an eye on geopolitical tensions in the Middle East, which coudl also play a key role in driving safe haven flows.
Meanwhile, the stock market continues to trade sideways, and I don't expect any major breakouts or strong moves ahead of the Fed. Also, tomorrow is a holiday in the US, so that could contribute to slower market conditions into the end of the week, unless, of course, the situation in the Middle East gets worse.
Looking at the DXY waves structure, I see athree-wave move from the most recent lows, so the fourth wave I highlighted a few days ago could now be approaching completion near this week’s key resistance around the 99 level. That’s definitely a level to watch for a potential fresh, but possibly final sell-off toward new lows around 97, maybe even 96.
That’s where the DXY could stabilize, as ending diagonal pattern signals that we are likely in the late stages of wave five, meaning this bearish cycle could soon come to an end.
Dollar Index Analysis: Compression, Divergence, Breakout?Greetings to the TradingView community, here's a detailed look at DXY where technical structure and macro context may be hinting at a shift.
Dollar Index (DXY) Approaching Key Breakout | Bullish Divergence and Macro Shifts in Focus
The U.S. Dollar Index (DXY) is currently approaching a structurally important juncture where technical compression is intersecting with potential macroeconomic shifts. Over the past several months, DXY has remained in a well defined downtrend, consistently printing lower highs and lower lows. However, the recent price action reveals signs of exhaustion in bearish momentum, opening the door for a potential trend reversal or a meaningful corrective rally.
Technically the index has been trading within a broad descending wedge pattern since late 2024. This structure, often interpreted as a bullish reversal formation, is now nearing its apex. Price has been hugging the upper boundary of the pattern a descending trendline that has acted as dynamic resistance and appears to be preparing for a possible breakout. Each subsequent test of this trendline has occurred with less momentum on the downside, a common precursor to a breakout when price compresses tightly within narrowing ranges.
More importantly, momentum indicators are beginning to diverge from price. The Relative Strength Index (RSI 14), for instance, is forming a series of higher lows while price continues to record lower lows. This bullish divergence is a classic signal that downside pressure is weakening and that buyers may be gradually absorbing supply. Divergence of this nature, especially in confluence with trendline resistance, often leads to a shift in price behavior.
A key horizontal level to monitor remains 101.75, which has historically acted as a strong resistance zone. This level marked the previous breakout rejection and coincides with the mid-range structure of the wedge. A sustained close above this zone would effectively break the prevailing lower-high formation and could signal a shift in market structure toward a more neutral or even bullish bias.
In terms of projected targets, if a breakout confirms, the logical areas to watch would be the previous swing highs from the downtrend. These include levels in the 102.50 to 104.00 range, where the market has previously paused or reversed. These prior lower highs may now act as resistance on the way up and can be used as checkpoints to gauge the strength of any bullish follow-through.
From a macroeconomic perspective, several factors could support or accelerate such a breakout. Recent U.S. inflation data has shown signs of softening, with both Consumer Price Index (CPI) and Producer Price Index (PPI) prints coming in below expectations. This has increased market speculation that the Federal Reserve may pivot toward a more accommodative stance later in the year. Although the Fed has not confirmed any immediate easing, market expectations around rate cuts are beginning to influence bond yields and, by extension, the dollar.
However, it’s also worth noting that monetary policy divergence among global central banks remains an important theme. While the Fed may lean toward caution, the European Central Bank and the Bank of England are facing their own unique inflationary challenges, which could either reinforce or limit relative dollar weakness. In such an environment, if other central banks appear more dovish than the Fed, it could provide relative strength to the dollar index.
Geopolitical uncertainty and equity market volatility are also important to consider. The dollar has historically acted as a safe-haven asset in times of global distress. If geopolitical tensions escalate or global risk sentiment weakens, capital flows into the dollar may accelerate regardless of interest rate trajectories.
In conclusion, the current DXY setup is a technically rich and macro-sensitive zone where price compression, bullish RSI divergence, and policy shifts are aligning. While confirmation is still needed, particularly via a breakout above the descending trendline and the 101.75 level, the probability of a structural shift is increasing. This setup is not a trading recommendation but rather an important chart to watch for clues about future dollar direction and its cascading impact on global FX pairs, commodities, and broader market sentiment.
Thanks for reading hope you like this publication.
Regards- Amit.

US Dollar Index (DXY) – Testing Long-Term Channel SupportBy MJTrading:
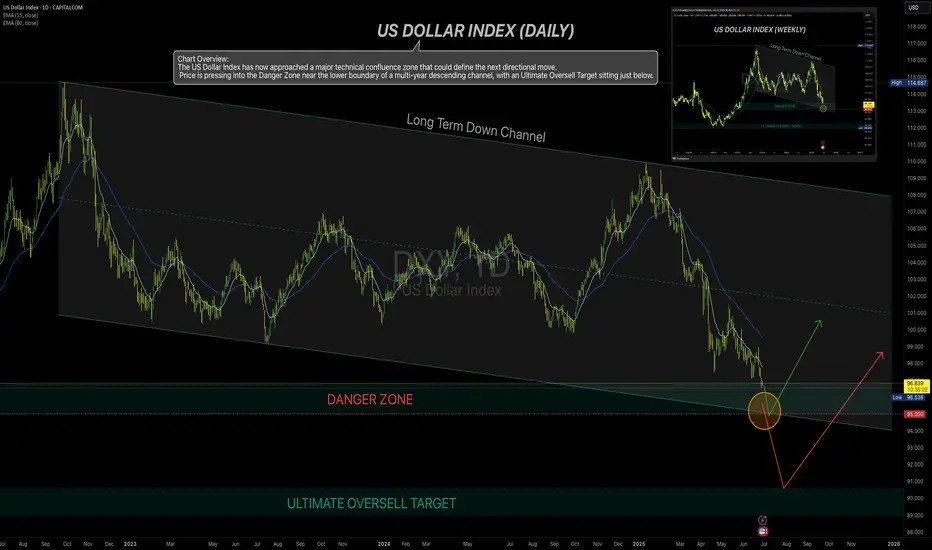
Chart Overview:
The US Dollar Index has now approached a major technical confluence zone that could define the next directional move. Price is pressing into the Danger Zone near the lower boundary of a multi-year descending channel, with an Ultimate Oversell Target sitting just below.
🔹 Key Technical Highlights:
Long-Term Down Channel (Daily & Weekly):
The DXY has respected this structure for several years.
Price is currently challenging the lower boundary, a zone where reactions often occur.
Danger Zone (~95–96):
A historically reactive area.
Prior demand and channel floor converge here.
Ultimate Oversell Target (~89–90):
Marked as a deeper potential exhaustion area if the channel fails.
Moving Averages:
15 EMA ~97.8
60 EMA ~99.3
Price remains below both EMAs, confirming persistent bearish momentum.
🔹 Potential Scenarios:
Scenario A (Green Path):
A bounce off current support could trigger a relief rally back toward 98–100, targeting the mid-channel and EMAs.
Scenario B (Red Path):
A breakdown below ~95 could accelerate selling pressure, aiming for the Ultimate Oversell Target (~89).
🔹 How I See It:
This is a high-risk inflection zone. Any bullish setups here remain counter-trend and require confirmation via strong reversal signals. Conversely, a decisive breakdown could have significant implications for USD pairs and commodities.
💡 Notes:
This chart includes the weekly inset view for broader context.
Keep risk management tight in this volatile area.
🔹 Reminder:
This idea is for educational purposes only—not financial advice.
💬 How are you positioning around the USD? Share your thoughts and charts below!
#Hashtags:
#MJTrading #DXY #USDollarIndex #Dollar #Forex #TechnicalAnalysis #TradingView #ChartAnalysis #PriceAction #FX #USD #Majors #DollarWeakness #DollarStrength #SupportAndResistance #TrendAnalysis #MarketOutlook
DXY Liquidity Sweep Into POI Before Bullish Expansion 🔍 Key Levels & Zones
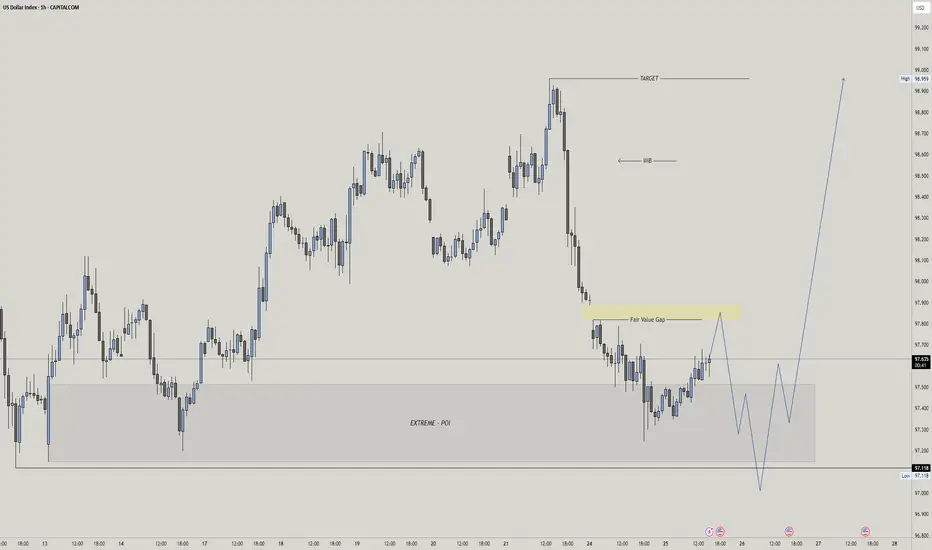
Extreme POI: Price is approaching a major demand zone (marked as EXTREME - POI), expecting reaction from this area.
Fair Value Gap (FVG): Price recently filled a small FVG at ~97.75 before pulling back.
Target: Implied move towards 98.95 area after internal liquidity is swept.
Scenario
Price tapped into the FVG and showed reaction — but no shift yet.
Anticipating liquidity sweep of recent lows into the Extreme POI (~97.11).
If bullish reaction confirms from POI, expecting strong move to:
Reclaim FVG
Break above IMB
Reach target zone at 98.95
🧠 Confluences
50 EMA resistance aligning with FVG — short-term sell pressure.
Classic Wyckoff accumulation schematic potential in POI zone.
Liquidity below marked lows for smart money grab.
⚠️ Invalidation
If price breaks and holds below 97.00 with bearish structure, bullish scenario is invalid.
Bias: Short-term bearish, then bullish continuation.
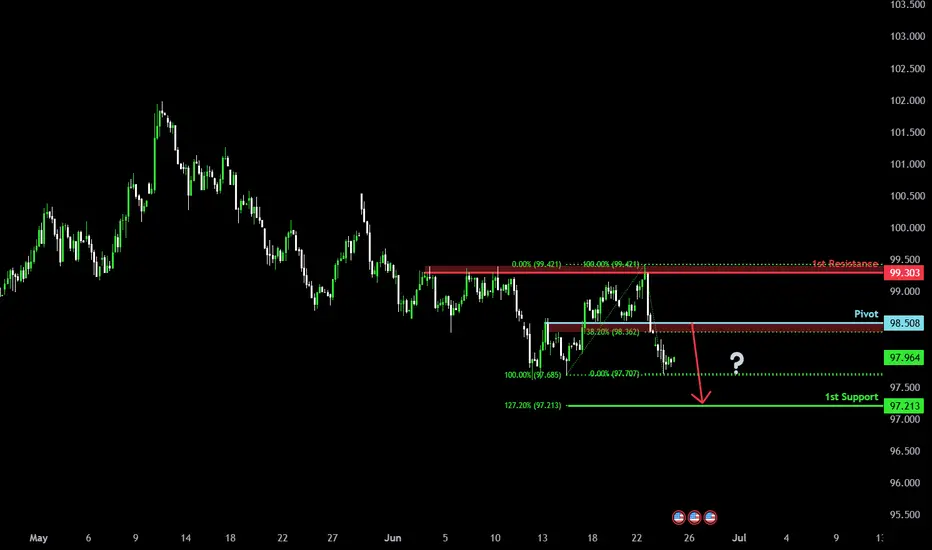
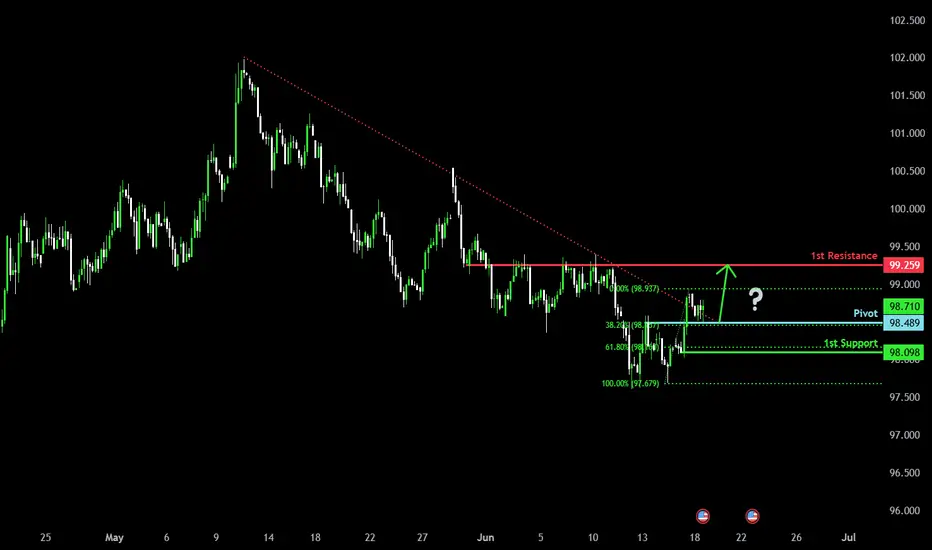
Overlap resistance ahead?The US Dollar Index (DXY) is rising towards the pivot, which is an overlap resistance and could reverse to the 1st support that lines up with the 127.2% Fibonacci extension.
Pivot: 98.50
1st Support: 97.21
1st Resistance: 99.30
Risk Warning:
Trading Forex and CFDs carries a high level of risk to your capital and you should only trade with money you can afford to lose. Trading Forex and CFDs may not be suitable for all investors, so please ensure that you fully understand the risks involved and seek independent advice if necessary.
Disclaimer:
The above opinions given constitute general market commentary, and do not constitute the opinion or advice of IC Markets or any form of personal or investment advice.
Any opinions, news, research, analyses, prices, other information, or links to third-party sites contained on this website are provided on an "as-is" basis, are intended only to be informative, is not an advice nor a recommendation, nor research, or a record of our trading prices, or an offer of, or solicitation for a transaction in any financial instrument and thus should not be treated as such. The information provided does not involve any specific investment objectives, financial situation and needs of any specific person who may receive it. Please be aware, that past performance is not a reliable indicator of future performance and/or results. Past Performance or Forward-looking scenarios based upon the reasonable beliefs of the third-party provider are not a guarantee of future performance. Actual results may differ materially from those anticipated in forward-looking or past performance statements. IC Markets makes no representation or warranty and assumes no liability as to the accuracy or completeness of the information provided, nor any loss arising from any investment based on a recommendation, forecast or any information supplied by any third-party.
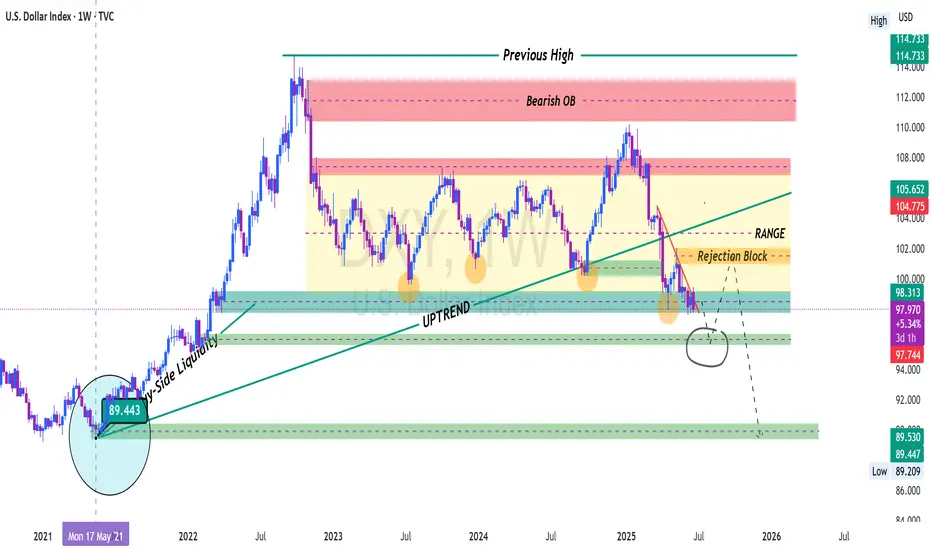
DXY QUITE BEARISH ON WEEKLY DXY might just drop to previous low of May 2021 at the 89 if this weekly downtrend continues
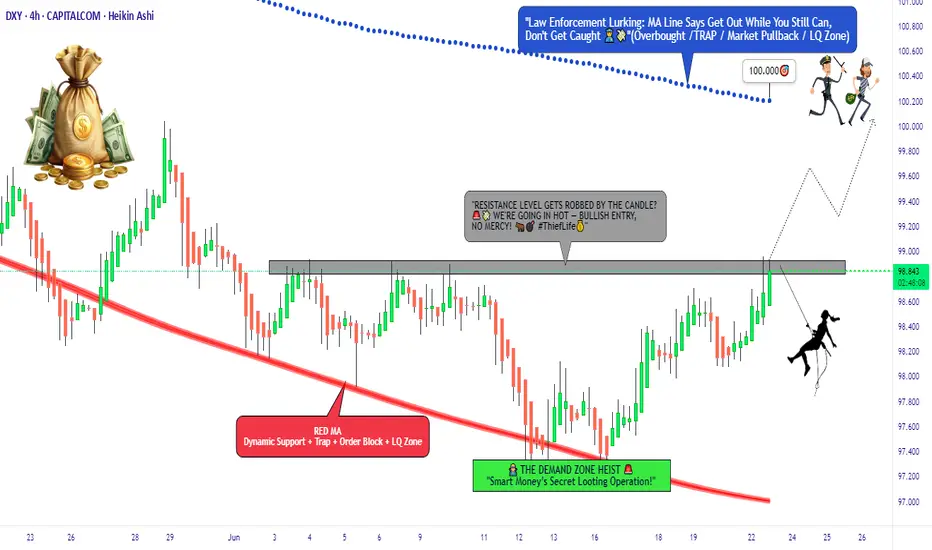
“The Dollar Job: Break-In Strategy for 99+ Profits”💸 “DXY Heist Blueprint: Thieves’ Bullish Breakout Play” 🏴☠️
🌟Hi! Hola! Ola! Bonjour! Hallo! Marhaba!🌟
Welcome, Money Makers & Silent Robbers 🕶️💼✨
This is our next big Thief Trading Heist Plan targeting the 💵 DXY Dollar Index Vault. Armed with both technical precision 🔍 and fundamental insight 📊, we're ready to strike smart — not just fast.
🎯 THE MASTER HEIST PLAN:
🟢 ENTRY POINT – “Heist Entry Protocol”
🎯 Wait for price to break above Resistance @ 99.000 and candle to close ✅
💥 Plan A: Place Buy Stop Orders just above breakout
📥 Plan B: For Pullback Pros, use Buy Limit at recent swing low/high (15m–30m TF)
📌 Tip: Set alerts — don’t get caught napping while the vault opens! ⏰🔔
🛑 STOP LOSS – “Thief’s Escape Hatch”
🧠 Use 4H swing low at 98.100 as SL
⚖️ Adjust based on your lot size and number of open positions
🚨 Don't rush to set SL for Buy Stop entries before confirmation! Patience is part of the plan. 😎
🎯 TARGET – “Mission Objective”
💰 First Exit Target: 100.000
🏃♂️ Optional: Escape earlier near high-risk zones (Blue MA Line Trap Area)
⚔️ SCALPERS' CODE – Stay Sharp!
Only scalp on the Long side.
🔐 Use Trailing SL to guard your loot!
💸 Big wallets? Jump early.
🧠 Smaller stack? Follow the swing crew for coordinated execution.
🌐 MARKET OUTLOOK: WHY THE VAULT’S OPENING
💡 Currently seeing bullish momentum in the DXY
📈 Driven by macroeconomics, sentiment shifts, and intermarket pressure
📰 Want the full debrief? Check our analysis across:
COT Data
Geopolitics & News
Macro Trends & Sentiment
Fundamental Forces
📎🔗 See full breakdown
⚠️ TRADE MANAGEMENT ALERT
🚫 Avoid opening new trades during high-impact news
🔁 Always use Trailing Stops to lock in profits
❤️ Support The Heist – Boost the Plan!
Every boost powers our underground crew 🐱👤.
We rob the markets, not the people. 💼💰
Like & Boost to help grow the Thief Trading Gang 👊💥
Stay tuned, robbers – more heist plans dropping soon.
💸🚀📈🤑
DOLLAR INDEXThe relationship between the US Dollar Index (DXY) and the 10-year US Treasury yield is generally positive but has shown signs of weakening and occasional breakdowns recently.
Key Points:
Typical Positive Correlation:
Historically, when the 10-year Treasury yield rises, the dollar tends to strengthen, and when yields fall, the dollar weakens. This is because higher yields attract foreign capital seeking better returns, increasing demand for the dollar. Conversely, lower yields reduce dollar appeal.
Mechanism:
The 10-year yield reflects investor expectations about inflation, economic growth, and Federal Reserve policy. Higher yields often signal stronger growth or inflation, supporting a stronger dollar due to higher real returns on US assets.
Recent Weakening of Correlation:
Since early 2025, this positive correlation has weakened significantly. Despite rising 10-year yields (around 4.4% to 4.5%), the DXY has hovered near the 98–99 range and even declined over 10% year-to-date. This divergence is attributed to:
Investors re-evaluating the dollar’s reserve currency status and shifting capital to other markets (e.g., European equities).
Outflows from US assets amid geopolitical and economic uncertainty.
Asynchronous monetary policy cycles globally, with some central banks hiking or cutting rates at different paces than the Fed.
Market Sentiment and Safe-Haven Flows:
In times of stress, the dollar’s traditional role as a safe haven can be challenged, further complicating the yield-dollar relationship.
Conclusion
While the 10-year Treasury yield and the US dollar index usually move together, recent market dynamics have disrupted this pattern. Rising yields have not translated into a stronger dollar in 2025, reflecting broader shifts in investor sentiment, geopolitical risks, and global monetary policy divergence.

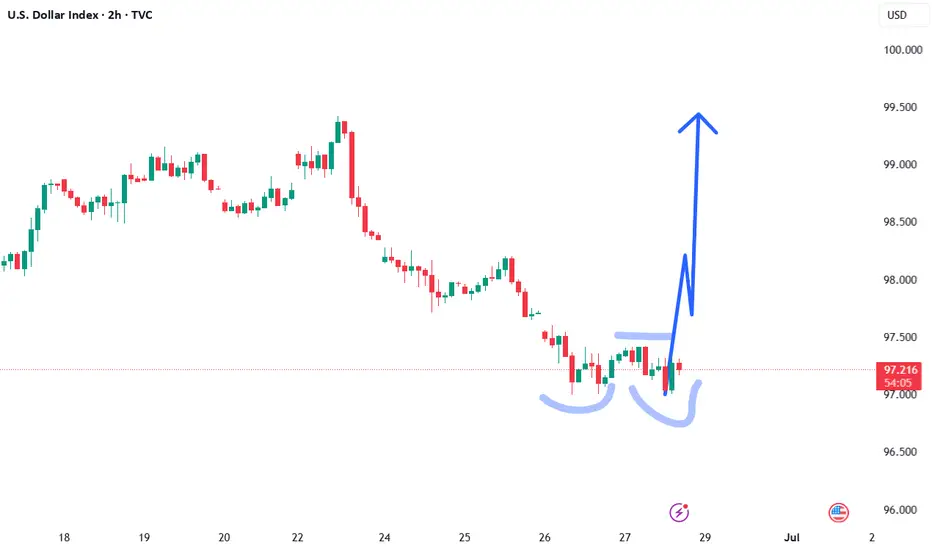
Dollar Index Analysis: Wedge + Powell Outlook – June 25, 2025📉 Technical Outlook: Bearish Rising Wedge + Liquidity Sweep Setup
TVC:DXY The Dollar Index (DXY) is currently trading within a rising wedge pattern, typically a bearish structure. We're anticipating a fake breakdown, potential sweep of the key demand zone, followed by a reversal move targeting key highs.
🔍 Key Technical Zones
📥 Demand Zone (Buy Area):
🔵 97.50 – 97.20 = Institutional accumulation + unfilled orders
🚫 Invalidation Level (Stop-Loss) :
❌ 96.70 = Clean break below confirms full bearish continuation
🎯 Target Projections (Upside Levels) :
TP1: 99.00
TP2: 100.00
TP3: 101.04 (HTF swing high liquidity cleanout)
🧠 Summary Setup :
Downtrend
Rising wedge formation
Sweep of 97.20 possible
Watch for fakeout & reversal play toward 101.04
🏛️ Fundamental Analysis – Powell’s Testimony Insights
Fed Chair Powell highlighted the following during his recent testimony:
🔄 “We’re not there yet on inflation” — Core services remain sticky
🛑 No immediate rate cuts — Growth is slowing but not crashing
🕰 Rate cuts likely postponed to Q4 2025
🔐 “Real rates are restrictive enough” = No more hikes expected
💡 Implication for DXY :
✅ Short-term bullish bias as higher U.S. yields remain attractive if rate cuts are delayed.
🌍 Macro Context Snapshot (as of June 25, 2025)
🇺🇸 US Disinflation: CPI & PCE easing, but not collapsing
🇪🇺 ECB Cut in June: Euro may weaken further
🇯🇵 BOJ Policy Unclear: USD/JPY likely volatile
🌐 Global Risk Appetite High: Volatility may return with geopolitical events
🔥 Watch This: Trade Tariff Narrative Heating Up
🚨 New U.S. Tariff Signals on Chinese tech and EU autos are resurfacing. This could:
Push inflation risk higher
Delay Fed’s easing timeline
Add support to USD short term as markets price in geopolitical tension and uncertainty
📌 Trading Strategy Recap :
Monitor wedge support near 97.20
Look for fakeout/sweep and bullish reversal
Target 99–101 zone on rebound
Stay alert to Powell/Fed rhetoric + tariff news
If you find this analysis helpful, Like, Comment, and Follow for more DXY, gold, and macro trades!
Dollar Index Bearish to $96 (UPDATE)I posted this DXY sell thesis yesterday for you all while price was still at $97.70. Since then sellers have taken out the previous Wave 3 low, creating a new daily low today at $96.90📉
We still have more downside yet to come towards our $96.60 target. So, use this 'DXY Sell Thesis' to help you with your trading, so once you can use this as a confluence to buy inverse correlated markets
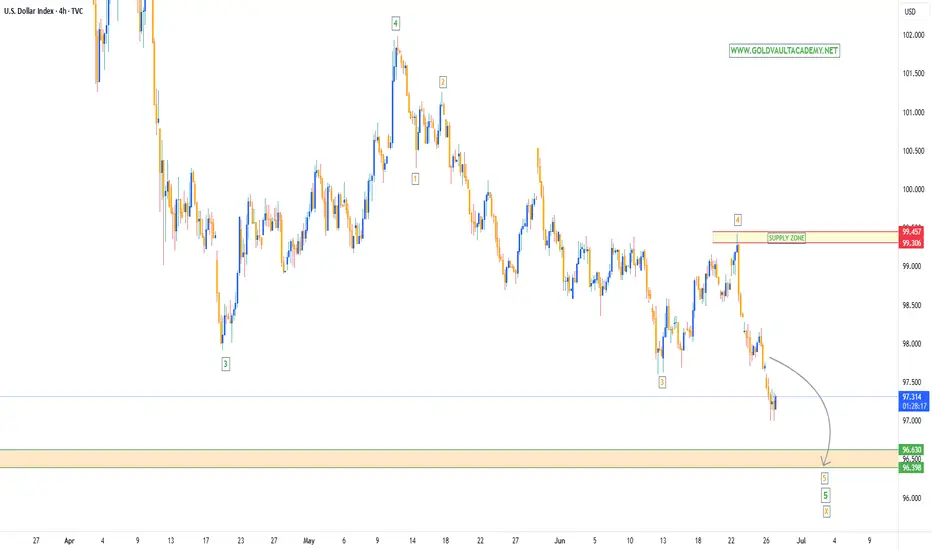
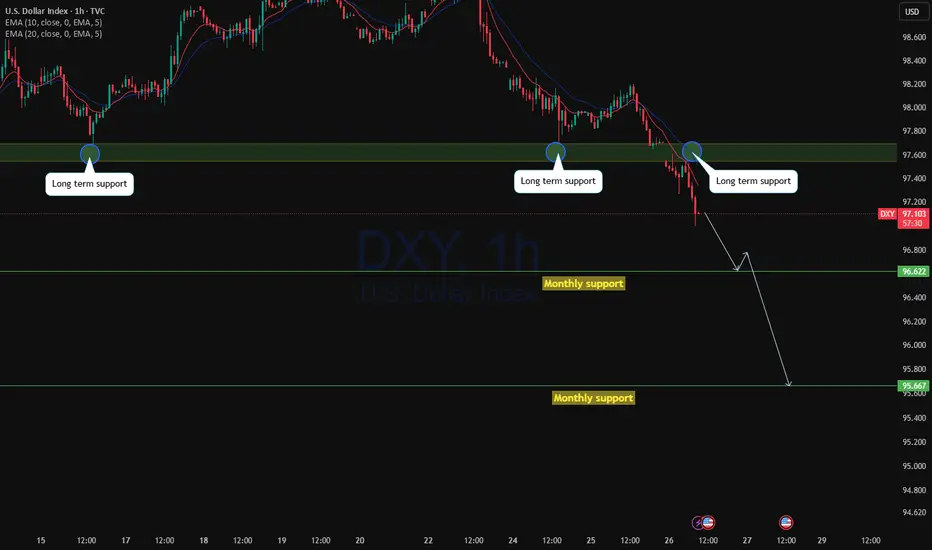
Free fall on DXY?With gap open at 97.66 level before the monthly close price has broken the monthly support and started to drop. We may see the price to drop to long term monthly support at 96.622 or further below to 95.66 as with the increased bearish pressure we may see the price to continue to drop to this longer term support level.
As with upcoming USD news we may see the price to move to this level with high probability bearish trend.
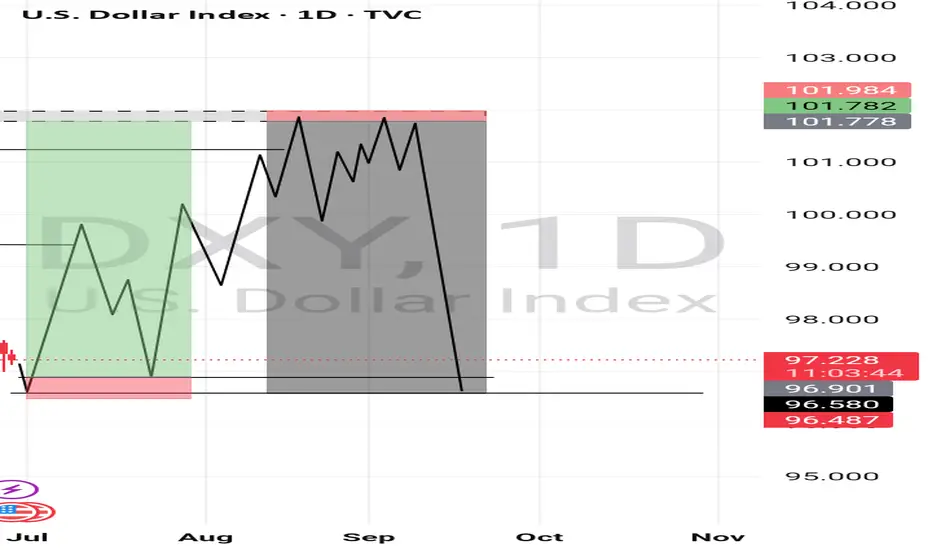
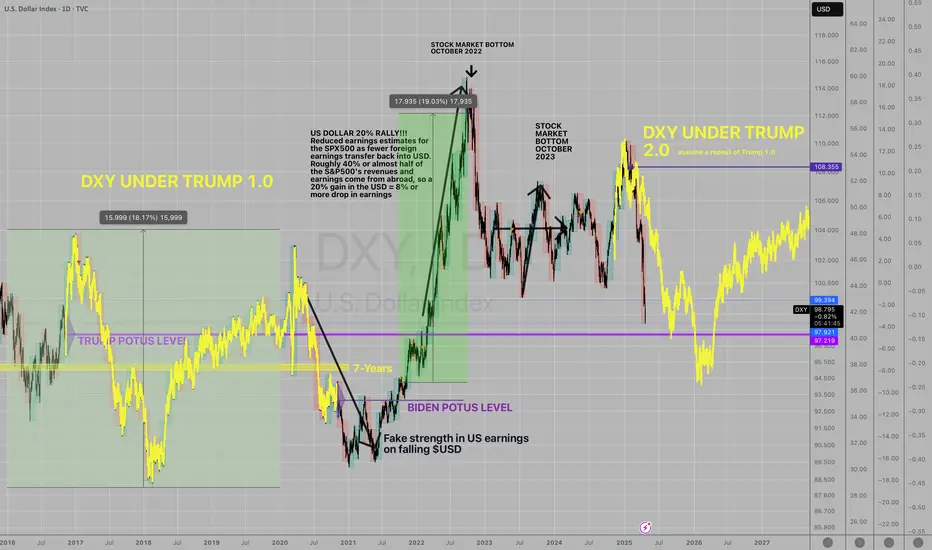
$DXY Repeating 2016 Post-Election I have highlighted the 2016 to 2020 Presidential Elections time period and then pasted that timeframe onto the 2024 election and found that the pattern is going along very similarly to Trump 1.0.
If we assume that the future unfolds the same as last time, which is low probability, of course, then the future will unfold as shown in the yellow bars going into the future, as shown.
Initially in 2016 post election there was a 7% rally in the U.S. Dollar Index and then a 15% retreat for the following year. So far in 2025 we have seen the same rally and a similar decline, but only faster this time.
It would appear as thought the bulk majority of the declines in the TVC:DXY are over at this time with perhaps 4% further downside over the balance of the year.
The Dollar Index has been useful for predicting changes in the earnings estimates for the S&P500 in the USA due to the high percentage of earnings coming back to the US for quarterly reporting. I have posted a few charts in the past which have been helpful at determining the risk in the stock market.
The behavior of the global central banks has certainly had its impact on monetary aggregates and inflation. The policy response since the Covid Pandemic has been for maximum liquidity and maximum Government spending to keep the global economy afloat. The post-Covid response is now coming to a head along with new policy directives to cut wasteful Government spending and to reduce inflation (caused the Gov't spending).
Global investors have flocked to the US for access to high technology stocks and have driven up the value of US assets to extreme levels compared to other markets. This adjustment phase where investors remove money from overvalued, or highly valued, US assets back to other markets has created a wave of selling in the US Dollar and US listed equities.
What does the future hold? We never know but we sure can learn from what happened in the past by looking at charts just like this one to see what may happen. Looks like a bounce in the TVC:DXY from here, followed by a new low and then a rebound into the next few years.
All the best,
Tim
April 22, 2025 1:16PM EST TVC:DXY 98.78 last
DXY Potential DownsidesHey Traders, in today's trading session we are monitoring DXY for a selling opportunity around 99.300 zone, DXY is trading in a downtrend and currently is in a correction phase in which it is approaching the trend at 99.300 support and resistance area.
Trade safe, Joe.

DXY Eyes Key Long-Term Support from 2008The U.S. Dollar Index (DXY) is currently trading near three-year lows, reflecting concerns over economic fragility and heightened geopolitical tensions.
If price action holds below 97, the DXY could face additional pressure, potentially descending toward the lower boundary of a long-term channel that has held since the 2008 lows. Key support levels at 96 and 94 may offer potential rebound zones.
Monthly RSI reflects more downside potential towards oversold conditions last seen in 2021. To reverse the current bearish momentum, the index would need to regain and hold above the 100-mark, which could shift sentiment back toward a bullish rebound outlook against the markets.
- Razan Hilal, CMT

Bullish bounce?US Dollar Index (DXY) is falling towards the pivot and could bounce to the 1st resistance.
Pivot: 98.48
1st Support: 97.62
1st Resistance: 99.47
Risk Warning:
Trading Forex and CFDs carries a high level of risk to your capital and you should only trade with money you can afford to lose. Trading Forex and CFDs may not be suitable for all investors, so please ensure that you fully understand the risks involved and seek independent advice if necessary.
Disclaimer:
The above opinions given constitute general market commentary, and do not constitute the opinion or advice of IC Markets or any form of personal or investment advice.
Any opinions, news, research, analyses, prices, other information, or links to third-party sites contained on this website are provided on an "as-is" basis, are intended only to be informative, is not an advice nor a recommendation, nor research, or a record of our trading prices, or an offer of, or solicitation for a transaction in any financial instrument and thus should not be treated as such. The information provided does not involve any specific investment objectives, financial situation and needs of any specific person who may receive it. Please be aware, that past performance is not a reliable indicator of future performance and/or results. Past Performance or Forward-looking scenarios based upon the reasonable beliefs of the third-party provider are not a guarantee of future performance. Actual results may differ materially from those anticipated in forward-looking or past performance statements. IC Markets makes no representation or warranty and assumes no liability as to the accuracy or completeness of the information provided, nor any loss arising from any investment based on a recommendation, forecast or any information supplied by any third-party.

Bullish bounce?US Dollar Index (DXY) is reacting off the pivot and could rise to the 1st resistance.
Pivot: 98.48
1st Support: 98.09
1st Resistance: 99.25
Risk Warning:
Trading Forex and CFDs carries a high level of risk to your capital and you should only trade with money you can afford to lose. Trading Forex and CFDs may not be suitable for all investors, so please ensure that you fully understand the risks involved and seek independent advice if necessary.
Disclaimer:
The above opinions given constitute general market commentary, and do not constitute the opinion or advice of IC Markets or any form of personal or investment advice.
Any opinions, news, research, analyses, prices, other information, or links to third-party sites contained on this website are provided on an "as-is" basis, are intended only to be informative, is not an advice nor a recommendation, nor research, or a record of our trading prices, or an offer of, or solicitation for a transaction in any financial instrument and thus should not be treated as such. The information provided does not involve any specific investment objectives, financial situation and needs of any specific person who may receive it. Please be aware, that past performance is not a reliable indicator of future performance and/or results. Past Performance or Forward-looking scenarios based upon the reasonable beliefs of the third-party provider are not a guarantee of future performance. Actual results may differ materially from those anticipated in forward-looking or past performance statements. IC Markets makes no representation or warranty and assumes no liability as to the accuracy or completeness of the information provided, nor any loss arising from any investment based on a recommendation, forecast or any information supplied by any third-party.
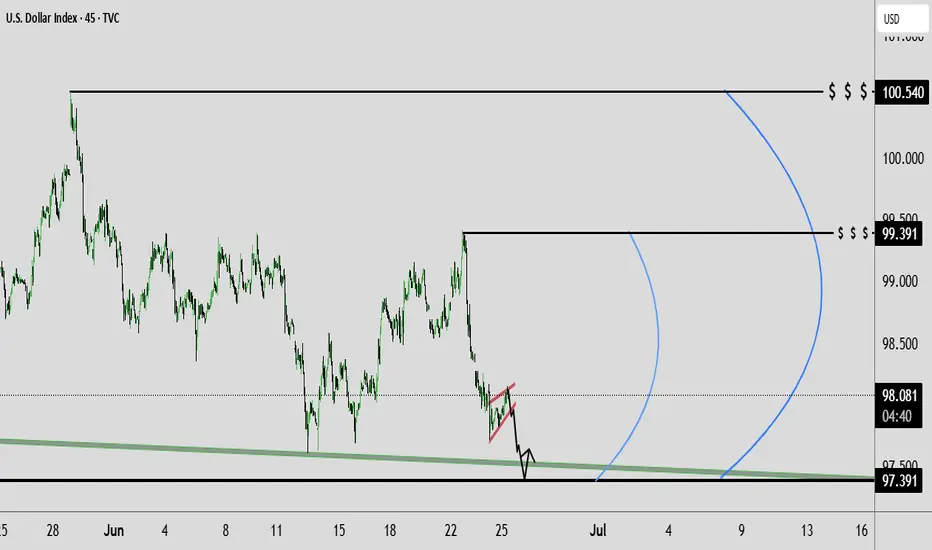
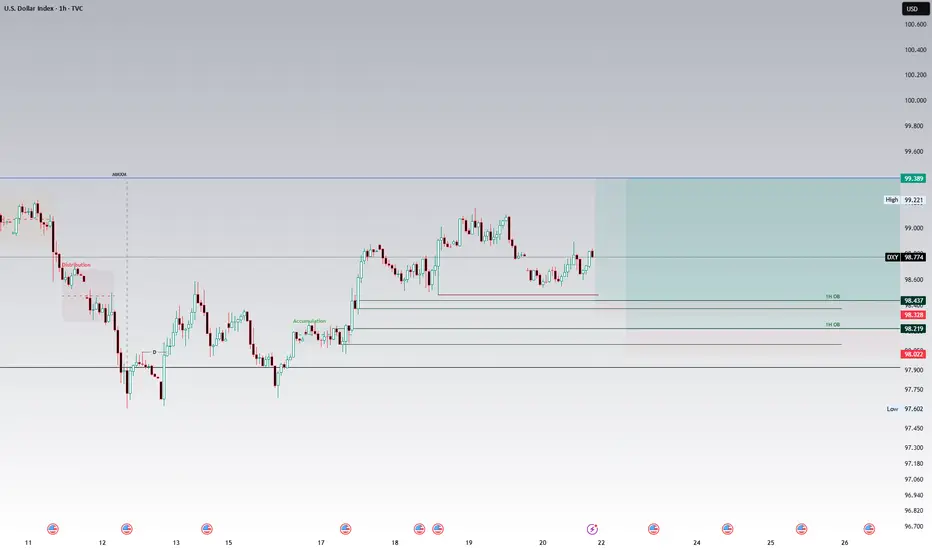
Potential Bullish Scenario for DXY, target objective is 99.392Higher timeframe analysis
As discussed in last week's analysis of the DXY, the higher timeframe draw on liquidity is the bearish monthly Fair value gap set at 101.977. This warrants a higher timeframe bullish bias until this level has been achieved.
Intermediate timeframe analysis
We note the relative equal highs on the daily and 1H chart at 99.392. This serves as a intermediate timeframe draw on liquidity and target objective.
Also note that the buyside of the curve of the market maker buy model has commenced which further fuels bullish sentiment.
Scenario 1
On the 1H chart, note the relative equal lows at 98.482. These lows are expected to be ran to serve as a liquidity primer for the bullish 1H order block at 98.436 which is expected to be respected and held. This poses a rather handsome risk to reward ratio.
Scenario 2
Should price push past the invalidation point of the bullish 1H order block we could see it head to the bullish 1H order block at the initial accumulation at 98.219. The reward on this setup would make up for the loss of scenario 1.
Disclaimer
The above analysis is intended for educational purposes only and should not be interpreted as financial advice.
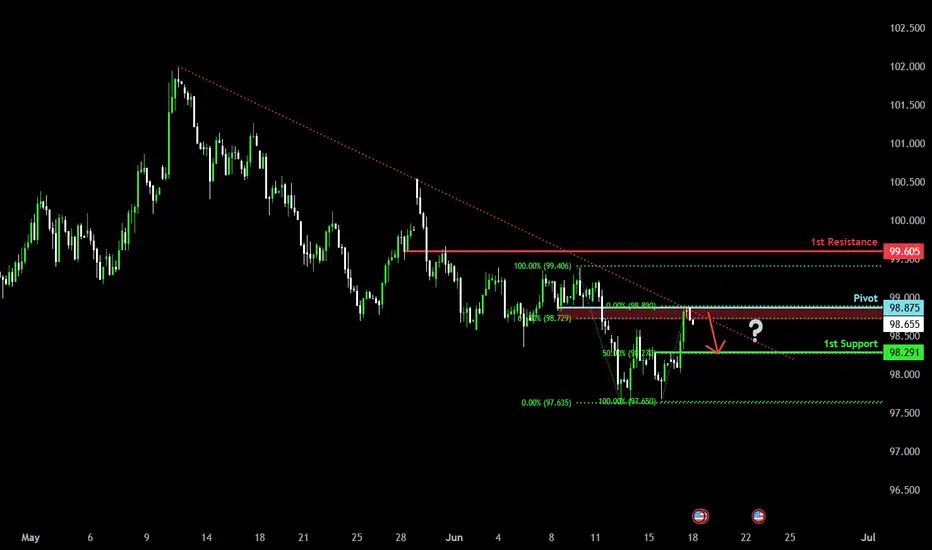
Bearish reversal?US Dollar Index (DXY) has reacted off the pivot and could drop to the 1st support.
Pivot: 98.89
1st Support: 98.29
1st Resistance: 99.60
Risk Warning:
Trading Forex and CFDs carries a high level of risk to your capital and you should only trade with money you can afford to lose. Trading Forex and CFDs may not be suitable for all investors, so please ensure that you fully understand the risks involved and seek independent advice if necessary.
Disclaimer:
The above opinions given constitute general market commentary, and do not constitute the opinion or advice of IC Markets or any form of personal or investment advice.
Any opinions, news, research, analyses, prices, other information, or links to third-party sites contained on this website are provided on an "as-is" basis, are intended only to be informative, is not an advice nor a recommendation, nor research, or a record of our trading prices, or an offer of, or solicitation for a transaction in any financial instrument and thus should not be treated as such. The information provided does not involve any specific investment objectives, financial situation and needs of any specific person who may receive it. Please be aware, that past performance is not a reliable indicator of future performance and/or results. Past Performance or Forward-looking scenarios based upon the reasonable beliefs of the third-party provider are not a guarantee of future performance. Actual results may differ materially from those anticipated in forward-looking or past performance statements. IC Markets makes no representation or warranty and assumes no liability as to the accuracy or completeness of the information provided, nor any loss arising from any investment based on a recommendation, forecast or any information supplied by any third-party.