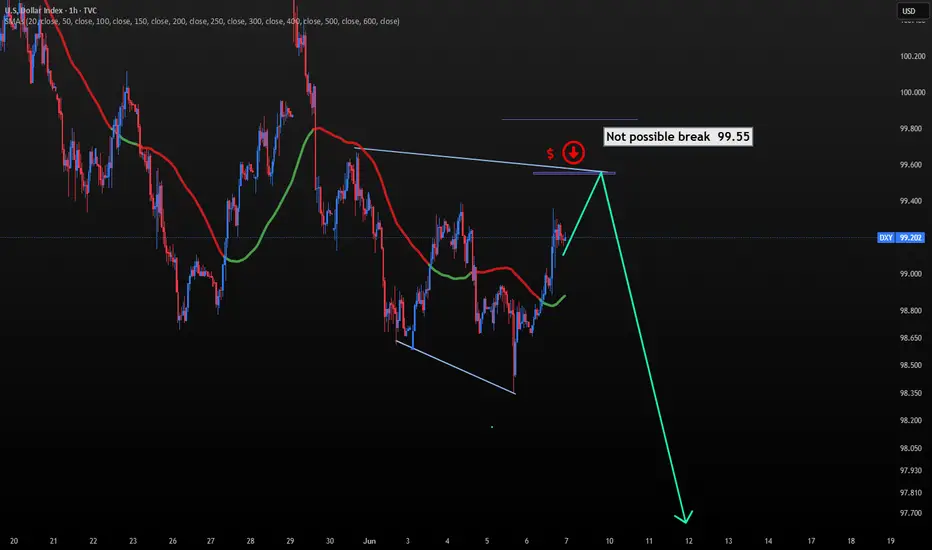
dxy 1hr chart analaysis The current bullish trend in the DXY is likely to face a strong rejection around the 99.55–99.65 zone. Unless there is major news that significantly shifts the market direction — such as a surprise policy announcement like the tariffs introduced during Trump's era — the dollar index is not expected to break above that level. That zone could act as a major turning point, and a bearish reversal is likely to emerge from there
USDX trade ideas
DXY direction.With the news in great favour of DXY, PA also shows multiple rejection at the support zone (clearly oversold already).
Focus on EURUSD and GBPUSD for a long time sell.

DXY OUTLOOKhello.
this is my view or the dwy in the next 2 days :)
hope you find this helpfull
i wil update in the mid week
DXYWe are expecting DXY to give us bullishness in this week first.
Disclosure: We are part of Trade Nation's Influencer program and receive a monthly fee for using their TradingView charts in our analysis.
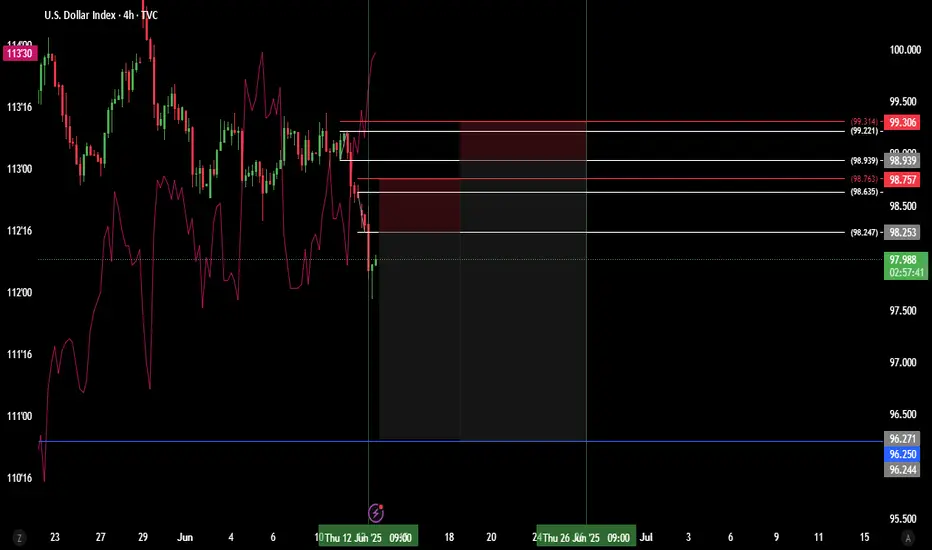
Dollar consolidating - Still long term bearishLets see if the Daily Volume imbalance can hold price lower here. If it breaks higher then the clean highs will be a target for a sweep then return lower again. FOMC Tomorrow!! Stay safe

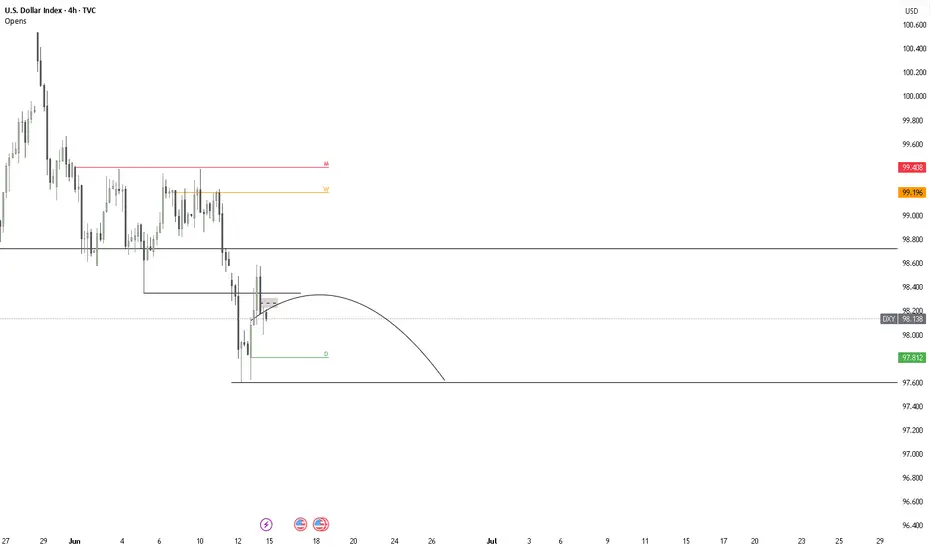
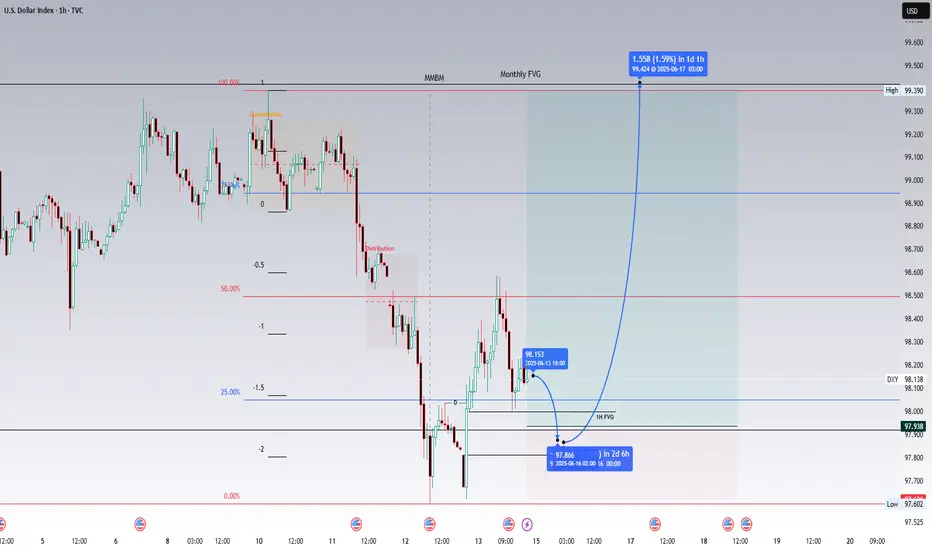
Potential bullish scenario formulating for DXY. Target: 99.418.Higher timeframe analysis
Thursday, 12 June 2025 saw the DXY take out the monthly low of 97.921. This poses the bearish monthly FVG as an immediate draw on liquidity at 99.418. Warranting a bullish bias till this level.
Intermediate timeframe analysis
This bullish bias is further confirmed by an initial consolidation identified on the 1H chart immediately below the said monthly FVG. This is a signature of the formation of a market maker buy model. Note the displacement to the updside which occurred at 21:00 EST leaving behind a bullish fair value gap on the 1H. This signals the beginning of the buyside of the curve of a market maker buy model.
Scenario
A potential long scenario could play out whereby price could respect the bullish 1H FVG at 97.999 and reprice updwards towards 99.418. I suspect that the target could be reached by Tuesday morning at 2:00 am - 3:30 am EST, though this is merely an estimation at best. This analysis is largely dependent on the reaction of price in the weekly open. Though in the event of a non-volatile market open this analysis holds decent probability.
Alternate Scenario
Should the above analysis fail the relative equal lows at 97.602 could be taken out before upside to 99.418 is seen.
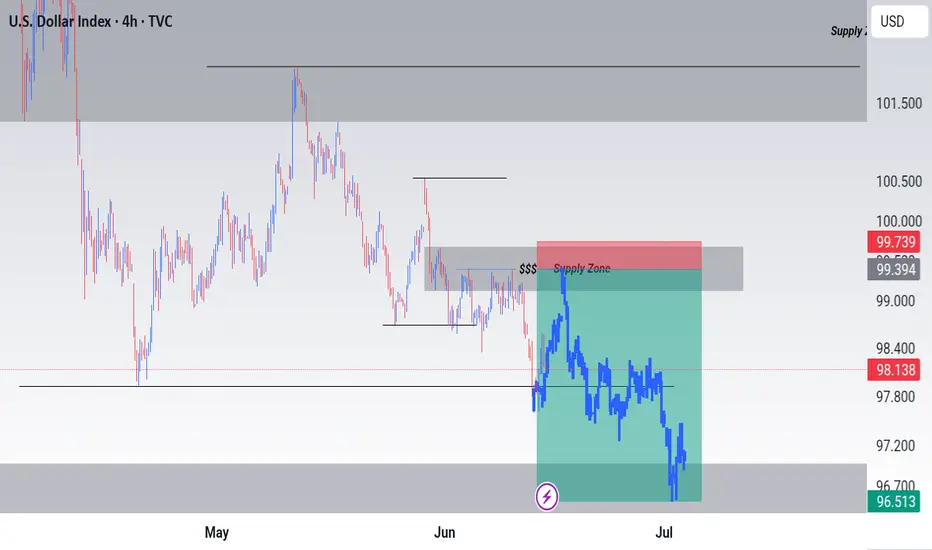
Short Idea on DXYBased on :
- Investors surprised by the cpi new and seeking safety in bonds (ZB1!) making dollar go down
- break out of an important support level
- 2 supply zones
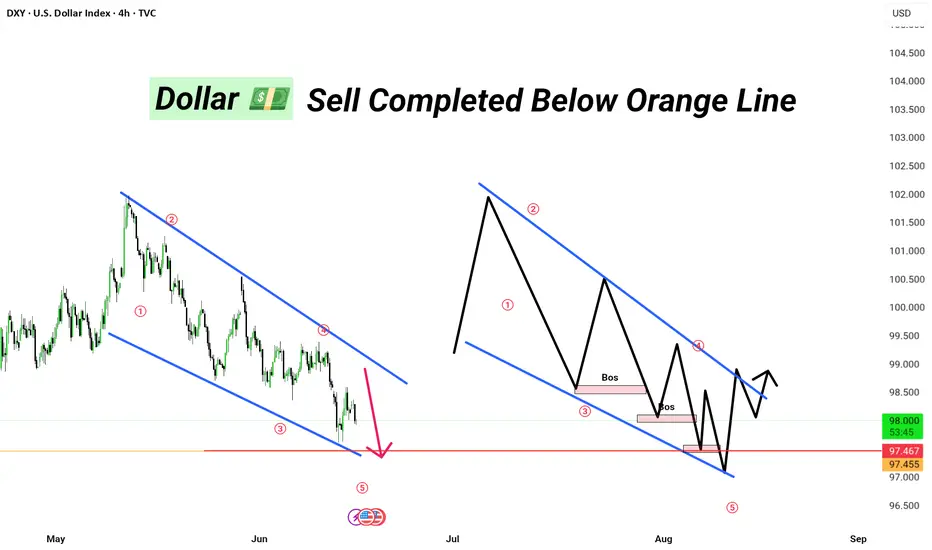
DXY ||| • Sell Completed Below Orange Line📉 Pair: GBP/USD
⏱ Timeframe: 4H
🔶 Orange Line = Major S/R Zone
📌 Confirmed Break + Retest
🎯 Profit Locked | Risk Managed
Strategy: Elliott Wave + Parallel Channel + SMC (Break of Structure)
🔶 Status:
Completed Wave 5 inside falling wedge
Sell executed after orange support break
Anticipating accumulation phase > BOS > bullish reversal
📍Key Zones:
Demand zone near 97.455
Resistance near 98.426
🎯 Next Steps: Looking for bullish structure post BOS + Wave 2 pullback.
🔁 Watch for:
Accumulation near lower trendline
Structure shift > Breakout of wedge
Long confirmations in late July – early August
🟢 Plan the trade, trade the plan.
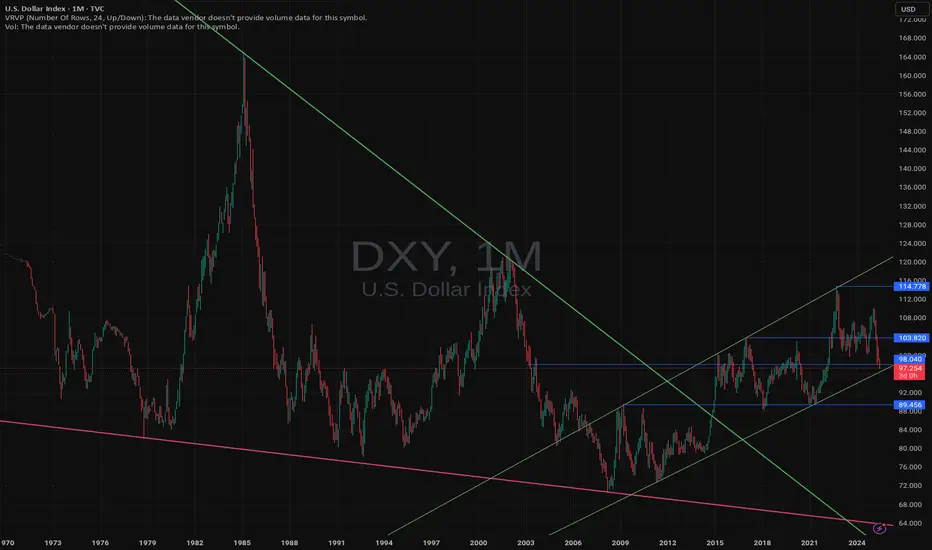
DOLLAR INDEXThe DXY (U.S. Dollar Index) is a measure of the U.S. dollar’s value relative to a basket of six major foreign currencies: the euro (57.6%), Japanese yen (13.6%), British pound (11.9%), Canadian dollar (9.1%), Swedish krona (4.2%), and Swiss franc (3.6%). It serves as a benchmark for the dollar’s global strength and is influenced by macroeconomic factors like interest rates, trade flows, and inflation expectations.
10 years bond yield Correlations with DXY
1. 10-Year Bond Yield
Positive Correlation: The DXY and U.S. 10-year Treasury yields generally move in the same direction. Higher yields attract foreign capital into U.S. bonds, increasing demand for dollars and strengthening the DXY.
Current 10-Year Yield (June 12, 2025): 4.36%, down slightly from 4.41% the previous day but up 1.16% year-over-year.
2. Bond Price
Inverse Relationship with Yields: Bond prices fall when yields rise (and vice versa). Since DXY and yields are positively correlated, the dollar tends to strengthen when bond prices decline.
3. Interest Rates
Direct Link: Higher U.S. interest rates increase the dollar’s appeal as investors seek higher returns, boosting DXY. Conversely, rate cuts weaken the dollar.
Example: The Federal Reserve’s rate hikes in 2023–2024 contributed to DXY strength, while recent rate-cut expectations have moderated its gains.
Current 10-Year Treasury Yield
As of June 12, 2025, the 10-year Treasury yield is 4.36%, below its long-term average of 5.83%.
Key Drivers of DXY in 2025
Federal Reserve Policy: Markets are pricing in potential rate cuts later in 2025, which could limit DXY upside.
Global Risk Sentiment: Safe-haven dollar demand rises during geopolitical or economic uncertainty.
Inflation Trends: Persistent U.S. inflation could delay Fed easing, supporting DXY
technical level to watch is the support level at 97,949
My Thoughts #015My Thoughts
Are that the pair will sell in this manner.
The pair is in a bearish pattern
Currently the pair is making a new LL
Meaning that on the lower time frame the pair is in a bearish pattern.
As you can see that pair just made a new LL a new LH is expected
It could buy and invalidate the set up.
Just use proper risk management
Let's do the most
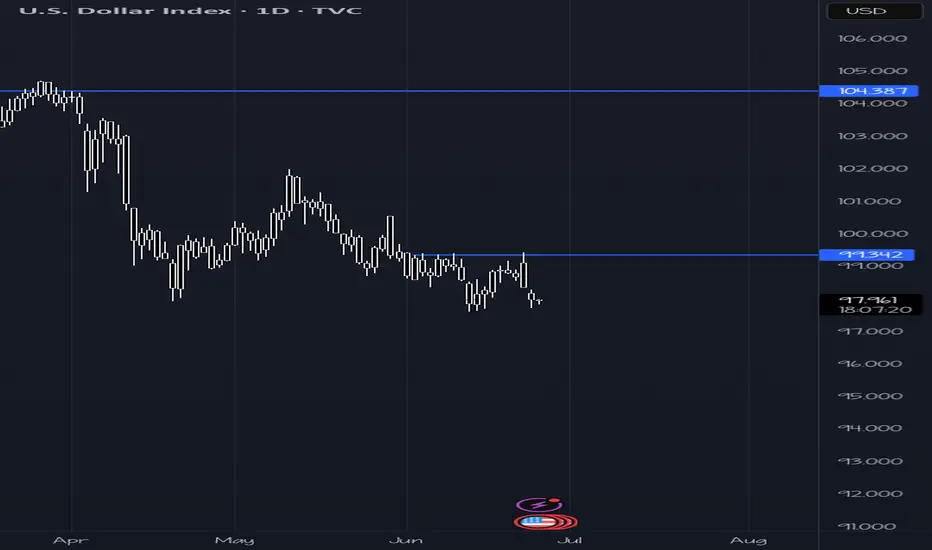
Caution for Dollar Shorts with Middle East Tensions FlaringMy educated guess is that the dollar is moving similar to the first time trump was elected. I am expecting dollar weakness to abate early next year. A major swing low formed in early 2018 one year after Trump was elected first round. Let us see if a similar situation forms next year. For now with DXY structured bearish caution is warranted with Oil up and 10 yr remaining elevated. There is a prior up move in April and until a decisive break below the current area Price Action and circumstances in the middle east warrant caution for dollar shorts.
$DXY Looks like a long.If the TVC:DXY can hold this trend line, it would suggest a bounce back up to the resistance.
makes sense if the yields end up higher at some point.
Will see
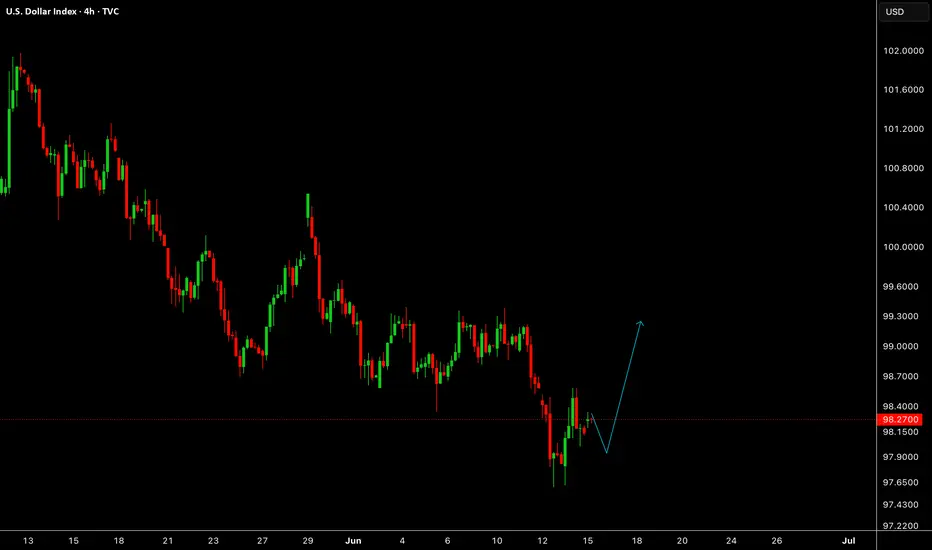
DXY - 4H BASEUSD is creating a base just below H4 EMA9.
This is very important combination of candles. It's a setup that gives bulls hope for a bounce at least. A condition - bulls must step in NOW. Confirmation will come only when price closes above EMA 9.
DXY This week on DXY we can see shift from last week longs to short this week based on big institutions smart money. So more bearish expected throughout the week.
Make US(and USD) weak again, and short DXY 99,358Hey traders, this is a fundamentally and technically based idea. I´m expecting a weakening of USD due to actual US goverment policy. Important weekly lenel 100,600 was broken and holding. If you decide to trade this idea, you can enter now at current price 99,358 and hold till profit lines. TP your trade partially. You can consider averaging at 100,600 instead of cutloss after the reaction. Wish you good luck.

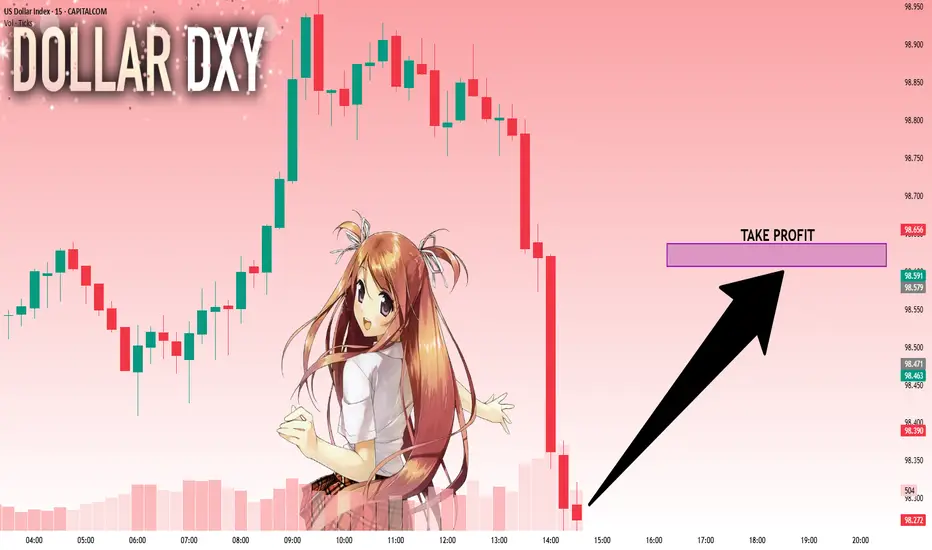
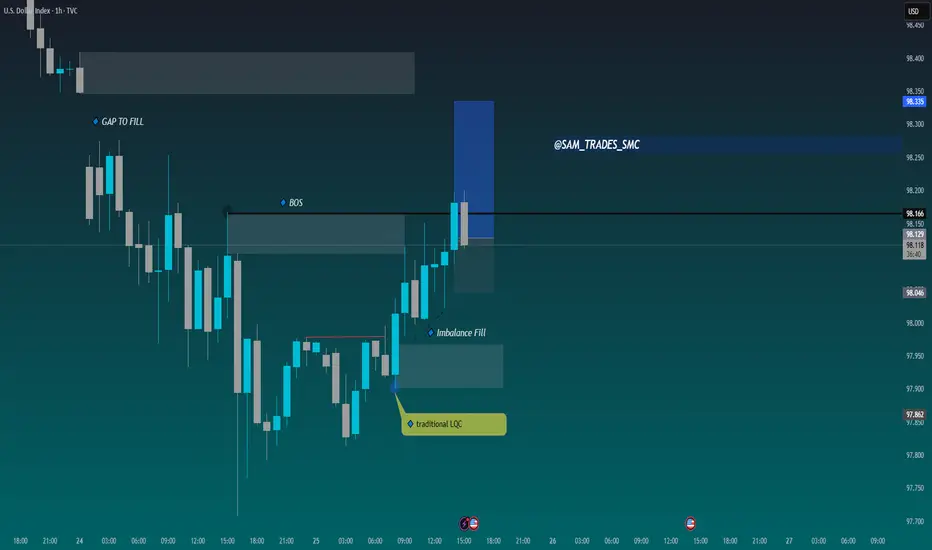
DXY | daily outlookYALL LIKE THE NEW FACE LIFT??
Price tapped into a refined demand zone after breaking short-term structure, confirming bullish intent. Entry was executed on the mitigation of a prior imbalance, with confluence from BOS (Break of Structure) and trendline liquidity sweep.
Now aiming for the next H1 supply zone where price is likely to react. Bullish continuation expected as long as price holds above 98.080.
TP set just before the high to secure profits before potential distribution.
PLS BOOST & LIKE FOR MORE...
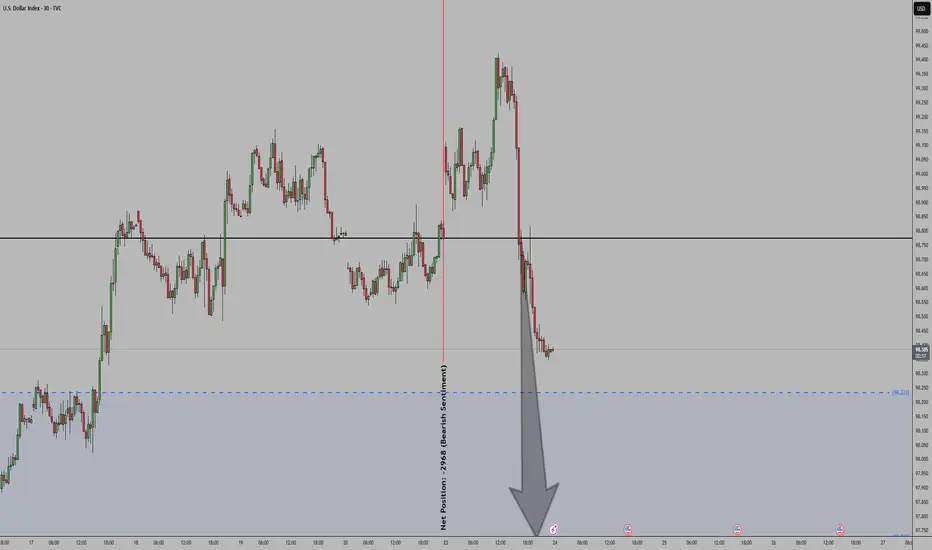
DXY Bearish - 4HR Sell Side LiquidityDXY Bearish - 4HR Sell Side Liquidity - very likely DXY will push down this week and take out the SSL
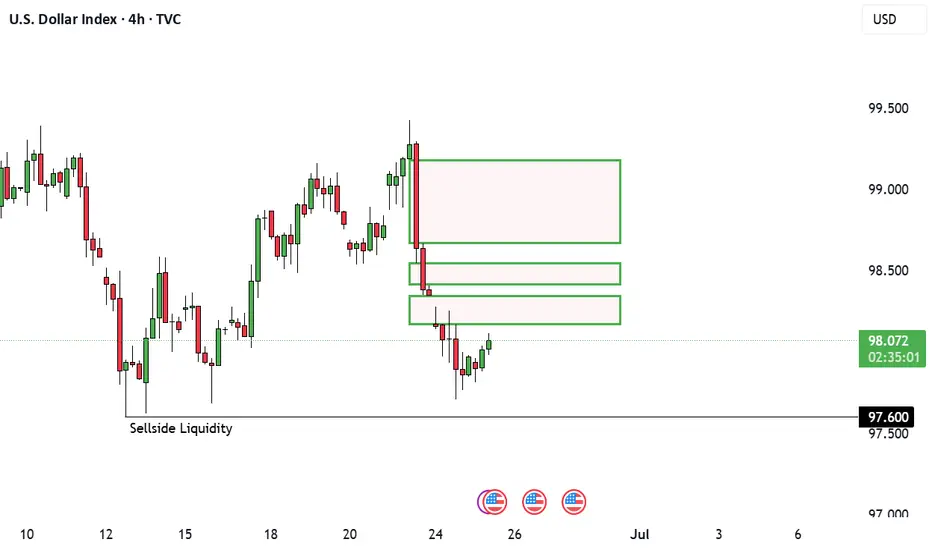
TIME FOR THE DOLLAR TO STRENGTHEN OR FURTHER WEAKNESS.So what are we lookin at? We have been looking at the weakest price in dollar yet.Yesterday we tested the yearly lows at 97.700 which we are using as current baseline. I will mark up that price range to use as our support. Geopolitical tensions are cooling off as Trump called for ceasefire between the two war torn nations but we still have lots of economic data flowing in. Most attention fall towards Fed chair Powell speech as this will shape up the direction of the dollar going forward as we head to a new month. Correction higher means USDJPY will rise as we are having a steady Yen currency. We saw the dollar fail to hold above 99.300 which is our nearest resistance level marked by a horizontal ray.So focus is on those two price levels so as to enable us find opportunities to trade.
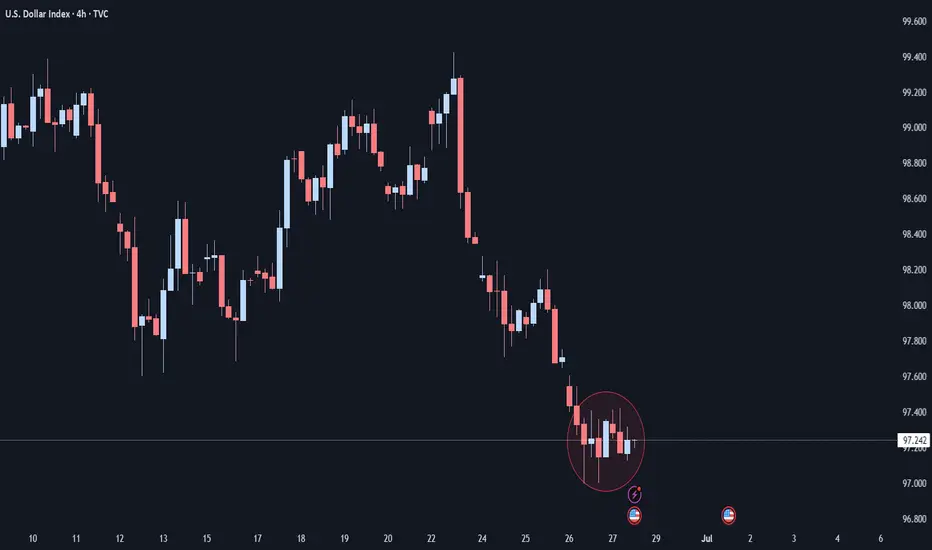
24th JuneTA: Many confluences for a bearish bias. Only confirmation needed for high probability price action is running (closing below 4H SL) on 1H. We have to exercise some caution, because price is still in the area of the monthly sweep. For a trade PA has to give us optimal behaviour.
News: Powell testifies at 10:00am. This could lead to a very quick move below the swept monthly low.
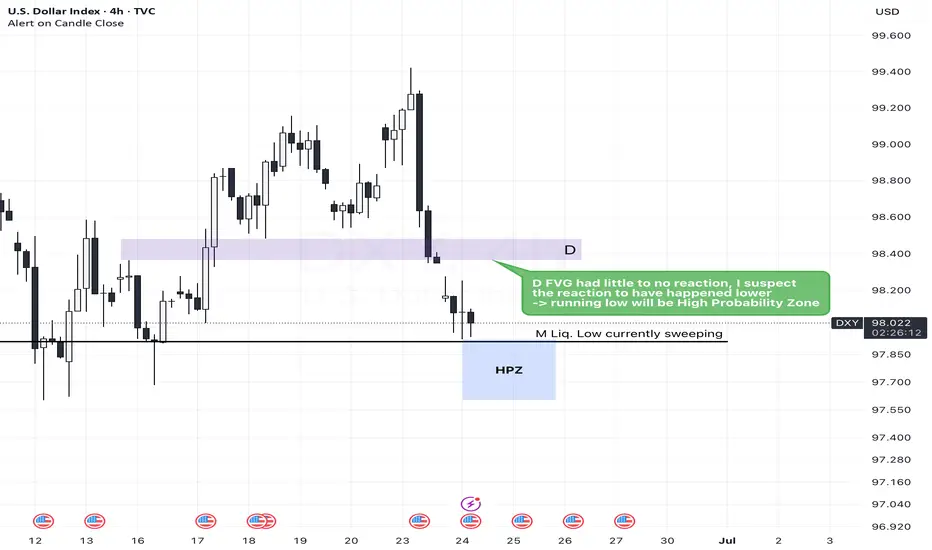
Price action Since the dxy failed to make a lower low and failed to break below but above this is a scenario that might play out
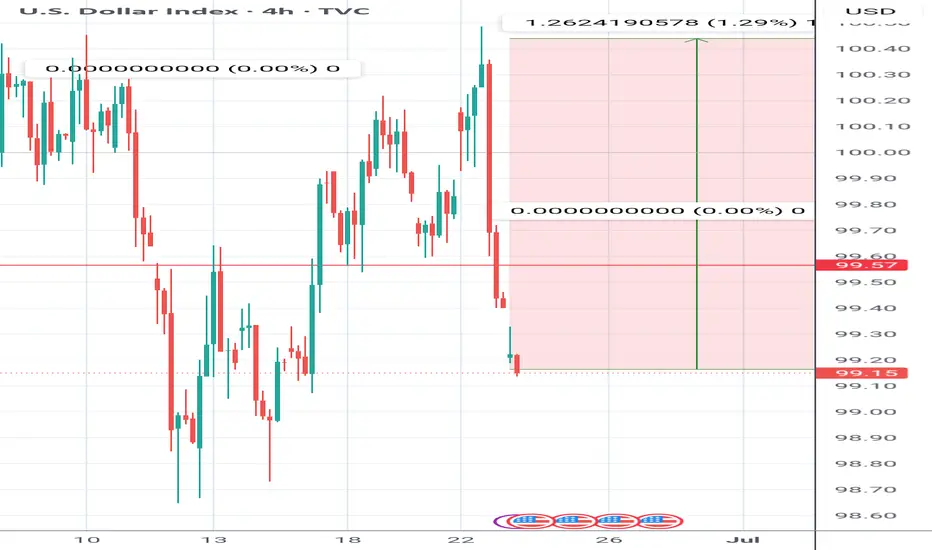
Dollar Back to bearishAmazing run on the liqudity I outlined over the weekend. We literally stabbed through with a few pips and massive rejection. This is all war related but you see how these levels get appreciated all the time.
Insane rejection after taking the liquidity

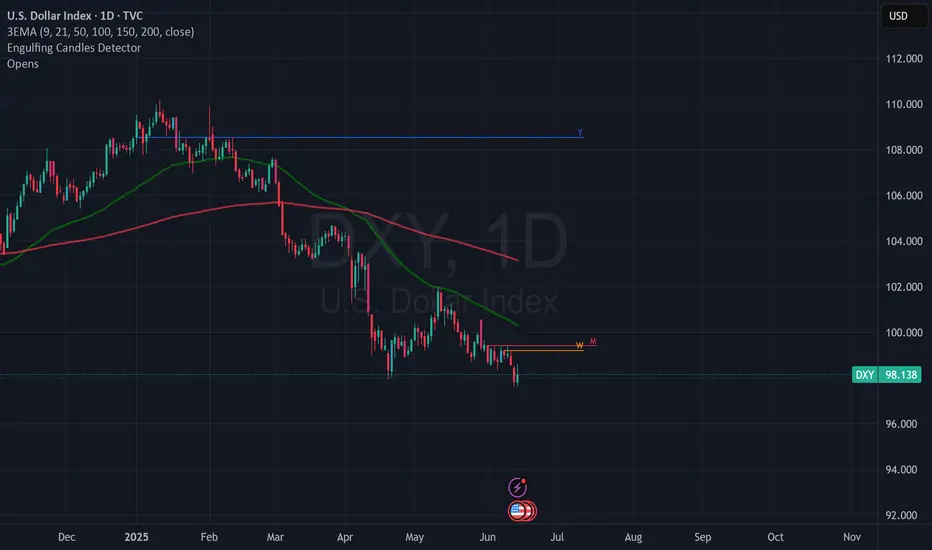
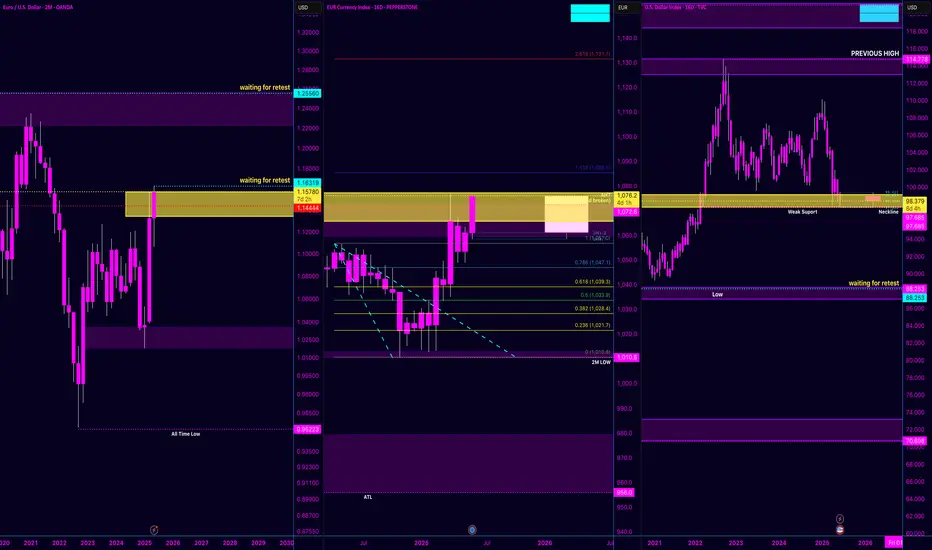
EUR/USD Macro Structure | Don’t Miss the Cycle ShiftAfter reviewing the 12M, 2M, and currency indexes — this isn’t just a bounce, it’s a potential macro reversal.
EUR/USD (2M Chart)
We’ve now got two Morning Star Dojis followed by a bullish engulfing — price is climbing steadily toward 1.16319 (neckline zone). If we break and retest clean, 1.25560 becomes a high-probability target. I view this as the neckline of a multi-year W-formation.
💶EUR Index (16D Chart)
The breakout has already occurred. Retest is happening now around the 1.057 zone. Fibonacci structure supports continuation, and volume confirms strength. If momentum holds, 1.085 – 1.130+ are valid extensions.
💵 USD Index (DXY - 16D Chart)
Meanwhile, the dollar is breaking down from a neckline around 98. If the 97–98 range gives way, we may revisit 88.253, confirming a shift in USD dominance.
🌐 Fundamental Alignment:
The Eurozone is pushing hard for digital transformation, with the ECB advancing legislation on the digital euro. Christine Lagarde has been vocal about blockchain innovation — and XRP’s involvement in cross-border integration is no coincidence.
🎯 Key Price Levels:
1.16319: Neckline (retest zone)
1.25560: Mid-term target
1.60195: Macro expansion (long-term, structure-dependent)
📌 I encourage all traders to zoom out and track structure across multiple timeframes. Sometimes the past holds clues to the future.
DXY: Target Is Up! Long!
My dear friends,
Today we will analyse DXY together☺️
The price is near a wide key level
and the pair is approaching a significant decision level of 98.274 Therefore, a strong bullish reaction here could determine the next move up.We will watch for a confirmation candle, and then target the next key level of 98.606 .Recommend Stop-loss is beyond the current level.
❤️Sending you lots of Love and Hugs❤️