$DXY Dollar stays weak but is it bottommed?Have not many ANY trades based on the US Dollar. Have not been convinced in either way, yet.
TVC:DXY has been weaker lately but not by much. Well, at least compared to its previous low.
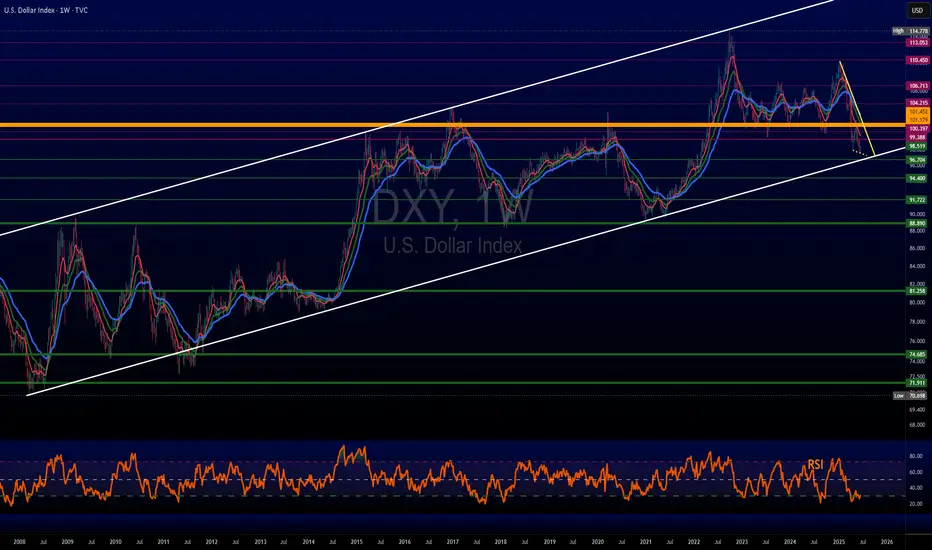
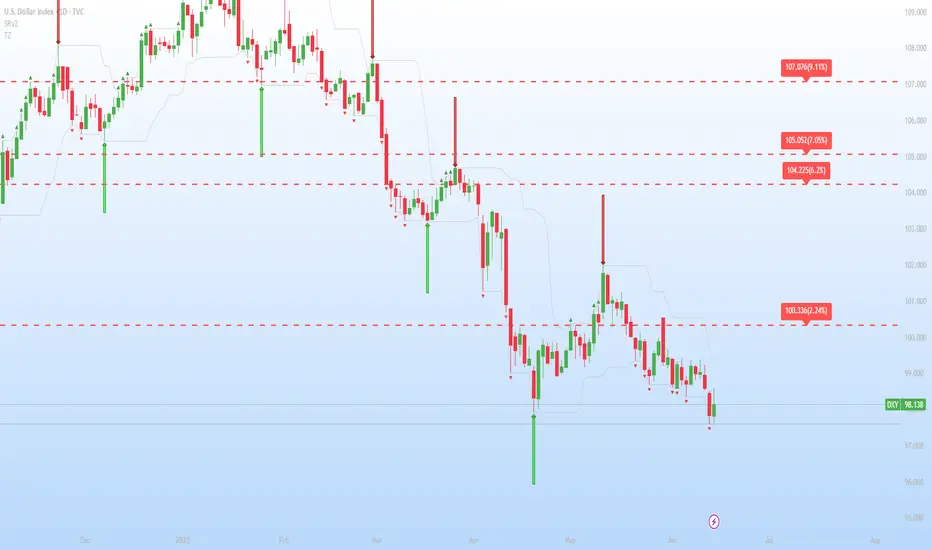
However, LONGER TERM we see it's biz as usual.
It is currently fairly oversold on the weekly chart & could be primed to change direction.
USDX trade ideas
DXY HOTD SetDXY HOTD Set
Unemployment Claims delivery lower expected.
H1 FTB, Weak Low.
H1 FVG, H1 QM
LOWER !!!
Let's see...

DXY: WILL WE GO LOWER.What's next from this point.
The month of June signals the start of quarter three based on the quarterly theory.Q3 is also referred to as the distribution phase or expansion.Given that information we expect to see expansion in majority of the market charts.
Our main focus is on DXY( Dollar index) which we pair against a basket of other currencies to get more insight on the foreign exchange market.We have witnessed a weak dollar in recent times. Weak is not an understatement as this is the poorest it has performed in recent years. The current prices were last seen during the covid era and has been used as baseline support for the pair in recent times.There have been a number of reasons for this and some carry more impact than others. Trade wars between the US and China have had the most impact and have been shaping up Trump's first year of his second term as president. Then lately we have witnessed the rising tensions in the middle east and feud between Islamic states and Israel.
We cannot foretell how lower we will go but we can keenly follow through the structures being broken and major price points being respected which will serve as indicators to the direction taken by the dxy.
With a calmer economic environment and support of strong economic data then we expect the dollar to rebound and propel higher. Not a full rebound but a play in the range between current lows and 102 which serves as the high for the previous two months.But if the current political turmoil persists and involvement of the US government in the middle eastern conflict then this will lead to an economic shakedown and an unpredictable dollar.
I hope this information will serve as a guide through this quarter. # SAFE TRADING EVERYONE.
Tariff uncertainty keeps weighing on the dollar.
Geopolitical risks in the Middle East have eased slightly amid signs of potential negotiations, prompting markets to shift their focus back to the upcoming FOMC and tariffs. Following talks with Canadian Prime Minister Carney, President Trump stated that a trade deal with Canada could be reached within weeks, and also confirmed that a trade agreement with the UK has been signed.
Meanwhile, markets are almost certain that the Fed will keep rates unchanged at the upcoming FOMC, with the probability priced at 99.8%. Wells Fargo expects the inflation outlook to rise due to the delayed impact of higher tariffs, projecting that the year-end median federal funds rate will climb by 25bps to 4.125%.
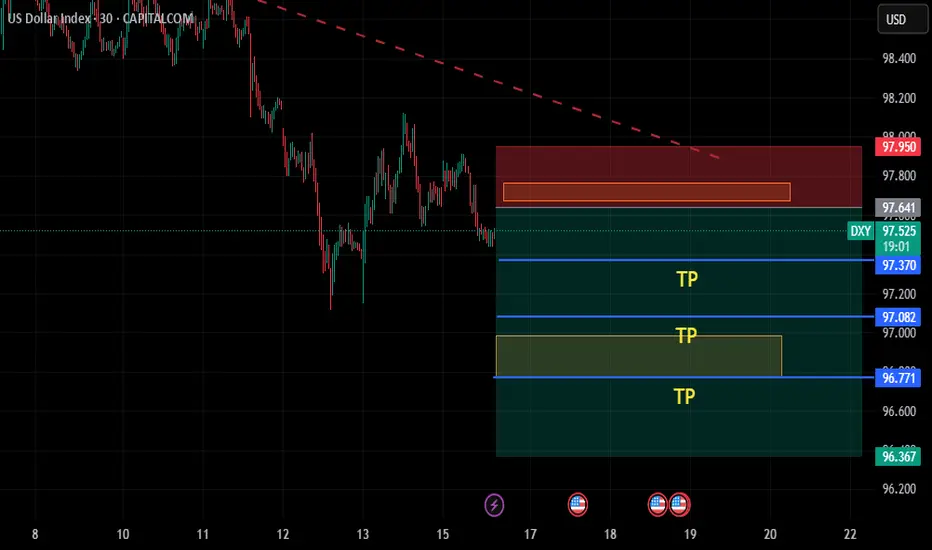
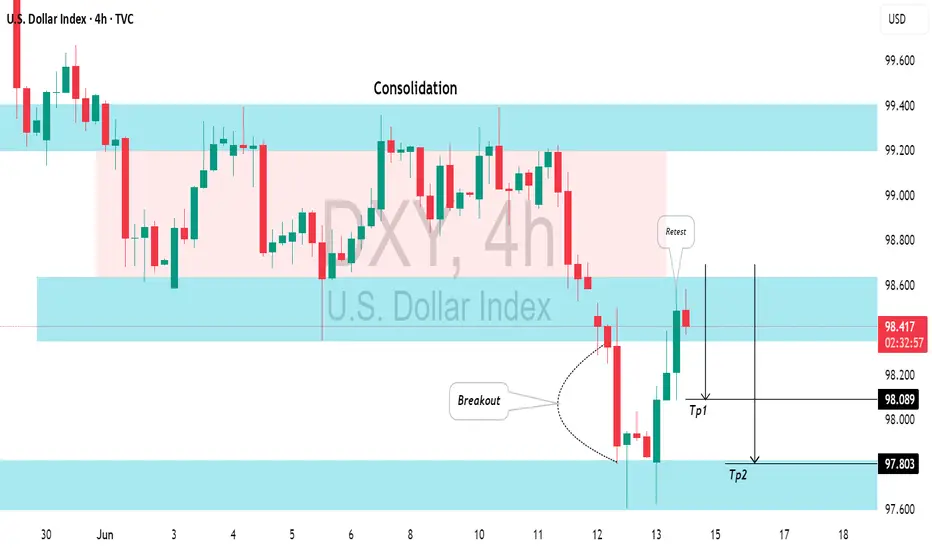
DXY is consolidating within the 97.50–98.50 range, remaining below both EMAs, which suggests a potential continuation of bearish momentum. If DXY breaks below the support at 98.00, the index may retreat to 97.50. Conversely, if DXY breaches above the resistance at 98.50 and the descending trendline, the index could gain upward momentum toward 99.00.

dxy for short 30m*The content on this analysis is subject to change at any time without notice, and is provided for the sole purpose of assisting traders to make independent investment decisions.
Central banks dominate calendar this week: Will Fed surprise?A pack of central bank decisions is set to drive market direction this week, with the Bank of Japan (Tuesday), Federal Reserve (Wednesday), Swiss National Bank (Thursday), and Bank of England (Thursday) all scheduled to announce their latest interest rate decisions.
The Federal Reserve will, of course, take center stage.
Despite President Trump’s continued call for a 100-basis point rate cut, Fed officials are widely expected to keep rates unchanged. However, softer-than-expected CPI and PPI data from last week may provide scope for a surprise.
The U.S. Dollar Index (DXY) is trading just above the key support zone at 98.00, a level not seen since early 2022. A decisive break below this area could open the door to further downside, potentially targeting the 96.00 region. However, a surprise from the Fed could trigger a rebound toward the 100.50–101.00 resistance band.
DXY for short 45m*The content on this analysis is subject to change at any time without notice, and is provided for the sole purpose of assisting traders to make independent investment decisions.

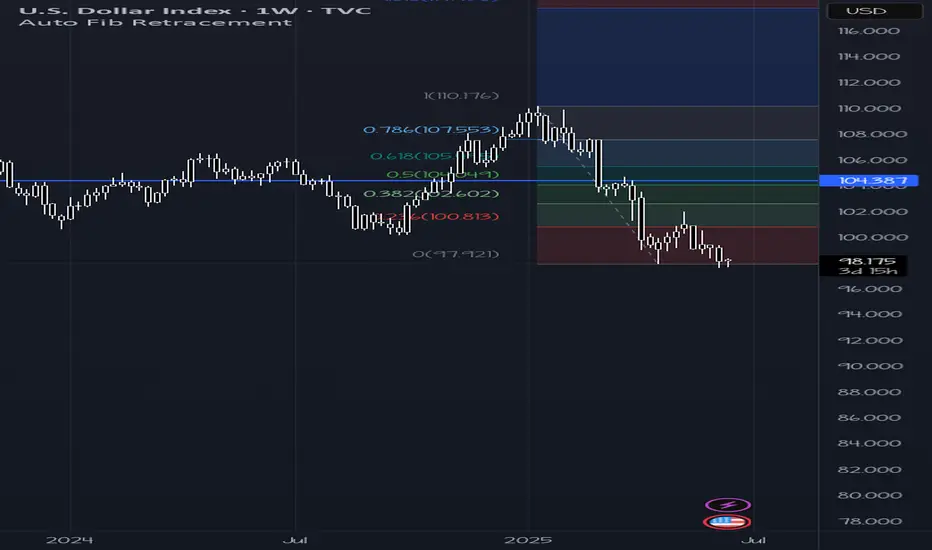
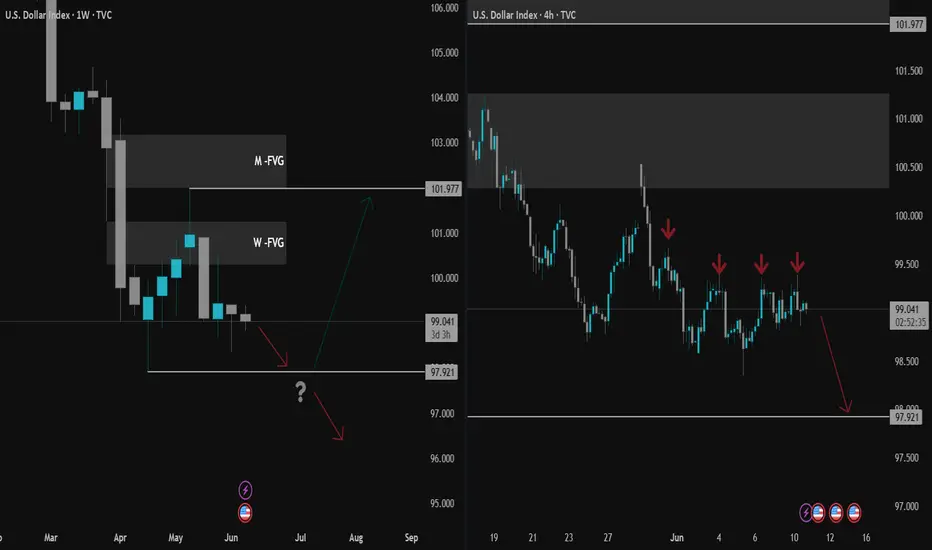
Follow up on DXY Short post from 2022The DXY follows Fib levels quite accurately on macro movements using the monthly chart. Both on retracement and extension. It has recently tagged the .618 retrace of the last bullish wave 5 movement that started its decline.
I would suppose it is close to completion of wave A of a ABC correction that will play out over the next several months. As it tagged the .618 mentioned above, it has also tagged the .786 extension of what is likely the c wave of the abc structure (of the larger A).
B wave trade to the upside has good probability now in my opinion. I took the trade this morning with a 3-1 RR in place. It could fall to the trend line which is fine, but if it breaks in earnest and closes a few sessions below then my stop would be triggered.
There was a bullish divergence prior to the April lows on the Daily TF and one is developing at the current lows. A close above 99.40 would confirm.
Long term the dollar is likely still going to weaken and go much lower as QE inevitably comes back into the market picture. TP levels are at 99.40, 100.54, 101.25 and 101.76.

DXY: Local Bullish Bias! Long!
My dear friends,
Today we will analyse DXY together☺️
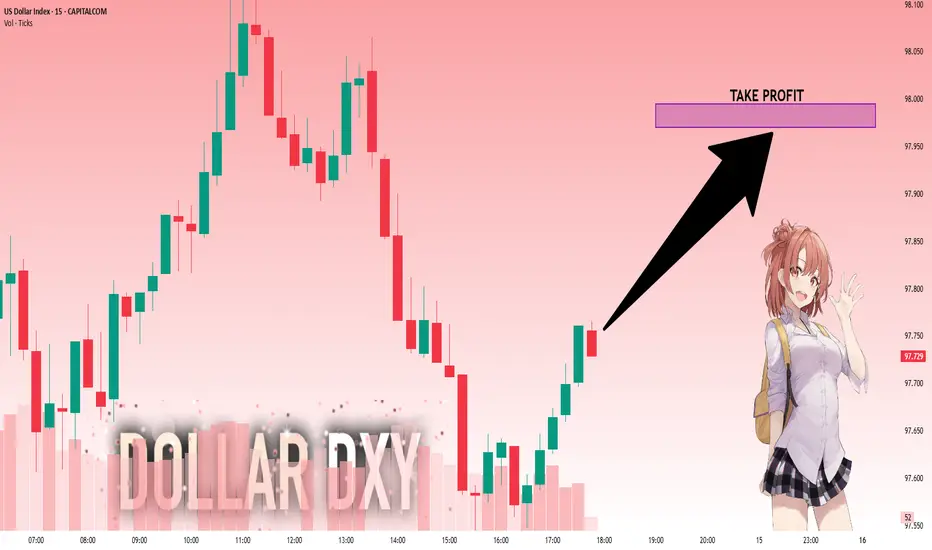
The market is at an inflection zone and price has now reached an area around 97.757 where previous reversals or breakouts have occurred.And a price reaction that we are seeing on multiple timeframes here could signal the next move up so we can enter on confirmation, and target the next key level of 97.970.Stop-loss is recommended beyond the inflection zone.
❤️Sending you lots of Love and Hugs❤️
DOLLAR INDEX (DXY): Bearish Again?!
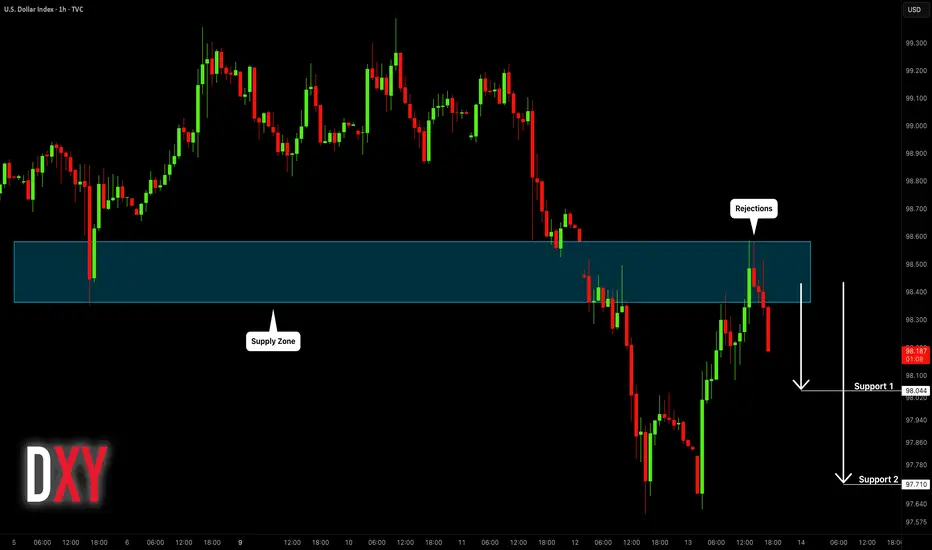
Dollar Index leaves clear bearish clues after a test
of a significant intraday/daily supply area.
I think that the market will continue falling at reach at least 98.04 level.
❤️Please, support my work with like, thank you!❤️
Reversal pattern on DXYPrice entered into the 12 months Fair value gap the second time and took out the old low there. This is called stop hunt, which is particularly significant because it happened inside a Higher timeframe Fair value gap. After this stop hunt came an invalidation of a Fair value gap (BISI). This price signinature cause the reversal of price ultimately... it is noteworthy that price had spent more than a month in the 12 Month Fair value gap. It is worth trading

US DOLLAR INDEX(DXY): Classic Bearish SetupI believe that 📉DOLLAR INDEX has a potential to continue falling.
The market has been consolidating in a wide intraday horizontal range, and the breakout below the range support is a significant bearish indicator.
Target levels are 98.08 then 97.80 support.
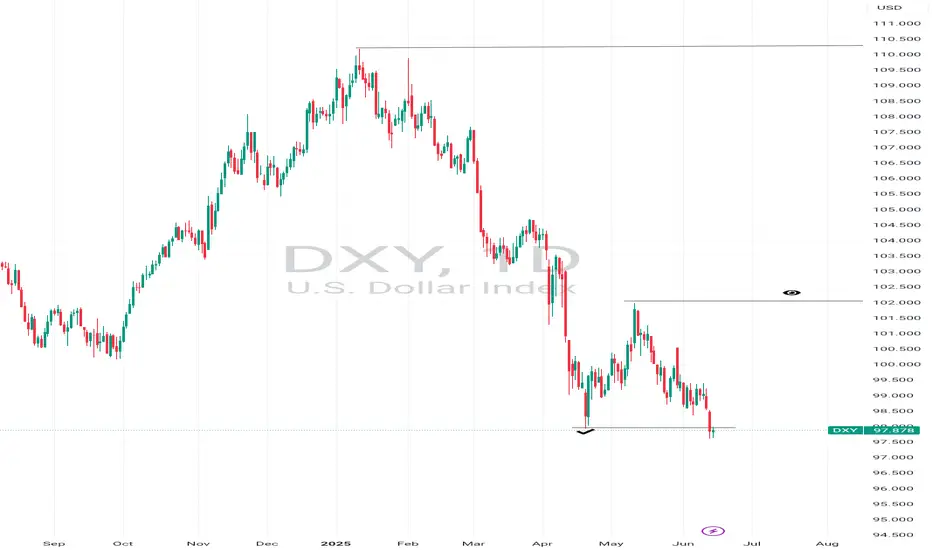
DXY ready for takeoffDXY seems to have reached the bottom for now, as planned within the marked red timezone. I expect a bullish run until October (blue timezone) with target around 111-113 USD, which corresponds to 2-2.5 stdv from this last manipulation leg lower. All areas marked in chart.

XAGUSD, XAUUSD, BTCUSD, ETHUSD & DXY Daily Trade SetupsIn this update we review the recent price action in Silver, Gold, Bitcoin, Ethereum & the Dollar Index and identify the next high-probability trading setups and price targets. To review today;s video analysis click here!

check the trendIt is expected that the correction trend will form up to the specified support zone, then there will be a possibility of a trend change. With the failure of the green resistance zone, confirmation of the bullish trend will be formed.
"Inflation Drops, Jobless Claims Jump — What’s Next for DXY, Gol🚨 Markets are shifting fast. CPI and PPI both came in lower than expected, while jobless claims hit an 8-month high. This triple data combo could mark a turning point for the US economy and the Fed’s next move.
In this video, I break down:
🔹 What soft inflation and rising unemployment mean for monetary policy
🔹 How DXY is reacting to weakening USD sentiment
🔹 Key levels for XAUUSD as rate cut bets rise
🔹 Where BTCUSD may head next with risk-on momentum building
📊 Technical + Fundamental insights — all in one session.
👉 Drop your thoughts in the comments and follow for more real-time market breakdowns!
#DXY #XAUUSD #BTCUSD #Inflation #FedWatch #TradingViewAnalysis #MacroUpdate #Forex #Crypto #Gold

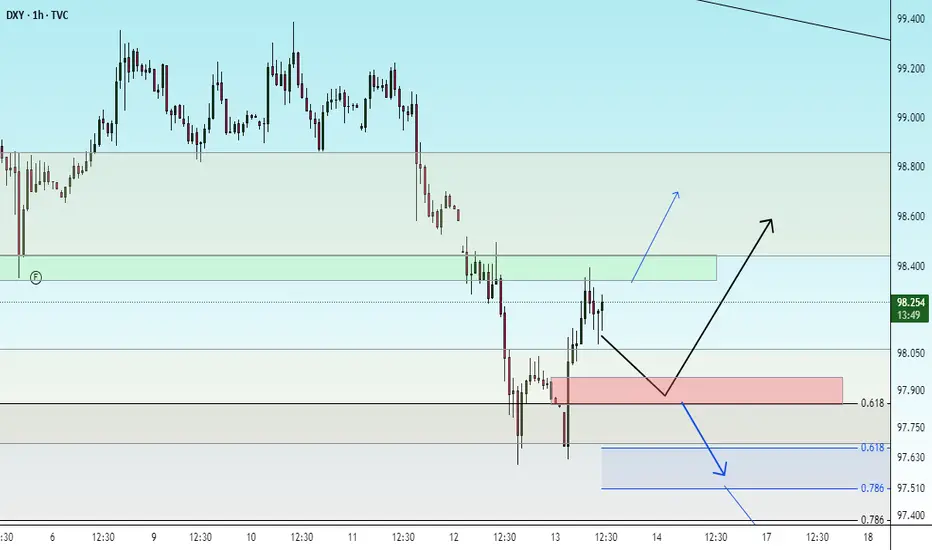
Stuck in the Zone: DXY Tests Balance Between 98 and 99Hello Traders,
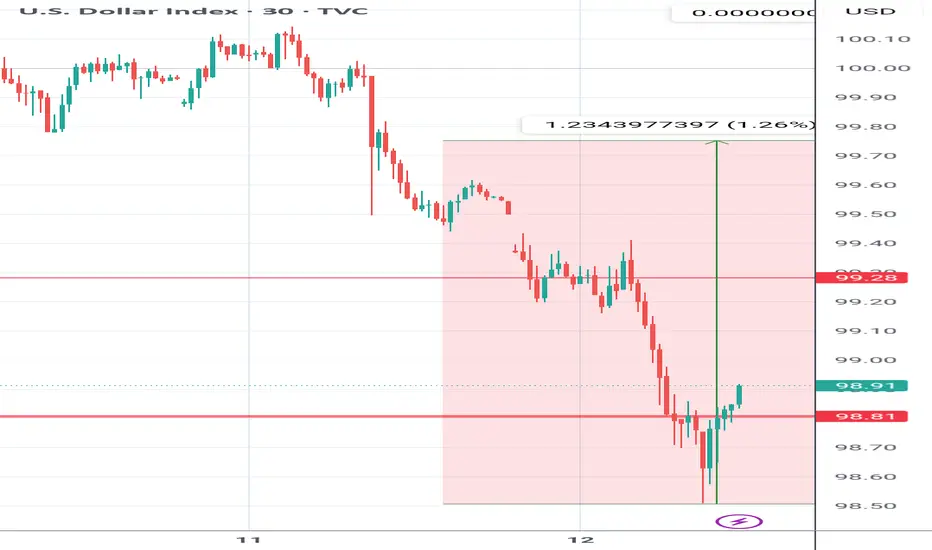
After a sharp and uninterrupted decline in the DXY, price found support at the 97.921 level. Sellers then regained control from the weekly bearish Fair Value Gap (W-FVG), pushing price back into the 99 zone.
In this zone, neither sellers nor buyers have managed to assert dominance—suggesting that these levels may act as a pause or balance point. Given the extended drop, a temporary correction could follow if buyers gain traction after one last push.
For now, the bearish USD narrative remains intact. With upcoming catalysts like China/US talks and tomorrow’s CPI release, a renewed move toward 98 is likely to accelerate.
Whether this leads to further selling or a corrective phase will be assessed afterward.
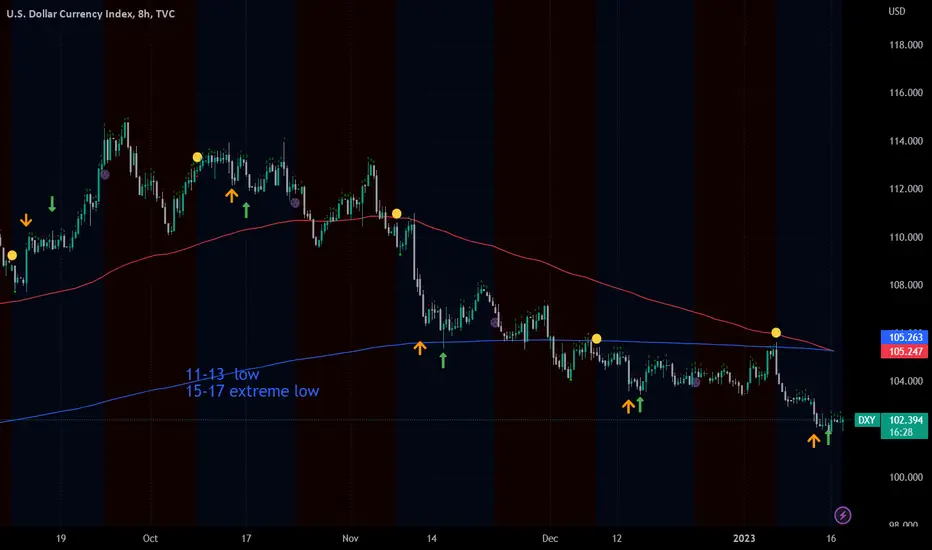
Interesting correlation with Moon cycles and DXYwe got the 200ema and 50ema crossing at the moment. I got a really interesting theory about the moon cycles shown there.
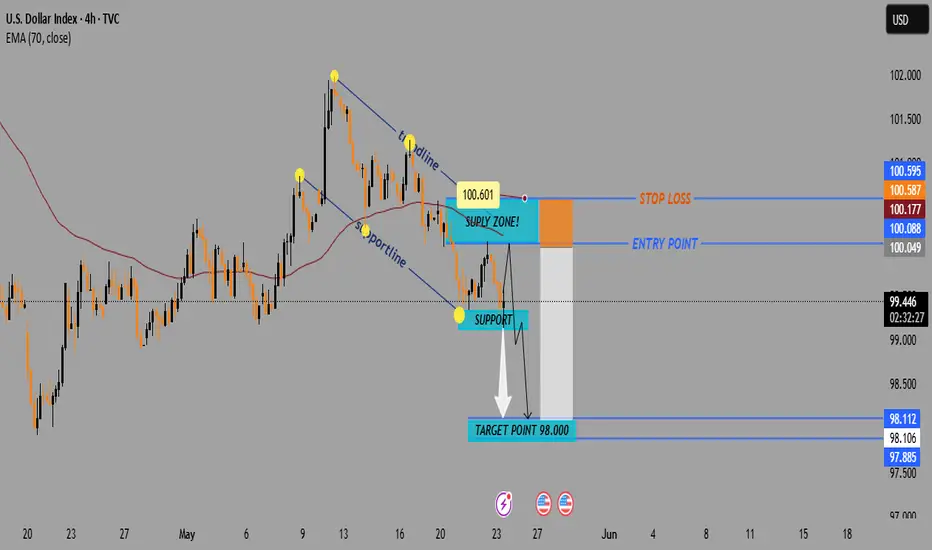
U.S. Dollar Index (DXY) Bearish Setup – Supply Zone Rejection & 🔹 Trend Overview
📊 Overall Trend: Bearish (Downtrend)
📉 Price is forming lower highs and lower lows within a descending channel.
🔻 Recently bounced off a support zone, now heading toward a potential pullback.
🔵 Supply Zone (Resistance Area)
📍 Zone Range: 100.049 – 100.601
🧱 Acts as a resistance block where sellers might step in.
📏 Confluent with EMA 70 at 100.178, strengthening its validity.
🔸 Trade Setup – Short Position
🟠 ENTRY POINT: 100.088
❌ STOP LOSS: 100.587 – 100.595 (Just above supply zone)
🎯 TARGET: 98.000 (With intermediate support levels)
📌 Support Levels
🔹 98.112 – First minor support
🔹 98.106 – Close-range confirmation
🔹 97.885 – Additional support zone
🟦 Main Target: 98.000
⚖️ Risk/Reward Ratio
🟧 Small risk above supply zone
🟩 Large reward to downside = Favorable R:R
📌 Summary
📈 Expecting a pullback into supply zone.
🧨 Look for bearish confirmation around 100.088.
🎯 Target the downside at 98.000 for profit.
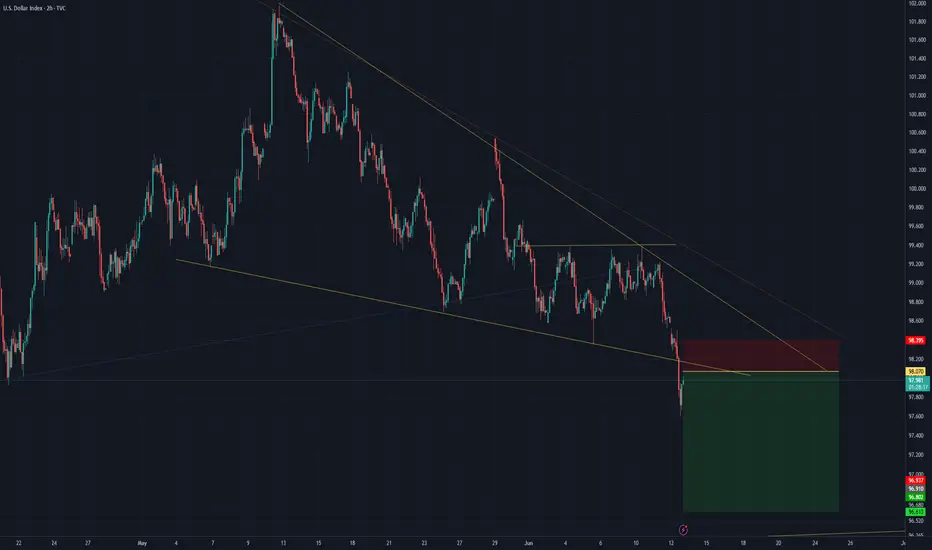
Bullish outlook Previous liquidity was taken , would be expecting a bullish move to ake out sell side
Buy Idea on Us Dollar Index (Dxy)Based on :
- Demand zone
- Pin bar Reversal
- Changing of correlation between dxy and zb1!
- cot report
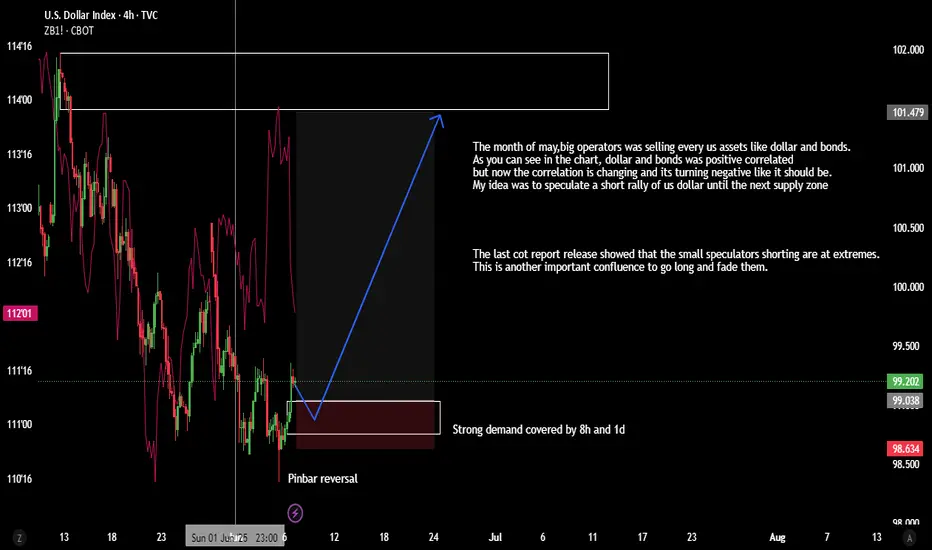
Price action Dxy broke structure above had to wait for this confirmation all that needed is sweep the liquidity above