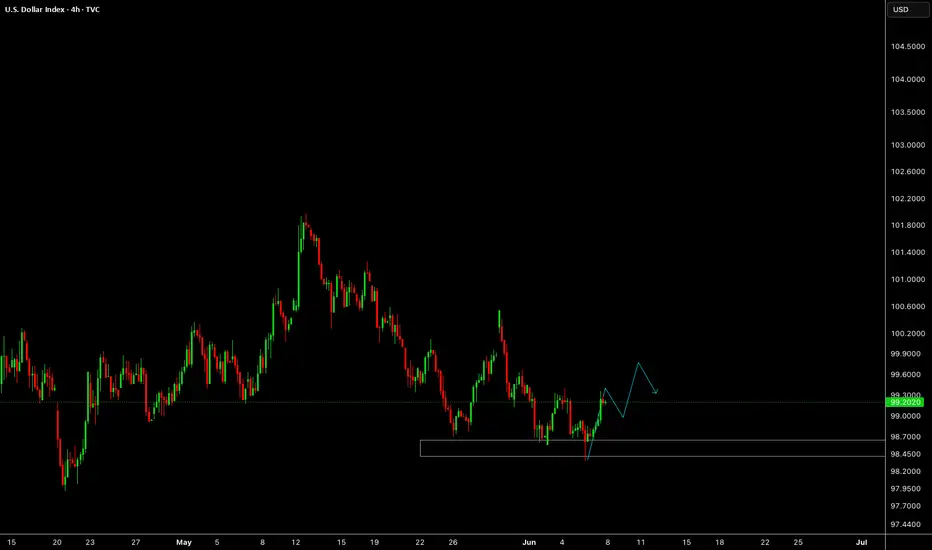
Possibility of uptrend It is expected that after some fluctuation and correction in the support area, a trend change will take place and we will witness the start of an upward trend. A break of the green resistance area will be a confirmation of the upward trend. Otherwise, the continuation of the corrective trend to the support areas will be possible.
USDX trade ideas
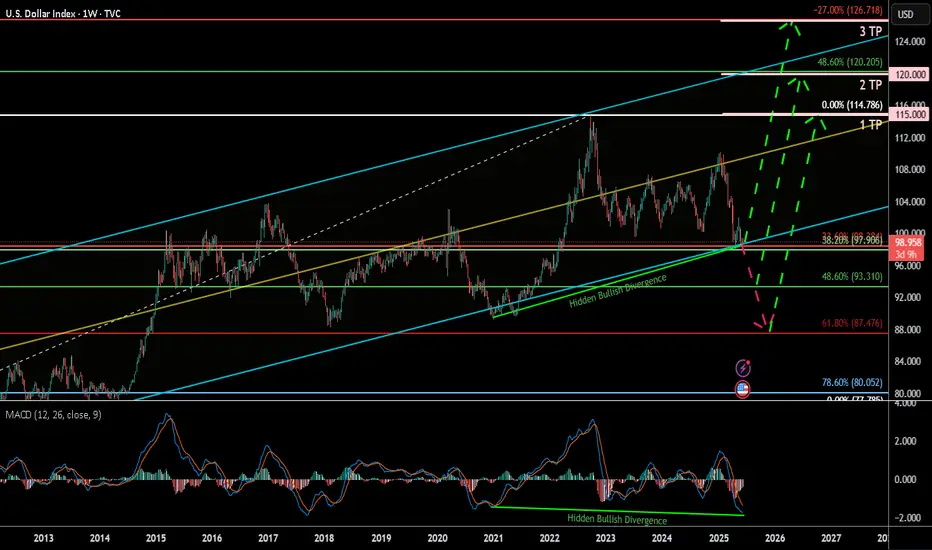
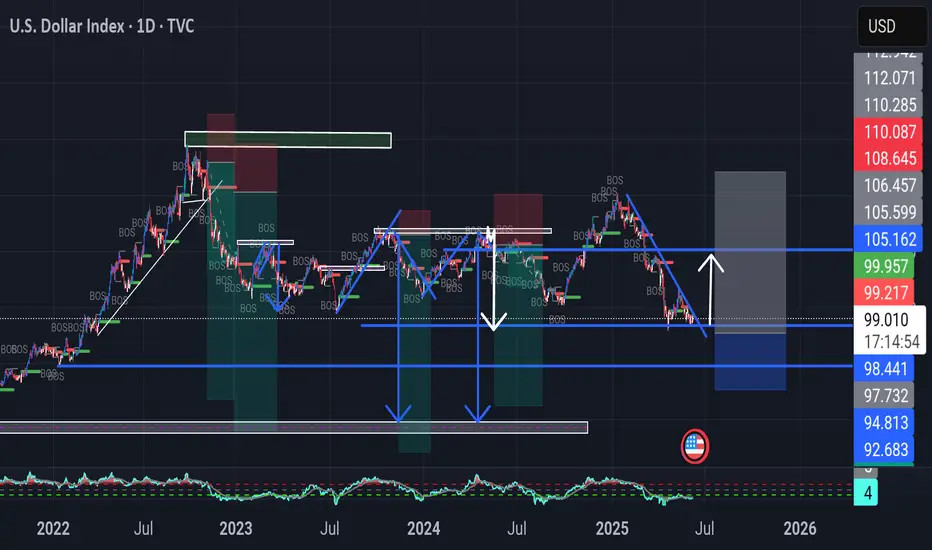
U.S. Dollar Index (DXY) Weekly 2025Summary:
The U.S. Dollar Index (DXY) has corrected down to the key 38.60% Fibonacci retracement zone and is currently showing signs of a potential bullish reversal, bolstered by a clear hidden bullish divergence on the MACD. This may signal a renewed rally toward key upside targets, especially if the 93.3–99.9 support Zone holds.
Chart Context:
Current Price: 98.864
Key Fib Support: 38.60% @ 99.906, 48.60% @ 93.310, 61.80% @ 87.476
Support Zone: 93.3–99.9 USD
Hidden Bullish Divergence: Observed both in 2021 and now again in 2025 on the MACD
Trendline Support: Long-term ascending trendline holding since 2011
Fib Extension Targets (Trend-Based):
TP1: 115.000
TP2: 120.000
TP3: 126.666
Key Technical Observations:
Fibonacci Confluence: DXY is bouncing from a strong Fib cluster between 93.310 and 99.906, historically acting as a reversal zone.
Hidden Bullish Divergence: Suggests potential upside despite price weakness.
Downtrend Retest: Price may revisit 93.3–87.4 before confirming full reversal.
Breakout Pathway: Green dashed arrows outline the likely recovery trajectory toward 114–126 range.
Indicators:
MACD: Showing hidden bullish divergence and potential signal crossover.
Trendline Support: Holding intact from 2021 low.
Fib Levels: Used for retracement and trend-based extension.
Fundamental Context:
Interest Rate Outlook: If U.S. inflation remains controlled and Fed signals future hikes or sustained high rates, DXY strength may persist.
Global Liquidity & Recession Risk: If risk aversion returns, the dollar may rise as a safe haven.
Geopolitical Risks: Conflicts, trade tensions, or BRICS dedollarization efforts may create volatility.
Our Recent research suggests the Fed may maintain higher-for-longer rates due to resilient labor markets and sticky core inflation. This supports bullish USD bias unless macro shifts rapidly.
Why DXY Could Continue Strengthening:
Robust U.S. economic performance & monetary policy divergence
U.S. GDP growth (~2.7% in 2024) outpaces developed peers (~1.7%), supporting stronger USD
The Fed maintains restrictive rates (4.25–4.50%), while the ECB pivots to easing, widening the policy and yield gap .
Inflation resilience and Fed hawkishness
Labor markets remain tight, keeping inflation “sticky” and delaying expected rate cuts; market-implied cuts for 2025 have been pushed into 2026
Fed officials (e.g. Kugler) emphasize ongoing tariff-driven inflation, suggesting rates will stay elevated.
Safe-haven and yield-seeking capital flows
With global risks, capital favors USD-denominated assets for yield and stability
Why the Dollar Might Face Headwinds
Fiscal expansion & trade uncertainty
Ballooning U.S. deficits (~$3.3 trn new debt) and erratic tariff policy undermine confidence in USD
Wall Street’s consensus bearish position.
Major banks largely expect a weaker dollar through 2025–26. However, this crowded bearish sentiment poses a risk of a sharp rebound if data surprises occur
barons
Tariff policy risks
Trump's new tariffs could dampen dollar demand—yet if perceived as fiscal stimulus, they could unexpectedly buoy the USD .
Synthesis for Our Biases
A bullish DXY thesis is well-supported by:
Economic and policy divergence (U.S. growth + Fed vs. peers).
Hawkish Fed commentary and sticky inflation.
Safe-haven capital inflows.
Conversely, risks include:
Deteriorating fiscal/trade dynamics.
Potential Fed pivot once inflation shows clear decline.
A consensus that could trigger a short squeeze or reversal if overstretched.
Philosophical / Narrative View:
The dollar remains the world’s dominant reserve currency. Periodic dips often act as strategic re-accumulation phases for institutional capital—especially during global macro uncertainty. A return toward 120+ reflects this persistent demand for USD liquidity and safety.
Bias & Strategy Implication:
1. Primary Bias: Bullish, contingent on support at 93.3–99.9 holding.
2. Risk Scenario: Breakdown below 93.3 invalidates bullish thesis and targets 87.4–80 zones.
Impact on Crypto & Gold and its Correlation and Scenarios:
Historically, DXY has had an inverse correlation to both gold and crypto markets. When DXY strengthens, liquidity tends to rotate into dollar-denominated assets and away from risk-on trades like crypto and gold. When DXY weakens, it typically acts as a tailwind for both Bitcoin and gold.
Correlation Coefficients:
DXY vs. Gold: ≈ -0.85 (strong inverse correlation)
DXY vs. TOTAL (crypto market cap): ≈ -0.72 (moderate to strong inverse correlation)
Scenario 1: DXY Rallies toward 115–126 then, Expect gold to correct or stagnate, especially if yields rise. Crypto likely to pull back or remain suppressed unless specific bullish catalysts emerge (e.g., ETF flows or tech adoption).
Scenario 2: DXY ranges between 93–105 then Gold may consolidate or form bullish continuation patterns. Then Crypto may see selective strength, particularly altcoins, if BTC.D declines.
Scenario 3: DXY falls below 93 and toward 87 Then Gold likely to rally, possibly challenging all-time highs. Crypto could enter a major bull run, led by Bitcoin and followed by altcoins, fueled by increased liquidity and lower opportunity cost of holding non-USD assets.
Understanding DXY’s direction provides valuable insight for portfolio positioning in macro-sensitive assets.
Notes & Disclaimers:
This analysis reflects a technical interpretation of the DXY index and is not financial advice. Market conditions may change based on unexpected macroeconomic events, Fed policy, or geopolitical developments.
DXY for short *The content on this analysis is subject to change at any time without notice, and is provided for the sole purpose of assisting traders to make independent investment decisions.
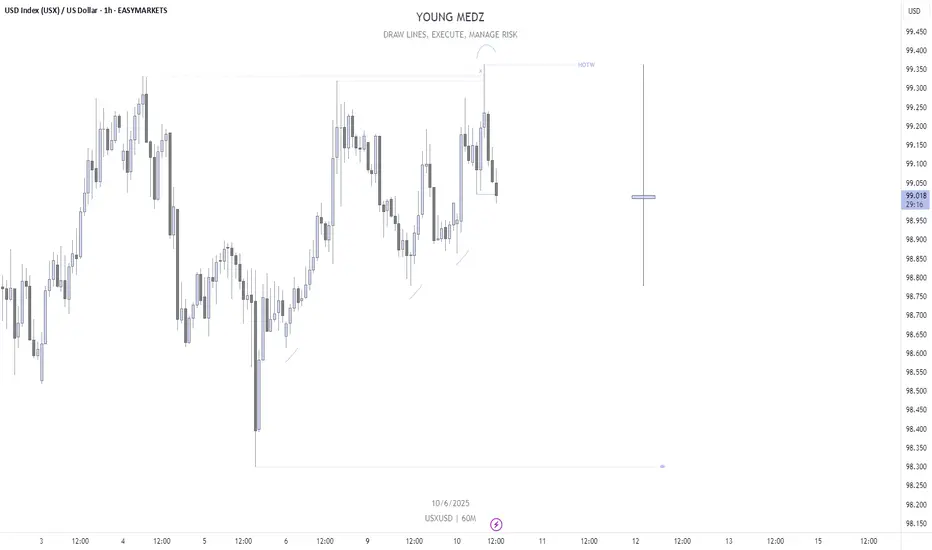
USXUSD Potential HOTWI would like to see a H4 BOS on USX.
IF we get the H4 BOS, I am looking at a CPI & PPI Delivery lower for DXY towards April Lows.
Let's see....
Dollar Still on TargetWe have come back to the NFP high and last weeks high again. Stabbed through them but still below the order block as higlited last week before NFP.
Looking for a run lower now on USD.

DXY Asia delivery to London Delivery Analysis DXY
Asia delivery to London Delivery Analysis
JUNE 10 FRAMEWORK
*Monday was a sell off
*Current range is premium
*Previous range is a discount
*Minor buy side taken in dealer range
*Sell side liquidity was taken at open of Asia
Is today a raid the equal lows and a buy day?
*Asia expanded rallied to equal highs
*Retraced to the session .618 and consolidated
*Previous session discount coming into London
*I suspect that dxy might make a high of the week today and attack the major buy side
Great analysis and great delivery. This is builds my confidence. Where I struggle to trust it when it comes time to react and make the trade I see rather than the noise I get stuck in.
Very happy price played out to the Asia expansion and the highs I felt at 5 am I suspected for price to take. Celebrate what you can and keep going.

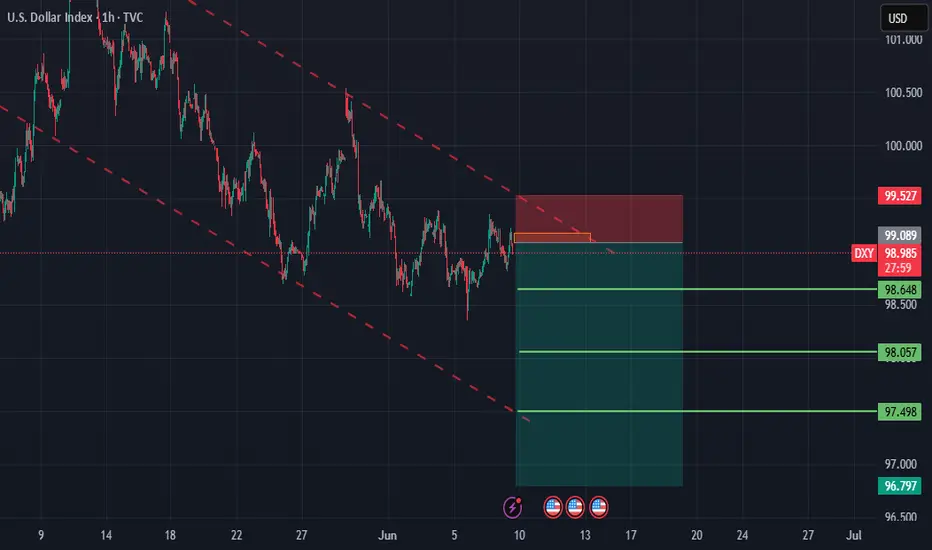
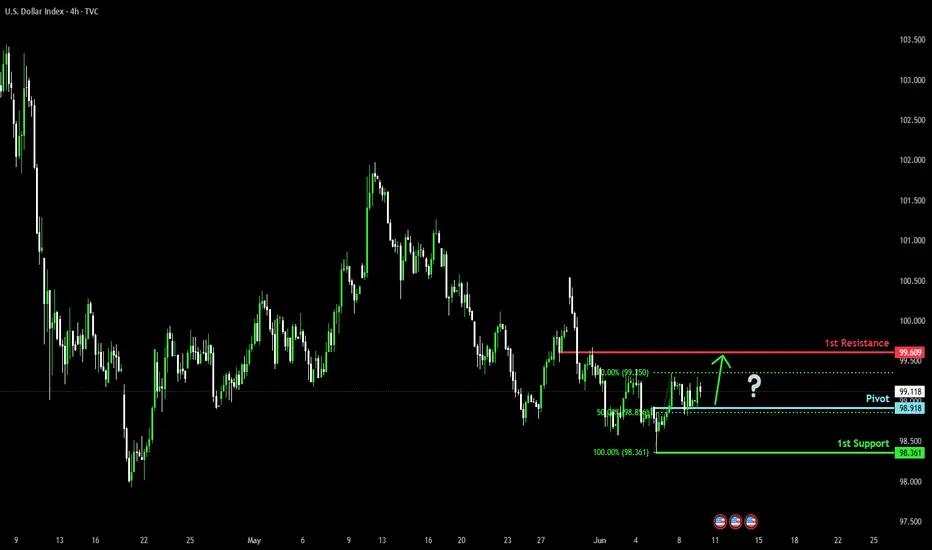
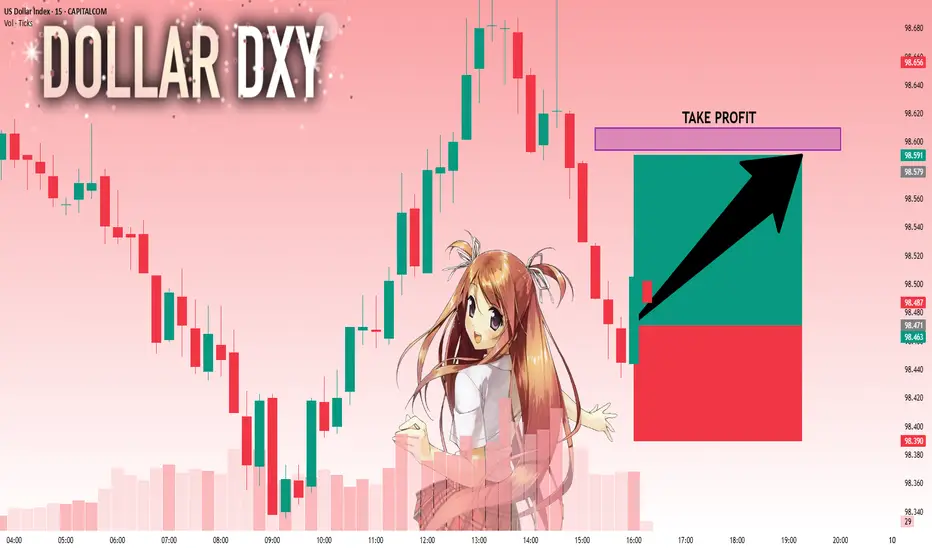
Bullish bounce?US Dollar Index (DXY) has bounced off the pivot which lines up with the 50% Fibonacci retracement and could rise to the 1st resistance.
Pivot: 98.91
1st Support: 98.36
1st Resistance: 99.60
Risk Warning:
Trading Forex and CFDs carries a high level of risk to your capital and you should only trade with money you can afford to lose. Trading Forex and CFDs may not be suitable for all investors, so please ensure that you fully understand the risks involved and seek independent advice if necessary.
Disclaimer:
The above opinions given constitute general market commentary, and do not constitute the opinion or advice of IC Markets or any form of personal or investment advice.
Any opinions, news, research, analyses, prices, other information, or links to third-party sites contained on this website are provided on an "as-is" basis, are intended only to be informative, is not an advice nor a recommendation, nor research, or a record of our trading prices, or an offer of, or solicitation for a transaction in any financial instrument and thus should not be treated as such. The information provided does not involve any specific investment objectives, financial situation and needs of any specific person who may receive it. Please be aware, that past performance is not a reliable indicator of future performance and/or results. Past Performance or Forward-looking scenarios based upon the reasonable beliefs of the third-party provider are not a guarantee of future performance. Actual results may differ materially from those anticipated in forward-looking or past performance statements. IC Markets makes no representation or warranty and assumes no liability as to the accuracy or completeness of the information provided, nor any loss arising from any investment based on a recommendation, forecast or any information supplied by any third-party.
DXY reversed upDXY reversed up.
I am assuming the dxy pattern as below, if there is a strong recovery in dxy then gold will fall sharply, I think gold to fall to 3000.

DOLLARThe relationship between the US dollar (USD), the 10-year Treasury bond yield, and bond prices is tightly interconnected and crucial for global markets.
1. 10-Year Bond Yield and Bond Price
Inverse Relationship:
As the yield on the 10-year Treasury rises, the price of the bond falls, and vice versa. This is because the bond’s coupon payment is fixed; when new bonds are issued with higher yields, existing bonds with lower coupons become less attractive, so their prices drop to compensate.
Recent Movement:
In May and early June 2025, the US 10-year Treasury yield rose from 4.18% to around 4.50%, a move of over 30 basis points, driven by strong economic data and expectations that the Federal Reserve will keep rates higher for longer.
2. 10-Year Bond Yield and the Dollar (DXY)
Direct Relationship:
Generally, when the 10-year Treasury yield rises, the US dollar strengthens. Higher yields attract foreign investment into US assets, increasing demand for USD.
Recent Example:
After the stronger-than-expected May jobs report, the 10-year yield jumped to 4.50% from 4.3% on thursday and the dollar index (DXY) also rose, reflecting investor expectations of prolonged high US rates and robust economic performance.
3. Bond Price and the Dollar
When bond prices fall (and yields rise), it often signals expectations for higher interest rates or inflation, both of which tend to support a stronger dollar as investors seek higher returns in USD assets.
Conversely, when bond prices rise (and yields fall), it can indicate economic uncertainty or expectations of rate cuts, which may weaken the dollar.
Key Takeaway
Rising 10-year Treasury yields lead to falling bond prices and typically a stronger US dollar, as higher yields attract global capital seeking better returns.
This dynamic is especially pronounced when strong US economic data or hawkish Fed expectations are in play, as seen in the recent market reaction to the robust US jobs report.
#dxy#dollar #gold

check the trendThe downtrend is expected to end at the current support level and an uptrend will begin. Otherwise, if the support level is broken, the downtrend could continue to the next support level.

DXY DownHaven't posted here in quite awhile, however just have been following trends watching bonds, stocks and bitcoin/gold. Looking at the DXY it appears to have fallen below the 100-101 level support and has since been rejected by that region on a weekly time frame. The support/resistance levels and trends line within have been charted for years and left unchanged. RSI is in the oversold territory but that can remain low for quite a long time, especially if the trend changes. I think the DXY goes to 90 over the next 6 months to 1 year.
Bullish for stocks, bitcoin, gold etc. Who is the fastest horse?
DXY: Target Is Up! Long!
My dear friends,
Today we will analyse DXY together☺️
The market is at an inflection zone and price has now reached an area around 98.471 where previous reversals or breakouts have occurred.And a price reaction that we are seeing on multiple timeframes here could signal the next move up so we can enter on confirmation, and target the next key level of 98.594.Stop-loss is recommended beyond the inflection zone.
❤️Sending you lots of Love and Hugs❤️
Is the dollar's a trend or temporary?📊Technical Analysis for:
🕒 Timeframe:
📈 General Trend:
🔍 Analysis Summary:
We are currently observing a rebound from the 98.400 level.
• Major Support Level:
• Resistance Level:
• Technical Indicators: We note that this correction is due to divergence.
🎯 Suggested Entry and Exit Points:
✅ Entry: Upon a breakout/rebound from
⛔ Stop Loss:
🎯 Targets:
• First Target:
• Second Target:
📌 Recommendation:
– It is recommended to wait for confirmation of the technical signal before making a decision.
🛑 Disclaimer:
This analysis is not considered financial advice or a direct buy or sell recommendation. Do your own research and carefully consider risk management before making any decisions.
📥 Do you agree with this analysis? Share your opinion in the comments!
🔁 Follow me for daily analysis. ICEUS:DX1! ICEUS:DX1!

US DOLLAR MARKET FORECASTA 30 minute change in price delivery bullish is within the 4 hour range.
I sense that the 4 hour higher low is in place, with price drawn to attack the high.

Dollar - Still going for TargetAs mentioned in the video on Friday 2 min before NFP. We could run higher on the dollar and i didnt want it to take out the 4 hour candle as shown here.
Go back and see the video for reference. Link below
We should head towards the Target now and im still bearish dollar. Very Bearish

Monday Market Outlook Get ahead of the markets with this week’s essential macro insights! In this session, we break down the most impactful upcoming events affecting DXY, XAUUSD, and BTCUSD — including the FedWatch Tool outlook, yield curve shifts, and how to interpret changing rate expectations. If you want to understand how the macro backdrop could influence your trades, this video is a must-watch.
👉 Learn how to spot opportunities before the move happens.
📉 Rate cut? 📈 Rate hike? 📊 We’ll show you what the market is really pricing in.

Eur, Gbp & DXY Dynamics: We have reached fair valueWith equilibrium being established we are stuck in an internal liquidity range. We do expect the trending targets to be hit although we are seeing a preliminary shift in structure.
If there was anything I missed in this analysis please let me know. Share this with anyone who may be interested 🙏🏾

DXY next trading set upHi traders I decided to share with you DXY n next possible move that can take place anytime as you can see we've been dropping and it's most about time for recovery in order to simple follow my set up don't play short games and be controlled by small move that's why you fail,you cant come with H1 N H4 analysis while am showing a big picture of the trend the reason why I don't loose trade easily is because I follow right trend not spikes or short move,that's why I laugh sometimes wen I see horrible graphs in short time frames but I've realized that they cant see what am seeing and I must just leave them in peace until they understand how market moves,I did 5 ninets n 25 minets all less than daily but they always wrong n just change meaning they are weak n fake, real shit daily n weekly you are following right trend the only way is to generate liquidity into position and they will give you right point of your entries,if you are addicted into gambling it might take you years to realize how easy it is to follow the trend,first identify the trend you want to trade know if it's uptrend or down trend or range check how it moves in bigger time frame,am not gonna entertain 5 minets trade while am using weekly n monthly time frame we are not seeing the samething,just start to position yourselfs from here until 96 if possible but is likely to gain in few days but that double buttom it looks nasty n not strong soo a bit manipulation n you'll see dxy raising again this is not a gambling my friends were you get money by mistakes you get it by knowing how to follow the system I wish you all profitable week,I will never give you entries soo that you can learn to generate liquidity into positions I do not control the market soo telling you straight point what if market won't reach those point it's useless,soo best is to shows point of interest you counter them n jump in why should I supposed to lie n talk many things that it won't even happen lols,traders I wishy you all the best n profitable week be blessed.
Bearish continuation?US Dollar Index (DXY) is rising towards the pivot and could drop to the 1st support.
Pivot: 100.54
1st Support: 98.32
1st Resistance: 101.78
Risk Warning:
Trading Forex and CFDs carries a high level of risk to your capital and you should only trade with money you can afford to lose. Trading Forex and CFDs may not be suitable for all investors, so please ensure that you fully understand the risks involved and seek independent advice if necessary.
Disclaimer:
The above opinions given constitute general market commentary, and do not constitute the opinion or advice of IC Markets or any form of personal or investment advice.
Any opinions, news, research, analyses, prices, other information, or links to third-party sites contained on this website are provided on an "as-is" basis, are intended only to be informative, is not an advice nor a recommendation, nor research, or a record of our trading prices, or an offer of, or solicitation for a transaction in any financial instrument and thus should not be treated as such. The information provided does not involve any specific investment objectives, financial situation and needs of any specific person who may receive it. Please be aware, that past performance is not a reliable indicator of future performance and/or results. Past Performance or Forward-looking scenarios based upon the reasonable beliefs of the third-party provider are not a guarantee of future performance. Actual results may differ materially from those anticipated in forward-looking or past performance statements. IC Markets makes no representation or warranty and assumes no liability as to the accuracy or completeness of the information provided, nor any loss arising from any investment based on a recommendation, forecast or any information supplied by any third-party.

DXY Weekly ForecastDXY Weekly Forecast
A Message To Traders:
I’ll be sharing high-quality trade setups for a period time. No bullshit, no fluff, no complicated nonsense — just real, actionable forecast the algorithm is executing. If you’re struggling with trading and desperate for better results, follow my posts closely.
Check out my previously posted setups and forecasts — you’ll be amazed by the high accuracy of the results.
"I Found the Code. I Trust the Algo. Believe Me, That’s It."

Skeptic | This Week's Most Profitable Setups: Gold, Forex & SPX!hey, traders, it’s Skeptic ! 😎 Our last watchlist was straight fire, racking up some sweet profits with tons of setups. This week’s looking just as juicy, so stick with me to catch these killer opportunities! 🚖 Welcome to my Weekly Watchlist, where I lay out the markets I’m trading with active triggers—forex pairs, commodities, and CFD indices. No FOMO, no hype, just pure reasoning to keep your trades sharp. Let’s jump in! 📊
DXY (Dollar Index)
Let’s kick off with DXY, ‘cause getting this right makes analyzing other indices and pairs a breeze. After multiple failed attempts to break support at 98.8 , it’s still ranging. This is a monthly support, so confirmation of a break needs to come on a monthly or at least weekly chart. Personally, I’m betting it’ll bounce from here. A break above 99.36 gives early confirmation of a rise, but the real deal is breaking resistance at 100 —then you can short USD pairs like EUR/USD . If 98.8 gives way, look for longs, but this monthly zone is tough, so expect some chop! 😬
EURX
EURX seems to be in a weak upward channel. A break above 1063 could push us to 1071 . On the flip side, breaking the channel’s midline at 1058 might drag us to the floor or even support at 1049 . So, our EURX game plan is clear.
Watchlist Breakdown
Let’s hit the watchlist, starting with XAU/USD (Gold ).
Triggers here are tricky, but I cloned last week’s downward channel and placed it above—this trick often gives us solid setups. If we bounce off the channel’s floor, a break above resistance at 3340 opens a long. For shorts, I don’t have a trigger yet since the market’s already dumped. If we form a 1-hour range, a break below its floor could trigger a short targeting 3249 or the previous channel’s midline.
Now, XAG/USD (Silver)
—no triggers this week. Our long trigger from last week’s analysis at 33.68 smashed it, spiking 8%! 🎉 That’s a lock even Bitcoin traders would drool over, but in Skeptic Lab :)
Next, EUR/USD.
The long trigger is set at a break above resistance at 1.14555 , which lines up with the DXY support break I mentioned. Heads-up: this trade won’t be easy. Reduce risk ‘cause we’re in for a big fight at this level—wild swings and tight stop losses get hunted fast. Stay sharp! 😤
GBP/USD Update
My GBP/USD long got stopped out, so let’s break it down. I went long after a resistance break, with crazy uptrend momentum and RSI hitting overbought (which I see as a long confirmation). Everything looked dope except my stop loss placement. The prior move was so sharp that my stop had to be wide, tanking my R/R. It hit the box ceiling target but then dumped, nailing my stop. Lesson? Either jump in before the main momentum or let the move play out and skip it. Mid-move entries with big stops? Recipe for pain...
SPX 500
Our SPX 500 long trigger from breaking the box ceiling already fired and seems to have pulled back. My target’s 6128.55 , and my open position has a stop loss below 5952.51. If you missed last week’s trade, a new trigger could be a 1-hour resistance break at 6014.20 . If you’re already long, no need to double up.
Final Note
my max risk per trade is 1%, and I suggest you stick to that or lower. I’m cooking up a Money management guide soon, diving deep into why it’s the key to outpacing 90% of traders and boosting your odds of consistent profits. Stay tuned! 🚨 No FOMO, and have an awesome week!
💬 Let’s Talk!
If this watchlist lit a spark, hit that boost—it means a ton! 😊 Got a pair or setup you want me to tackle? Drop it in the comments. Thanks for rolling with me—keep trading smart! ✌️

DXYWe are expecting Dollar strength this week short term.
Disclosure: We are part of Trade Nation's Influencer program and receive a monthly fee for using their TradingView charts in our analysis.