RECESSION IMPENDING?(PART2)FED RATES SUPERCYCLE|PREMIUM ANALYSISFED INTEREST RATES( FRED ) - Extension(PART 2) to the US (SPX) Sectors Technical Analysis Series - 18th of August 2019 (9-10 Minute Read)
Everyone complains about the FED rates. That's our only job, it seems . Judging by his tweets, no one has been more eager to express their dissatisfaction, than Pres. Trump (bit' of sarcasm) .
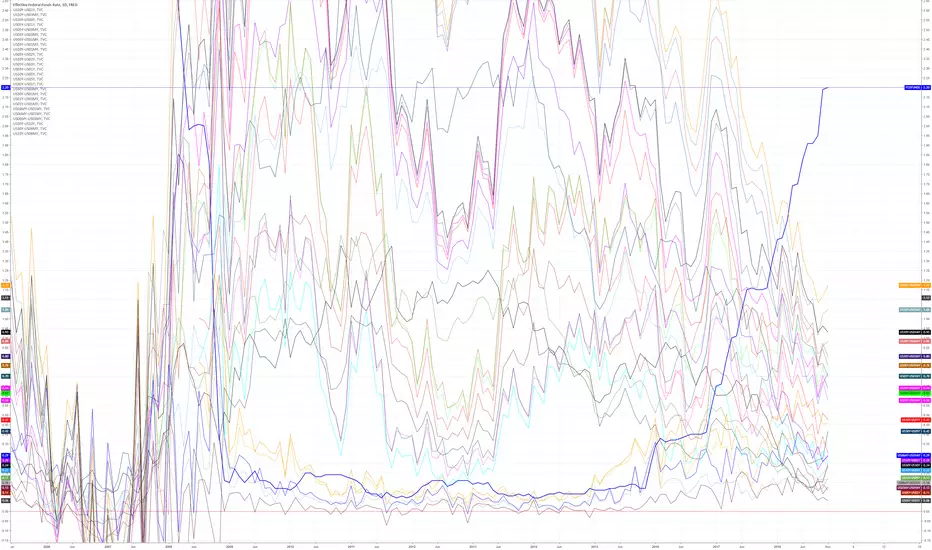
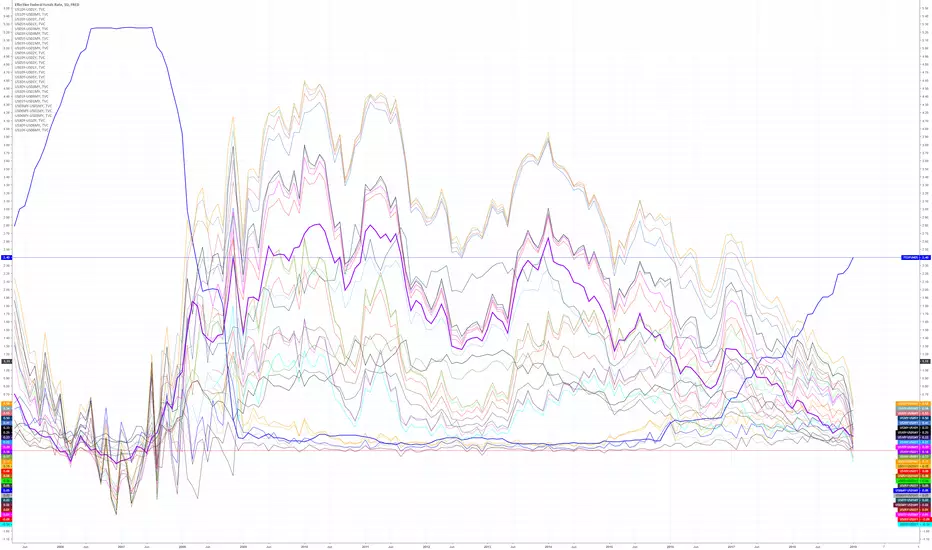
This is Part 2 - of an extremely complex(Premium) cycle analysis . The purpose of this chart is to showcase the historical relationship between FED Rates and economic cycles . In order to understand this analysis; in depth historical knowledge of the FED's Monetary Policy is necessary (besides my personal need, of my work actually being understood properly).
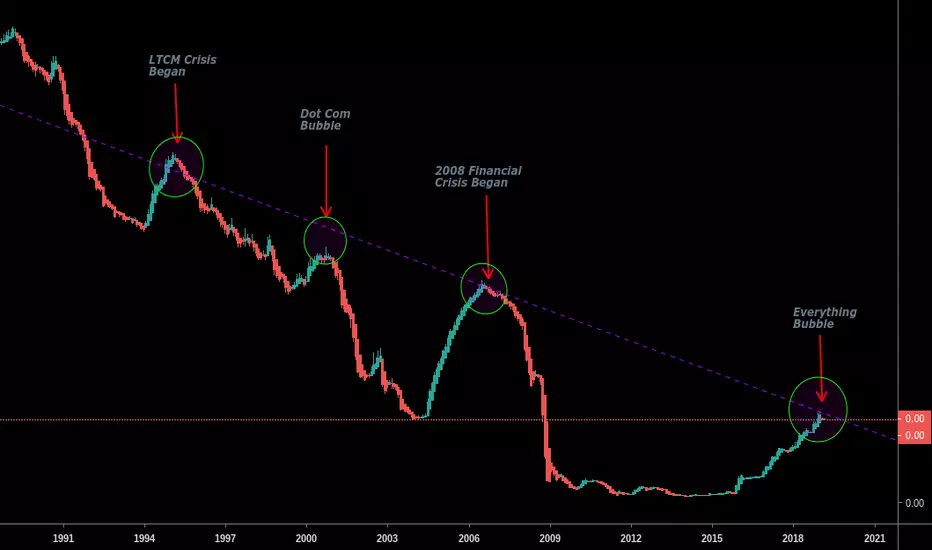
Now, let's start with a chronological setup(Blue #number labels) that will be used to analyse rates. The beginning of the Bullish Cone was the Impulsive Intermediate Wave 1(in the late 50's ). By the early 70's and the occurrence of the OPEC crisis ; a supercyclical Wave 1 and 2 were formed. Wave 2 gave the bottom support of the Bullish cone in FED interest rates. As it's labelled on the chart the importance of the bullish cone is that it signifies the Peak of Capitalism .
The implications of this peak were a consumption driven economy, combined with excessive cycle volatility. At the same time this was the Fixed Incomes' Golden Age ; as practically every American individual was told that buying a house is the utmost important aim in life. Obviously at the time, this was quite logical, since home equity is an effective way to protect your wealth from inflation. The Fibonacci Circles used on the chart show the pattern of cycles that formed the Bullish Cone. Each end of a circle forms a trough and consequently a peak in a given cycle time span.
What Changed ? - Our understanding of Monetary policy changed (Credit to Barro and Gordon,1983) . The early 80's were extremely turbulent years with immensely high inflation . The end result was an exit out of the old equilibrium and a break-off from the Bullish Cone, into a new Equilibrium . The trend that formed the New Equilibrium in general economic terms is referred to as the "Great Moderation" . This is why the chart is divided with a cross, centered around Q2,1984 that was the start of the "Great Moderation". The occurrence of this event can be observed in the clear difference with the synch of the sin-line with the different cycles between the 2 periods. The new equilibrium is extensively supported by the rise of Globalization . In effect this is the first part of this analysis.
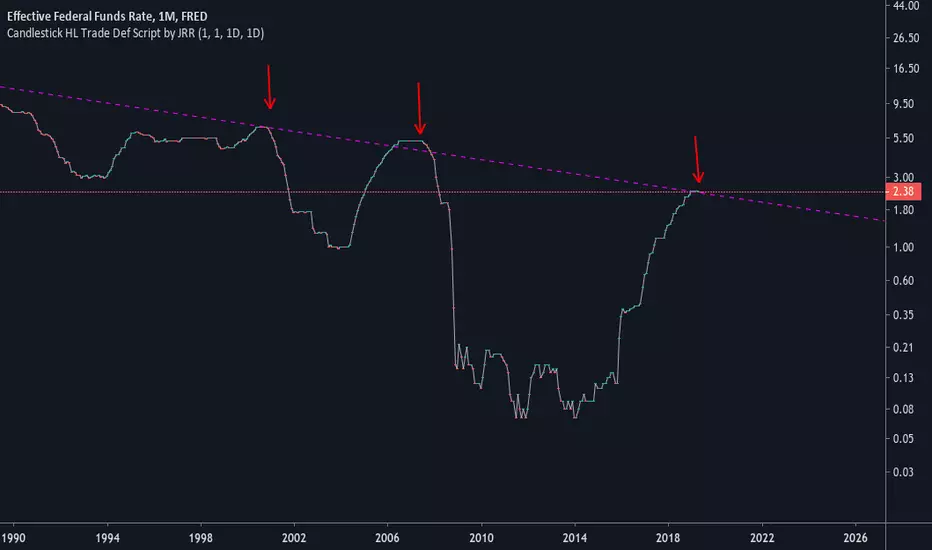
Part 2 of this analysis is, what started this idea with the downward trending wedge ( Pitchfork ) in interest rates since the "Great Moderation". This was my primary sketch from a week ago.
Just so, I am not boring and do not repeat myself- I will not discuss the labels post 84' neither on the sketch or the chart. What is important in the current interest rate environment are the implications of the prolong duration of these extremely low rates . Hence, the chart is divided between 2% and below(RED) and above Green . The rationale behind this division, is that there are plenty of fundamental issues that appear if rates are lower than 2%(in addition to low growth/inflation). Unfortunately we've practically been in such environment for about 9 years now . Implications of this environment can be credited to James Bullards (2016) "Perma-Zero" paper.
One of the major issues is the trade-off between debt and equity . In the current environment stocks on average are trading 14-17 x(times) their earnings (x17 P/E) . We have an enormous amount of laughable companies available to stay in business with continuously negative EPS . One example that I can think of is WeWork Ltd . (In order to spread awareness, I need your help on this one- comment as many companies that come on you mind that fit this description) . This is a healthy and necessary discussion to have . Low rates do stimulate innovation, but the inevitable cost is that due to competition- the majority of these startups become unproductive and hardly ever profitable.The best description that I think it fits these worthless capital soaking "Business Ideas" is to classify them as Malinvestments .
Finally, what's the conclusion of this extensive FED rates analysis? - Borrowing Capital should have some baseline cost (2-4% would be quite an optimal range) . As discussed in Link #1 and Part 1 of this series based on the VIX that analysed the probability and timing of the next recession; - I t is nearing . Unfortunately, we will not have rate cuts as a tool to stimulate the markets. Whether it is obvious or not; we are quite overdue for a recession . This can also be observed from the sin-line at the bottom right corner; implying a bottom of the cycle in the next 2-3 years . Essentially, this is the reason- why I have dedicated much of my time to at least attempt to provide a series of ideas in my content, that include proper interpretation of the most crucial financial and economic factors .
This idea concludes the extension to the SPX Sector series. Hope you enjoyed it and found it useful.
|Step_Ahead_oftheMarket|
>>I do not share my ideas for the likes or the views. This channel is only dedicated to well informed research and other noteworthy and interesting market stories.>>
However, if you'd like to support me and get informed in the greatest of details, every thumbs up or follow is greatly appreciated !
I do realize that my charts are quite hard to be understood, mostly because they are labelled to the smallest and extremest of details. If there are any poor understandings of the labels, I'd be able to answer any additional questions in the comments.
{Make sure to check out my previous ideas and my series on US( SPX ) Sector including 11 episodes of the major US sectors}
1. PART 1-VIX: Volatility Index
2. Series Finale ; Episode 11: US Utilities( XLU )
3. SPX : Elliott Wave Analysis of the current Cycle
Full Disclosure : This is just an opinion, you decide what to do with your own money. For any further references or use of my content for private or corporate purposes- contact me through any of my social media channels. Wish that tview had a copy-right option, but it is what it is.
FEDFUNDS trade ideas


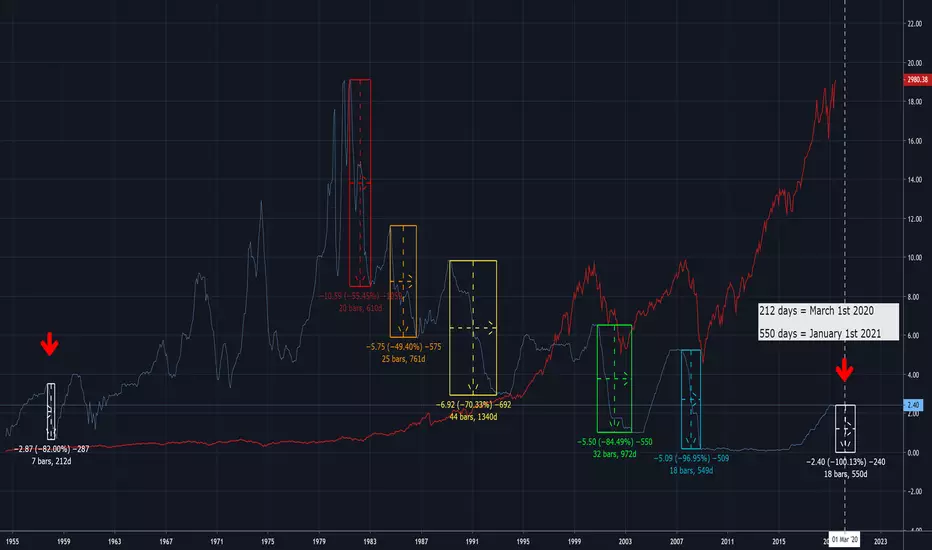
Fed Funds Rate cutting cycle showing 2.40% of cutsShowing 2.40% of cuts as perspective of how fast federal reserve cuts rates.
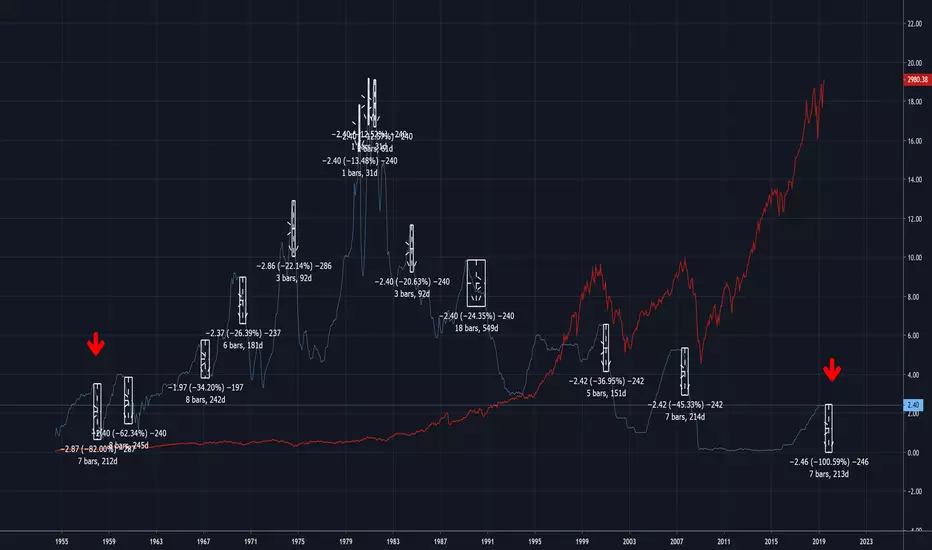
Fed Funds Rate 1955 to 2019 with rate cuts Chart of rate cutting cycles with percentage and time to end of cycle (bottoms).

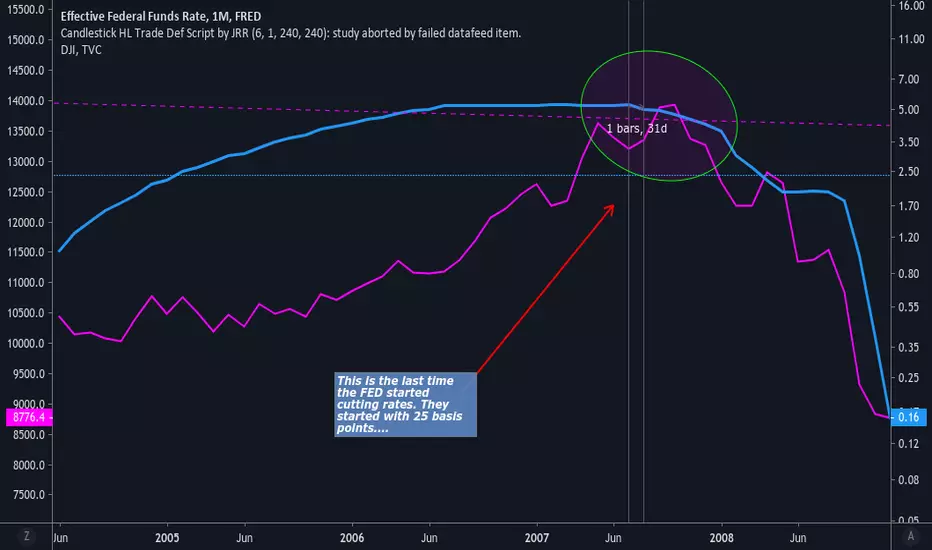
The last time the FED starting cutting Rates..... Please have a look at the last time that the FED began lowering rates; they began with 25 basis points, and they ended at ZERO percent.
FedFunds Rate Predicition is In Tact!Back in March of 2019 I put this out there...and here we are, getting a rate cut today !

Yield Curve Inversion or Planned Implosion?Fed Funds rate divided by the value of the Dow Jones Industrial Average. Seems to be that the DJI is where they are stashing wealth after each crisis. The process would allow them to tank an index like the Dow, buy it up cheap because everyone and thing sold recently and then they fill all their cracks with stolen money. What do you think?
And we were told that war is profitable. Straight up theft is way more profitable....lol
The Next Recession Is Right Around The CornerMonetary Policy is a funny thing, when times are good we raise rates to prevent the economy from overheating and when times are bad we cut rates to help stimulate the economy. But what if it is interest rates that are leading the economy and not the economy leading interest rates. In that case interest rates would paint a very interesting picture.
In my opinion it is interest rates that lead the economy. By lowering rates you entice debt and consumption and by raising rates you cause the inability to service debt and a subsequent recession ensues. It is obvious when looking at this chart of the US Federal Funds Rate that a drop in rates causes a larger debt load and then rates are raised until debt is so un-serviceable a recession begins, to which the response is to cut rates again even lower which does nothing but entice more debt. its a self fulfilling cycle all the way to zero, and soon negative interest rates.
This chart in conjunction with the fact Gold is breaking out, the US stock market indexes are forming a peak, the yield curve has inverted and interest rates around the world are falling once again kick starting the next easing cycle all points to the beginning of the next recession being right around the corner.
This is not financial advice, just be careful out there.


Real Cost of Money vs Recessions When interest rate manipulation goes too far. This coming recesssion/depression looks like it could be a bit deep

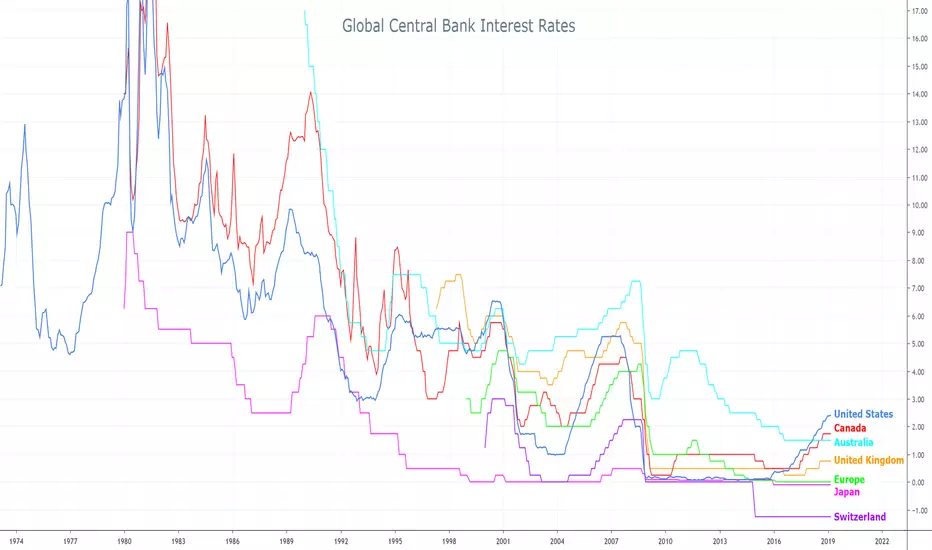
Global Central Bank Interest RatesGlobal Central Bank Interest Rates of Major Central Banks
Made using Quandl
Fed Funds Rate threatening to break-thru decades-long downtrendIf this trendline is broken, it means higher rates and panic in the credit market. Notice also that the last two times (in 2000 and 2007) that the funds rate challenged this line was the beginning of major market declines.


Interest rate and recession correlation?Just an idea based on higher highs in us equities v lower lows in fed interest rate, tracking from the 1980's. Currently overbought and heading for trend line. Recessions followed the last three touches which were overcome by sending interest rates lower each time. Are we headed for negative interest rates in 2021-2022?

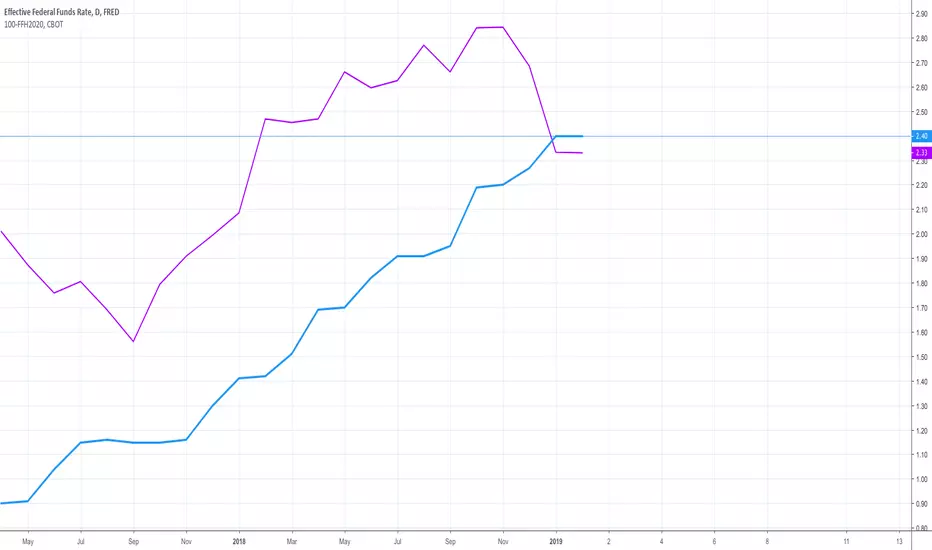
Mar 2020 Fed Funds Futures vs Actual Fed Fund Rate...Mar 2020 Fed Funds Futures vs Actual Fed Fund Rate... its a pricing a rate cut, as Mar 2020 Fed Funds Futures get below actual Fed Fund Rate
3-1 and 5-1 year yield curves inverted todayRecession ahead. Media is all about FUD today with "sources cited" for trade talk delays. Such BS manipulation that is allowed by the SEC. Very difficult to patrol when their pay is by the elites who control the media.
Yield curve inversion tracking updateI thickened the most important indicator of 10yr-2yr thickened purple... almost there!
Once yield curve inverts you can expect recession to already have started to possibly a wait at most of 2 years... given the fundamentals globally I think recession will happen much much sooner than any central bank will admit. It's to everyone's interest to delay the official word on recession and doctor each countries' global GDP data to kick the can down the road as long as possible.

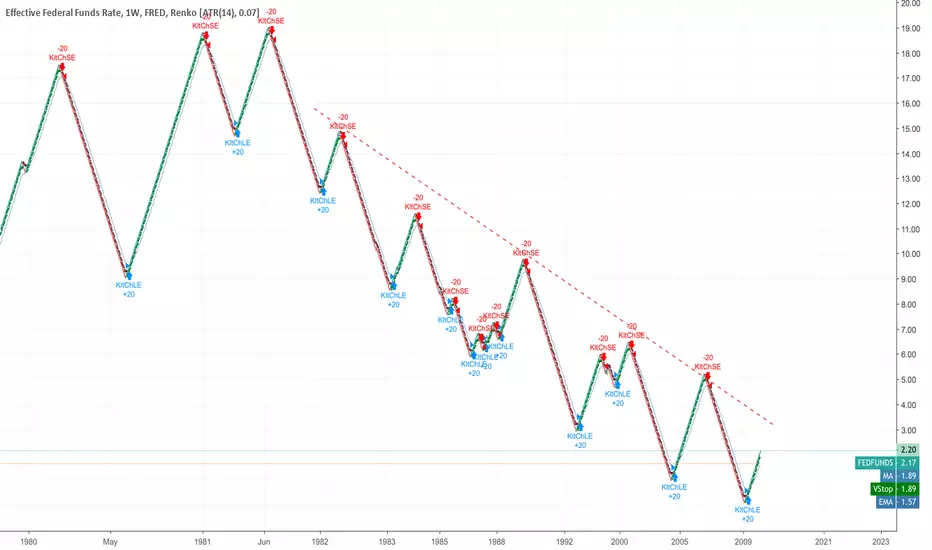
Fed Funds Rate TargetI applied Renko chart to weekly trend of Fed Fund Rates and drew a trend line on the past pivot highs. It looks like the normalisation of interest rate will end at near 3%...
Just Want to Make a Prediction for my future selfI believe that interest rates will go and surpass 3.5% by 2019. At that point it'll rise a little more then either one, skyrocket, or two they will try to lower rates to neutral again, then it will skyrocket. I believe my generation will experience stagflation.
Yield curve inversion tracking - almost there...Slowly but suredly we are approaching multiple sections of yield curve inversion. The data from TV feeds does not show the 3/5 and 2/5 YR yield curve inversions yet as reported last week on mainstream media using other data.