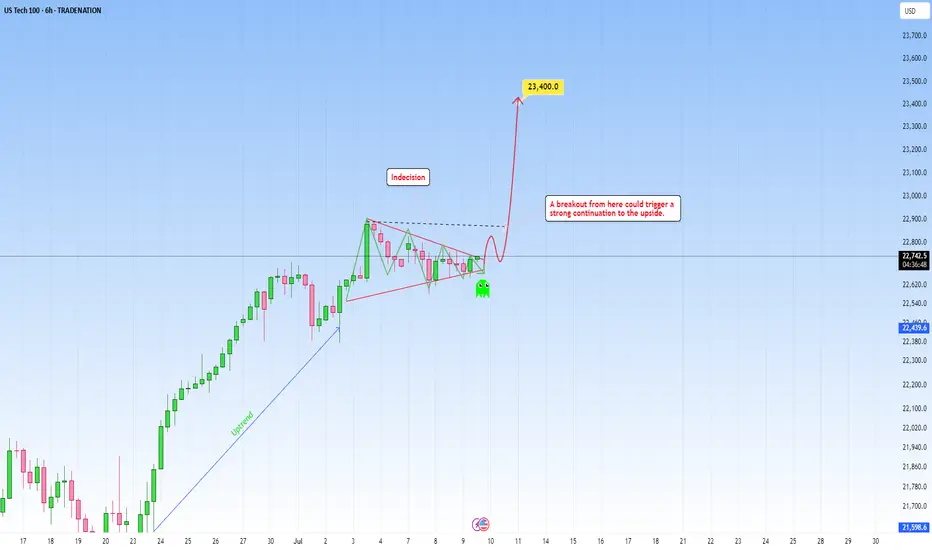
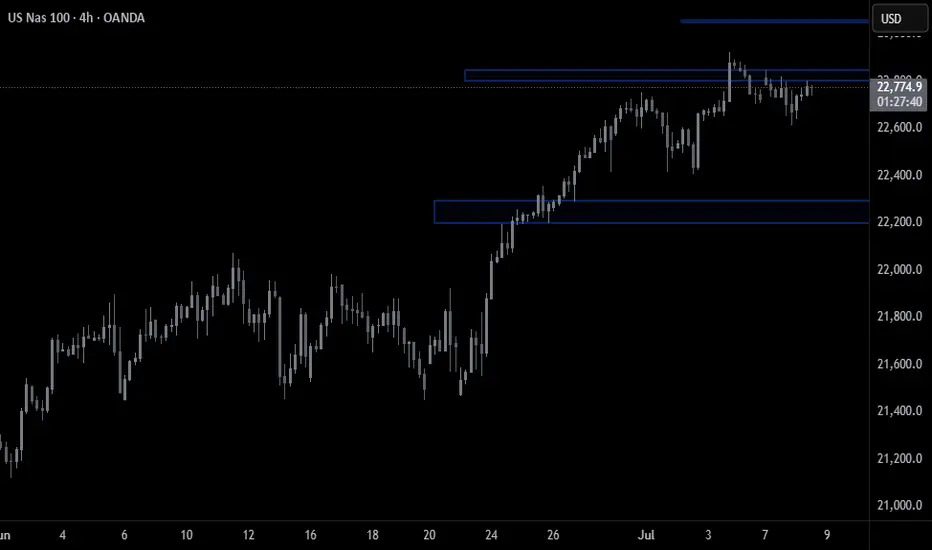
One last squeeze and NAS100 could explode into the next rallyThe NAS100 is currently coiling within a tight consolidation range, showing signs of tension building up. After a strong push upward, price has been moving sideways in a narrowing structure. This build-up around the high, a compression of buyers and sellers in a low-volatility squeeze could be an indication that we could use. This kind of price action typically signals that buyers are gaining control, squeezing out sellers with each dip.
The lack of deep pullbacks combined with increasingly shallow sell-offs shows fading bearish momentum. Which is often typical during a buildup phase before a breakout. If buyers can push price above with a strong close, it could trigger breakout momentum and lead to a continuation of the larger bullish trend.
Ideally, if price reacts positively and forms bullish confirmation, it would set up a solid continuation entry, with upside potential toward the next target of 23.400.
Until then, bulls are watching closely for signs of commitment. The breakout is yet to be confirmed, but the squeeze is on, and the pressure is building.
What will happen next?
Just sharing my thoughts for the charts, this isn’t financial advice. Always confirm your setups and manage your risk properly.
Disclosure: I am part of Trade Nation's Influencer program and receive a monthly fee for using their TradingView charts in my analysis.
NDQ100 trade ideas
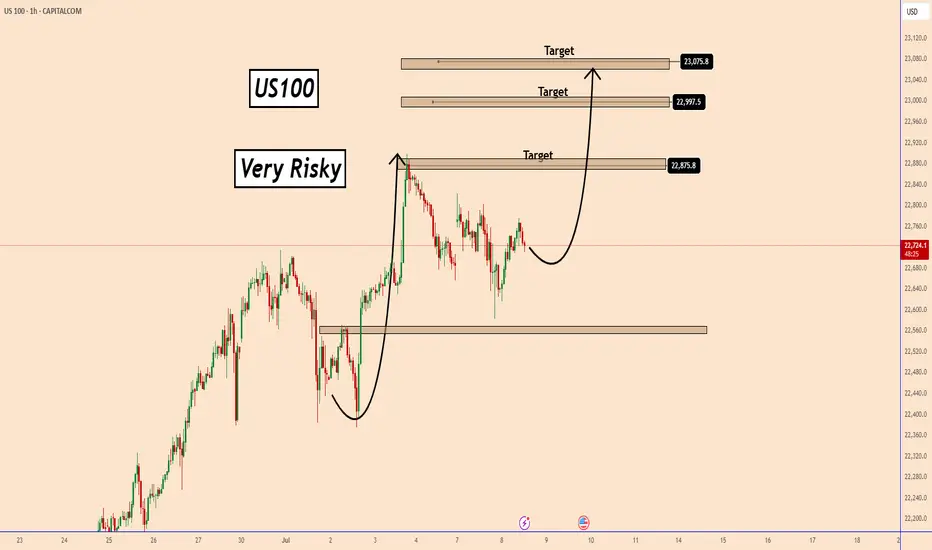
US100: The only risk remains Trump with his tariffs.US100: The only risk remains Trump with his tariffs.
US100 is in a strong uptrend and the chances of it rising are still high.
The price has already found a strong support near 22600 and I think it is preparing to start an uptrend soon.
The only risk for the Indices is related to Trump and his tariffs. This is the only threat I see at the moment.
Key targets: 22875 ; 22997; 23075
You may find more details in the chart!
Thank you and Good Luck!
PS: Please support with a like or comment if you find this analysis useful for your trading day
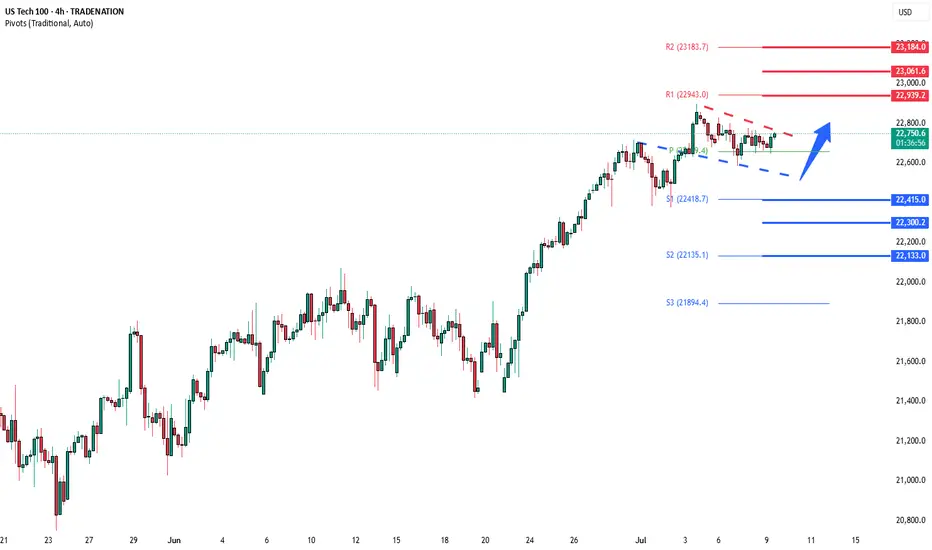
NSDQ100 Bullish breakout retest?Donald Trump escalated trade tensions again, threatening a 35% tariff on Canadian goods shortly after reopening trade talks, and floated doubling global tariffs to 20%. This reinforces his aggressive protectionist stance and puts renewed pressure on allies like Canada and Vietnam, the latter blindsided by a 20% levy. Meanwhile, US-China relations may be entering a critical phase, with a possible Trump-Xi summit hinted at by Marco Rubio during talks in Malaysia.
On the geopolitical front, Trump is signaling a harder line on Russia, previewing a “major statement” and backing expanded sanctions as the US sends more weapons to Ukraine. This raises global uncertainty, especially for energy and defense sectors.
Conclusion for NSDQ100 trading:
Rising trade tensions and geopolitical risks may dampen market sentiment and lead to volatility in tech-heavy Nasdaq stocks, particularly those reliant on global supply chains. While traders have grown numb to tariff talk, the cumulative pressure suggests a downside risk is building. In the short term, maintain a cautious stance—watch for potential pullbacks and heightened intraday volatility as policy clarity remains elusive.
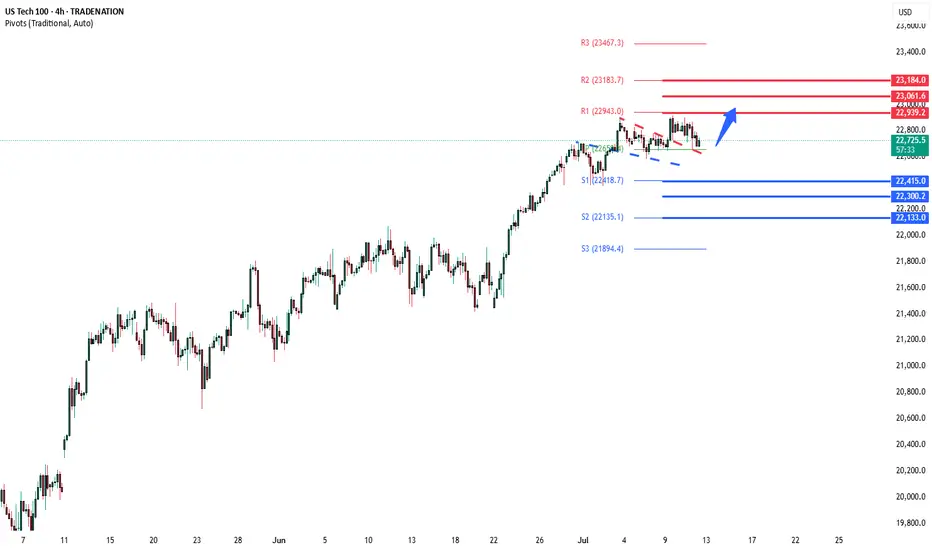
Key Support and Resistance Levels
Resistance Level 1: 22940
Resistance Level 2: 23060
Resistance Level 3: 23180
Support Level 1: 22410
Support Level 2: 22300
Support Level 3: 22130
This communication is for informational purposes only and should not be viewed as any form of recommendation as to a particular course of action or as investment advice. It is not intended as an offer or solicitation for the purchase or sale of any financial instrument or as an official confirmation of any transaction. Opinions, estimates and assumptions expressed herein are made as of the date of this communication and are subject to change without notice. This communication has been prepared based upon information, including market prices, data and other information, believed to be reliable; however, Trade Nation does not warrant its completeness or accuracy. All market prices and market data contained in or attached to this communication are indicative and subject to change without notice.
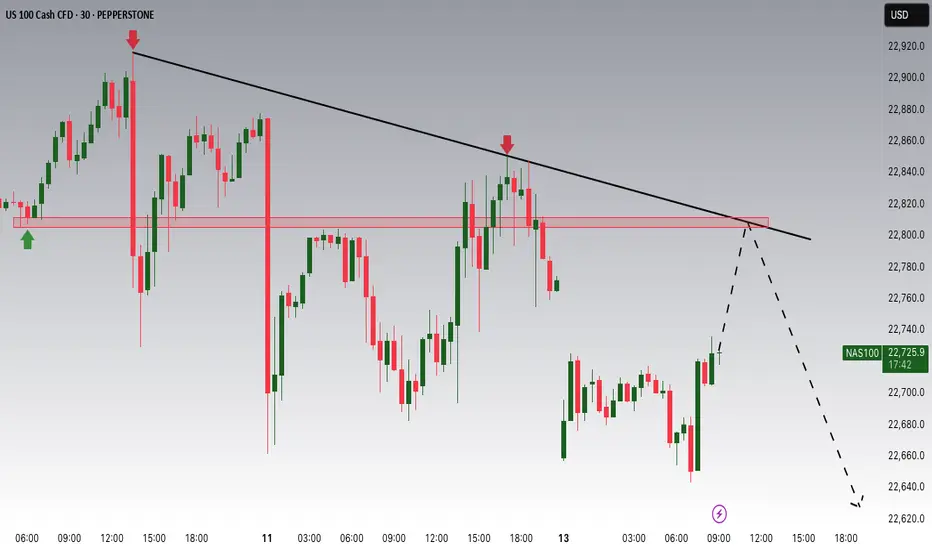
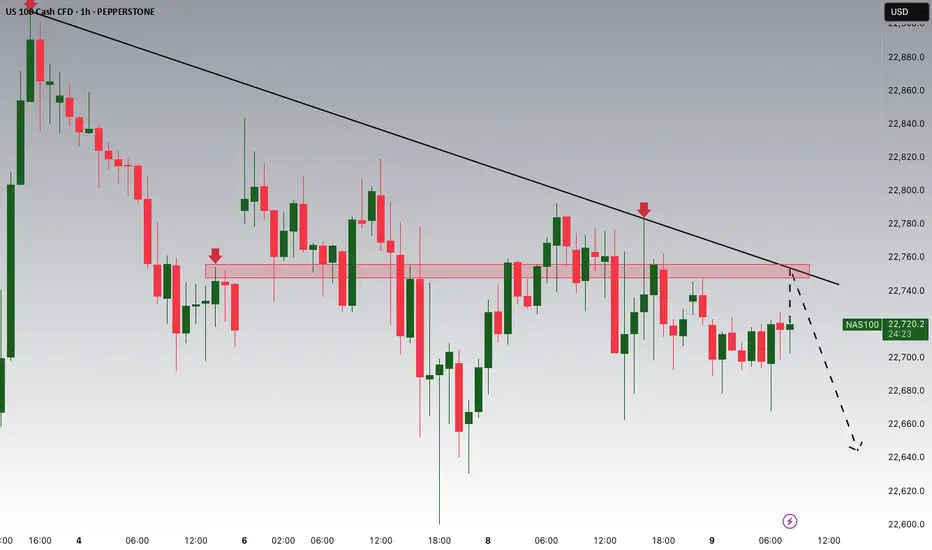
NASDAQ Potential DownsidesHey Traders, in today's trading we are monitoring NAS100 for a selling opportunity around 22,800 zone, NASDAQ is trading in a downtrend and currently is in a correction phase in which it is approaching the trend at 22,800 support and resistance area.
Trade safe, Joe.
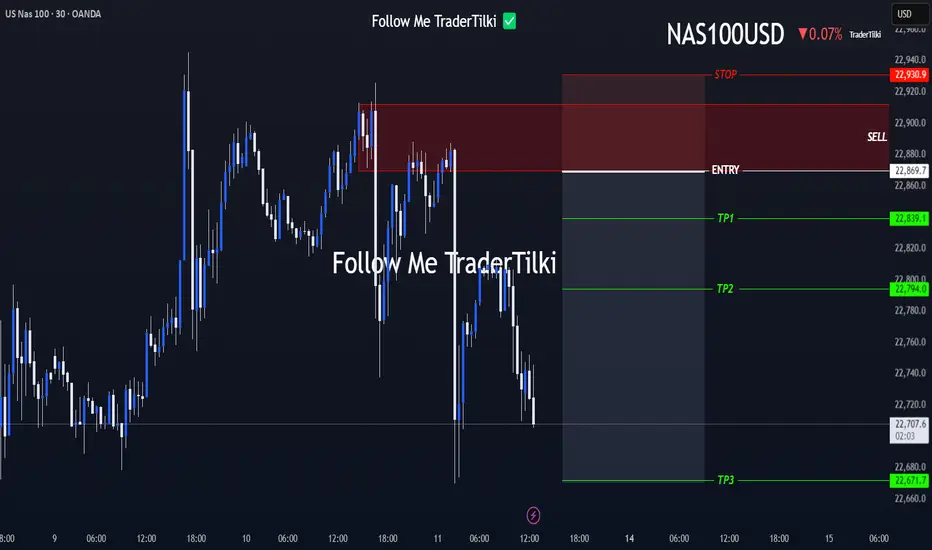
NAS100 Setup Locked In — Ride the Drop from the Order Block!Hey Guys,
I'm planning a sell trade on the NAS100 index from a designated order block. Once price reaches the sell zone, the position will be activated.
📍 Trade Details:
- 🟢 Entry Level: 22,869
- 🔴 Stop Loss: 22,930
- 🎯 TP1 – First Target: 22,839
- 🎯 TP2 – Second Target: 22,794
- 🎯 TP3 – Final Target: 22,671
📐 Risk-to-Reward Ratio: 3.24
Your likes and support are what keep me motivated to share these analyses consistently.
Huge thanks to everyone who shows love and appreciation! 🙏
NASDAQ Potential DownsidesHey Traders, in today's trading session we are monitoring NAS100 for a selling opportunity around 22,750 zone, NASDAQ is trading in a downtrend and currently is in a correction phase in which it is approaching the trend at 22,750 support and resistance area.
Trade safe, Joe.
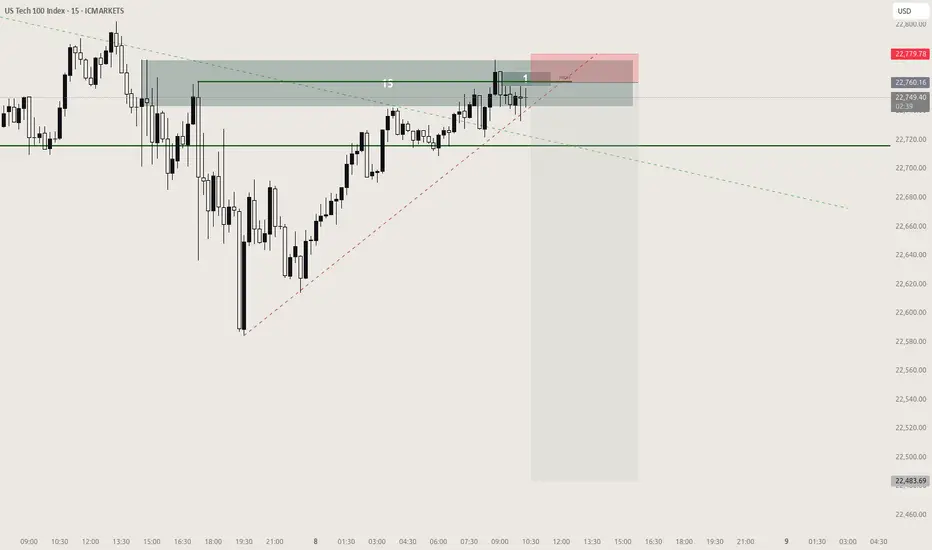
NAS100 sell setup15 min supply zone engineering during market open yesterday will be the key trigger for todays sell off
US NAS 100Preferably suitable for scalping and accurate as long as you watch carefully the price action with the drawn areas.
With your likes and comments, you give me enough energy to provide the best analysis on an ongoing basis.
And if you needed any analysis that was not on the page, you can ask me with a comment or a personal message.
Enjoy Trading ;)
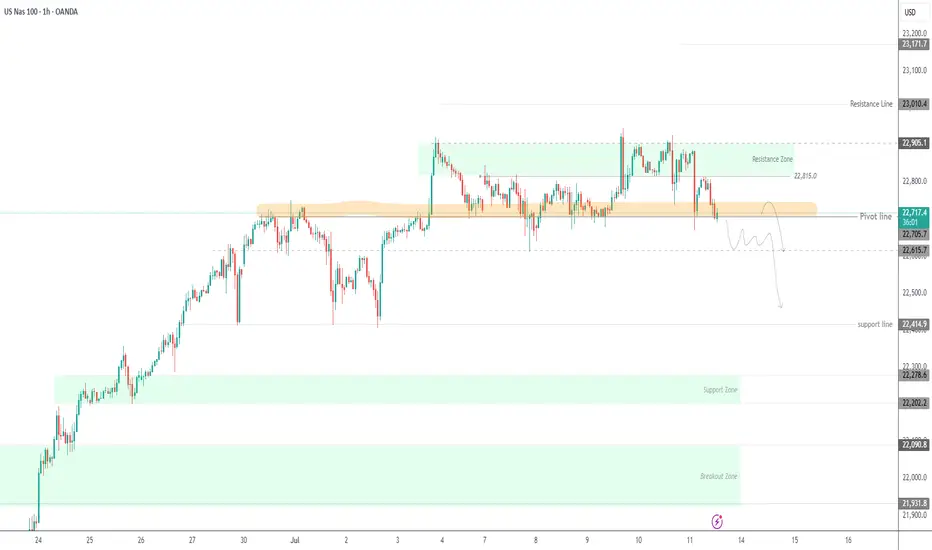
Bearish Momentum Builds Below pivot zone USNAS100 Analysis
Price has reversed from its ATH and now shows bearish momentum.
Below 22705, downside targets are 22615 and 22420.
Bullish scenario only valid if price breaks and holds above 22815.
Pivot: 22710
Support: 22615, 22420
Resistance: 22815, 22910
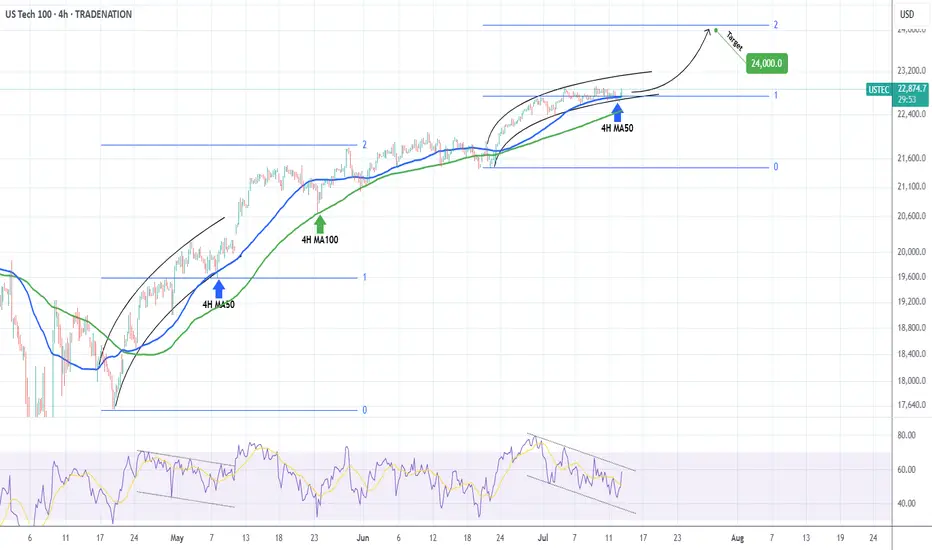
NASDAQ Is looking for a massive break-out to 24000!Nasdaq (NDX) is most likely taking advantage of the 4H MA50 (blue trend-line) as a Support and after hitting it, it appears that the price will look for a way above the Parabola.
This might be similar to what took place after the May 07 test of the 4H MA50. The price broke above that parabolic pattern and peaked on the 2.0 Fibonacci extension. As a result, we are looking for 24000 as a potential Target in the next 2 weeks.
-------------------------------------------------------------------------------
** Please LIKE 👍, FOLLOW ✅, SHARE 🙌 and COMMENT ✍ if you enjoy this idea! Also share your ideas and charts in the comments section below! This is best way to keep it relevant, support us, keep the content here free and allow the idea to reach as many people as possible. **
-------------------------------------------------------------------------------
Disclosure: I am part of Trade Nation's Influencer program and receive a monthly fee for using their TradingView charts in my analysis.
💸💸💸💸💸💸
👇 👇 👇 👇 👇 👇
Bear signalsLooking for 22500 Im thinking. Banks trade the round numbers and the round numbers for nas are 125 point increments
NSDQ100 Bullish Flag continuation pattern developing Metals Market Volatility
Trump’s proposed 50% tariff on copper imports triggered a sharp drop in London copper prices (~2%), with risks of falling below $9,000/ton. While U.S. prices spiked on supply concerns, the global move reflects industrial demand fears—potentially weighing on manufacturing and cyclical stocks.
Trade Negotiations Intensify
Asian trade delegates have logged over 350,000 air miles traveling to Washington as tariff timelines remain unclear. Ongoing uncertainty is capping broader risk appetite, though delayed duties and active talks are offering short-term relief to markets.
Fed Under Pressure
Trump ramped up criticism of Fed Chair Jerome Powell, calling him “terrible,” and may consider replacing him with top adviser Kevin Hassett. This raises questions about central bank independence and future rate policy, a potential headwind for investor confidence.
Market Snapshot
U.S. stock futures: Slightly higher
Oil: Up, on Red Sea conflict
Gold: Down, as risk appetite stabilizes
Conclusion – Nasdaq 100 Trading Outlook
Near-term view: Mildly bullish, supported by easing trade tension and tech sector strength.
Caution warranted: Watch for headline risks from new tariff announcements or Fed-related developments.
Key Support and Resistance Levels
Resistance Level 1: 22940
Resistance Level 2: 23060
Resistance Level 3: 23180
Support Level 1: 22410
Support Level 2: 22300
Support Level 3: 22130
This communication is for informational purposes only and should not be viewed as any form of recommendation as to a particular course of action or as investment advice. It is not intended as an offer or solicitation for the purchase or sale of any financial instrument or as an official confirmation of any transaction. Opinions, estimates and assumptions expressed herein are made as of the date of this communication and are subject to change without notice. This communication has been prepared based upon information, including market prices, data and other information, believed to be reliable; however, Trade Nation does not warrant its completeness or accuracy. All market prices and market data contained in or attached to this communication are indicative and subject to change without notice.
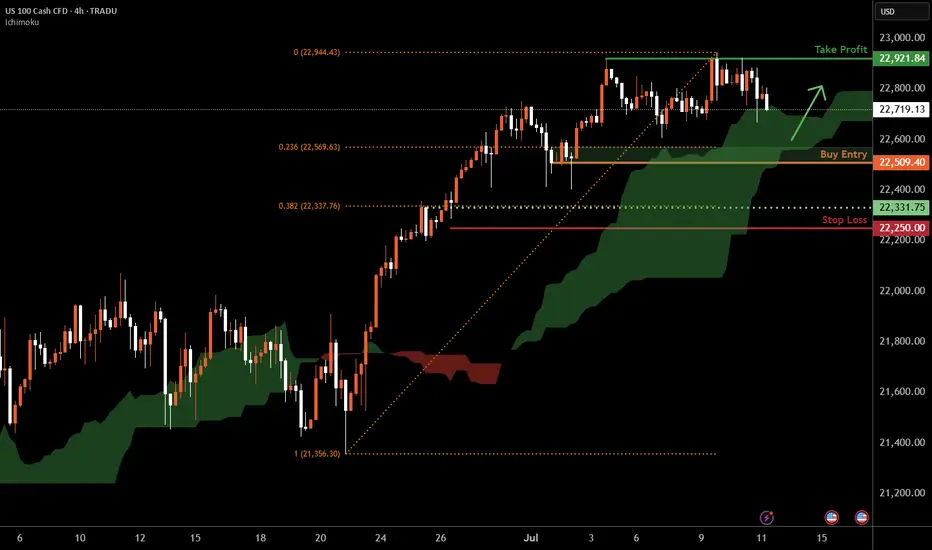
Nasdaq-100 H4 | Swing-low support at 23.6% Fibonacci retracementThe Nasdaq-100 (NAS100) is falling towards a swing-low support and could potentially bounce off this level to climb higher.
Buy entry is at 22,509.40 which is a swing-low support that aligns closely with the 23.6% Fibonacci retracement.
Stop loss is at 22,250.00 which is a level that lies underneath a pullback support and the 38.2% Fibonacci retracement.
Take profit is at 22,921.84 which is a multi-swing-high resistance.
High Risk Investment Warning
Trading Forex/CFDs on margin carries a high level of risk and may not be suitable for all investors. Leverage can work against you.
Stratos Markets Limited (tradu.com ):
CFDs are complex instruments and come with a high risk of losing money rapidly due to leverage. 63% of retail investor accounts lose money when trading CFDs with this provider. You should consider whether you understand how CFDs work and whether you can afford to take the high risk of losing your money.
Stratos Europe Ltd (tradu.com ):
CFDs are complex instruments and come with a high risk of losing money rapidly due to leverage. 63% of retail investor accounts lose money when trading CFDs with this provider. You should consider whether you understand how CFDs work and whether you can afford to take the high risk of losing your money.
Stratos Global LLC (tradu.com ):
Losses can exceed deposits.
Please be advised that the information presented on TradingView is provided to Tradu (‘Company’, ‘we’) by a third-party provider (‘TFA Global Pte Ltd’). Please be reminded that you are solely responsible for the trading decisions on your account. There is a very high degree of risk involved in trading. Any information and/or content is intended entirely for research, educational and informational purposes only and does not constitute investment or consultation advice or investment strategy. The information is not tailored to the investment needs of any specific person and therefore does not involve a consideration of any of the investment objectives, financial situation or needs of any viewer that may receive it. Kindly also note that past performance is not a reliable indicator of future results. Actual results may differ materially from those anticipated in forward-looking or past performance statements. We assume no liability as to the accuracy or completeness of any of the information and/or content provided herein and the Company cannot be held responsible for any omission, mistake nor for any loss or damage including without limitation to any loss of profit which may arise from reliance on any information supplied by TFA Global Pte Ltd.
The speaker(s) is neither an employee, agent nor representative of Tradu and is therefore acting independently. The opinions given are their own, constitute general market commentary, and do not constitute the opinion or advice of Tradu or any form of personal or investment advice. Tradu neither endorses nor guarantees offerings of third-party speakers, nor is Tradu responsible for the content, veracity or opinions of third-party speakers, presenters or participants.
Long position idea on Nasdaq Simple and precise idea of Nasdaq. Bullish momentum in full swing. Nasdaq recently broke out of the previous High/Resistance and shows that the bulls are still in power. Take profit is at 25.000.00 because Nasdaq usually moves around 10.000 pips after a market crash so when doing my calculations from previous Low of 16300, my estimation is around 25000 which equals to 9,000 - 10,000 pips.
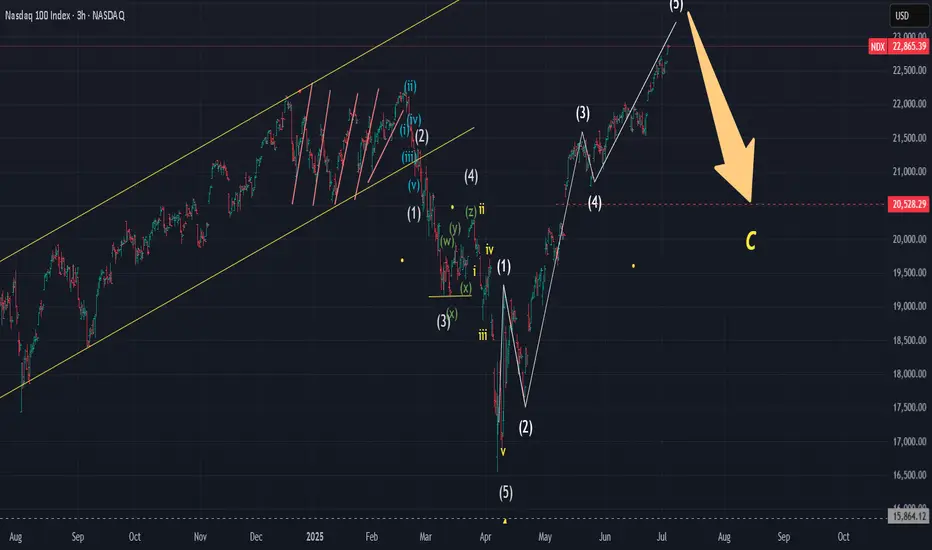
25-07-03 NDX 22867 - Recovery done/Correction aheadImpulsive recovery with nice 1 to 5 structure.
Expect maybe last 3-5% upward, then correction down to 20'600.
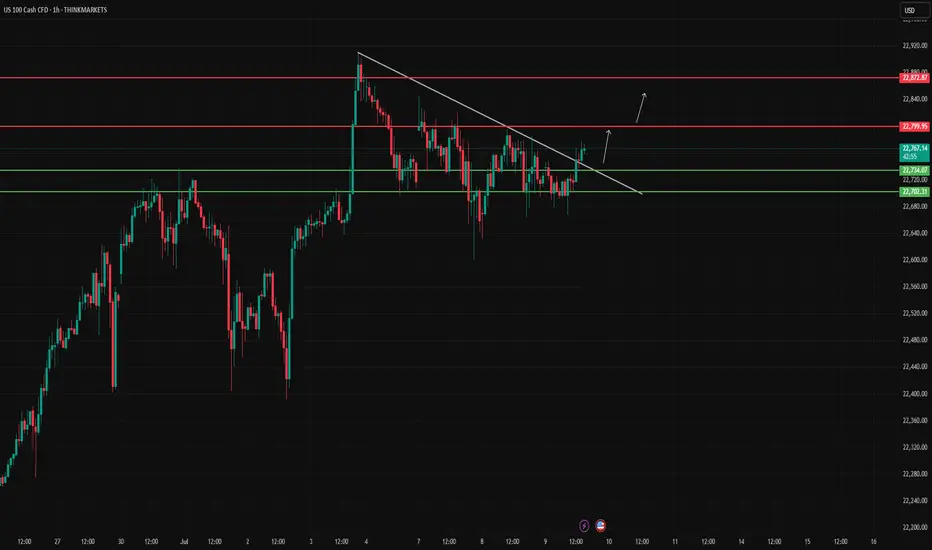
US100 – Trendline Break Signals Potential RallyUS100 breaks above descending trendline.
🎯 Targets: 22799 → 22877
⚠️ Invalidation if price drops below 22702
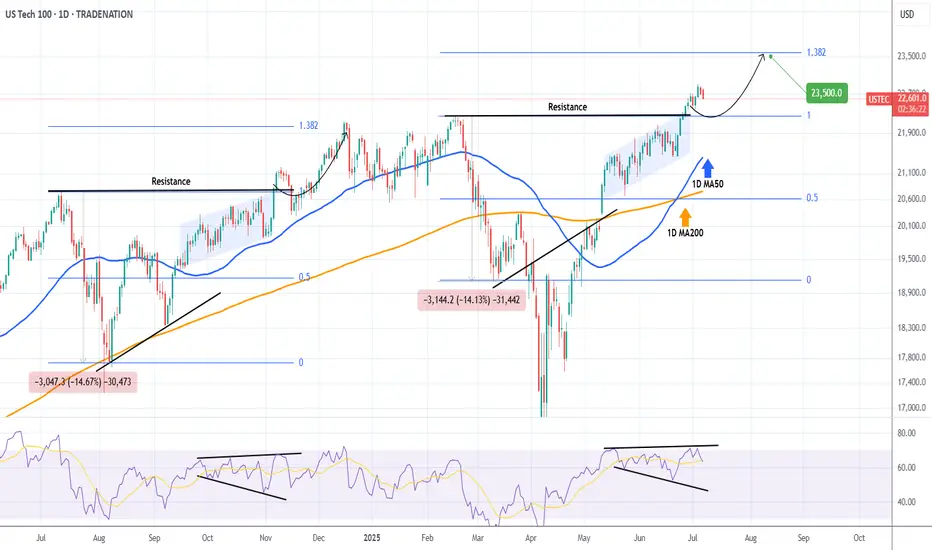
NASDAQ going to 23500 by August.Nasdaq (NDX) is trading above the previous All Time High (ATH) Resistance, staging a very structured uptrend that has recently gotten out of a 1D Golden Cross.
As long as the 1D MA50 (blue trend-line) continues to support, we might get a repeat of the November - December 2024 rally that peaked on the 1.382 Fibonacci extension level from he August 2024 Low.
That whole July - October 2024 pattern is quite similar to the February - June 2025 of today. A quick pull-back is possible at this stage but by the end of August, we expect the index to test at least the 23500 level.
-------------------------------------------------------------------------------
** Please LIKE 👍, FOLLOW ✅, SHARE 🙌 and COMMENT ✍ if you enjoy this idea! Also share your ideas and charts in the comments section below! This is best way to keep it relevant, support us, keep the content here free and allow the idea to reach as many people as possible. **
-------------------------------------------------------------------------------
Disclosure: I am part of Trade Nation's Influencer program and receive a monthly fee for using their TradingView charts in my analysis.
💸💸💸💸💸💸
👇 👇 👇 👇 👇 👇
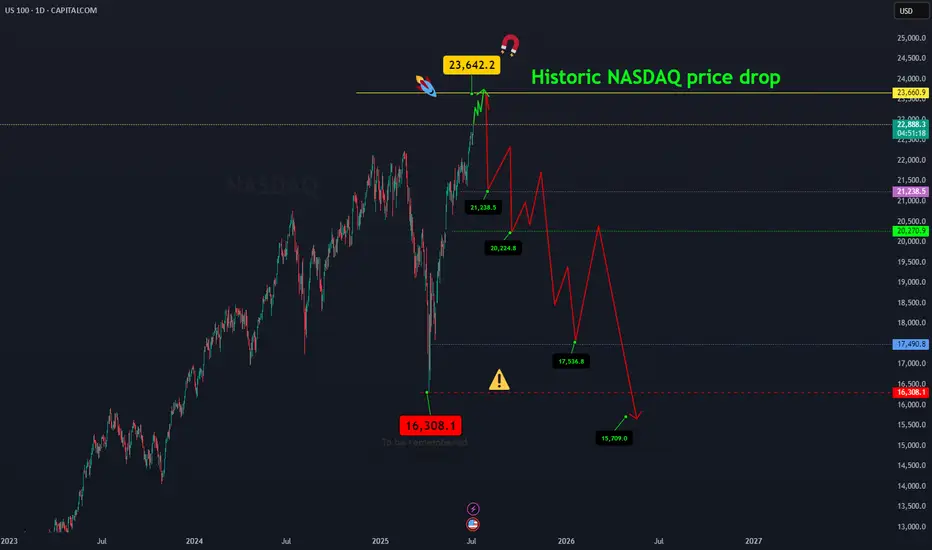
NASDAQ price dropAfter the Nasdaq price reaches around 23642.2, a historic drop will occur and the target is to drop to 16308.
Whatever happens at the highest price, the final destination is towards 16308.
I have identified the price levels in the middle of this expected drop that can cause the price to correct.
IG:NASDAQ
US100 MARKET OUTLOOK - H1Price is strongly bullish in monthly, weekly and daily but we’re currently seeing a retrace in H1 timeframe. we’re going to see price tap into our H1 point of interest .
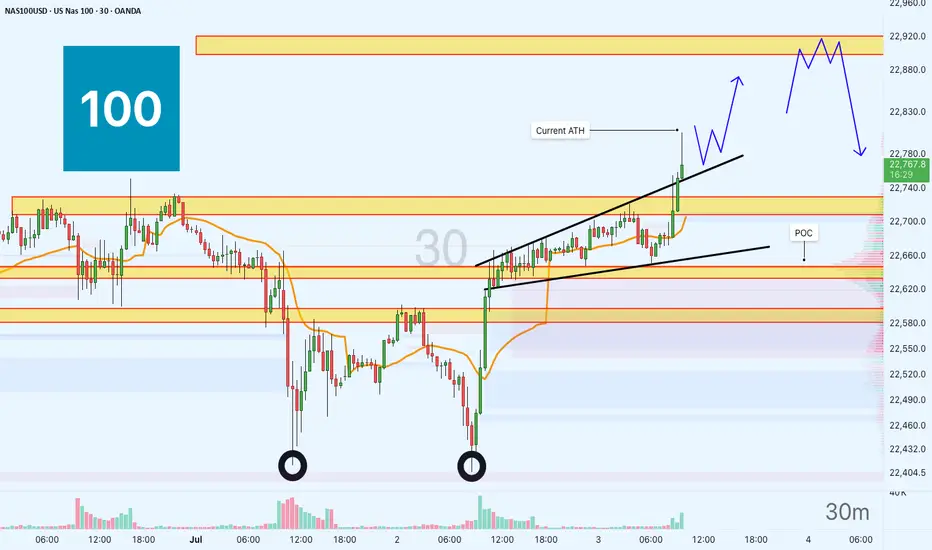
US100 — New ATH Trading SetupThe price recently previous ATH at the 22730 level. Current ATH is marked near 22,800, with a POC at 22,640.
Potential support around 22,500, below POC.
Watch for a bounce or further rise beyond 22,920.
Buyers probably will push right through 23,000 level today on Micros and Minis.
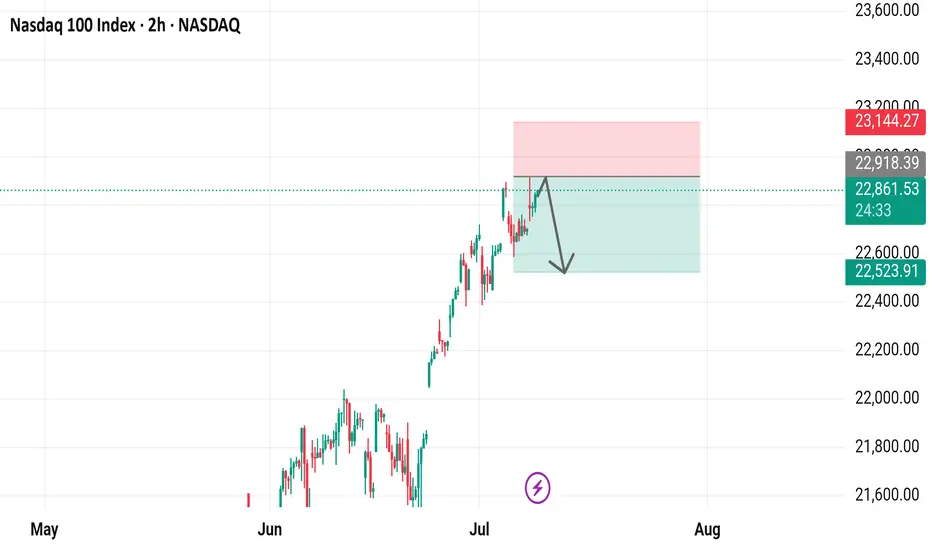
Nasdaq 100 Index 2-Hour Chart Analysis2-hour candlestick chart for the Nasdaq 100 Index (NDX) on the NASDAQ exchange. The chart spans from May to August, showcasing a significant upward trend with notable fluctuations. Key indicators include a recent price of 22,861.53, representing a 0.72% increase. The chart features technical analysis elements such as support and resistance levels, highlighted by green and red boxes, and a downward arrow suggesting a potential price movement.
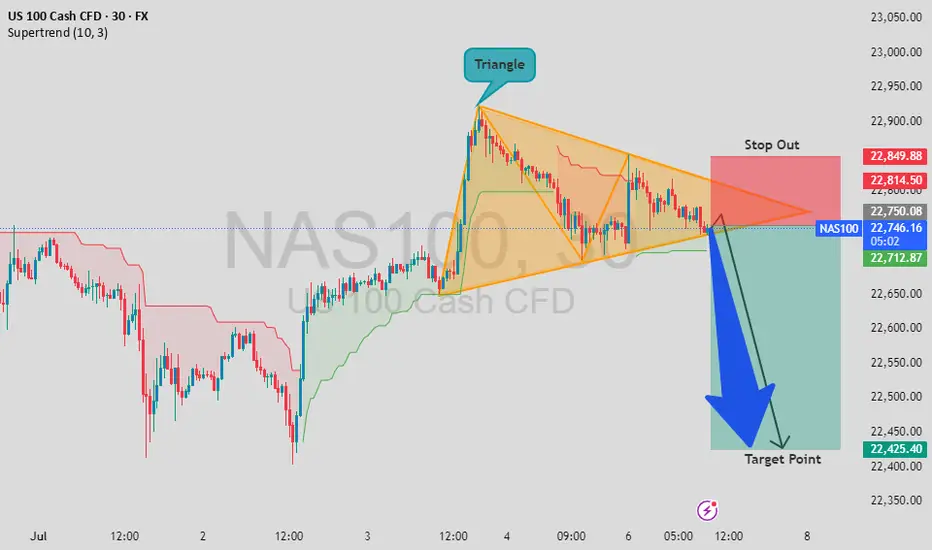
NAS100 - Bearish Triangle Breakdown Forming!NAS100 - Bearish Triangle Breakdown Forming!
A symmetrical triangle pattern has formed on the NAS100 30-min chart, signaling potential volatility ahead. We’re nearing the apex of the triangle, and price action suggests a possible bearish breakout.
🎯 Entry: 22,750.00
🎯Target: 22,400.40
⛔ Stop Out: 22,850.88
The risk/reward setup is favorable if the breakout follows through. Keep a close eye on volume confirmation as price exits the triangle.
What do you think about this triangle formation? Will the breakdown hold, or could bulls trap the shorts again?
💬 Share your opinion below and let’s discuss the setup!
🙏 If you find this helpful, please give it a like and follow for more technical ideas!
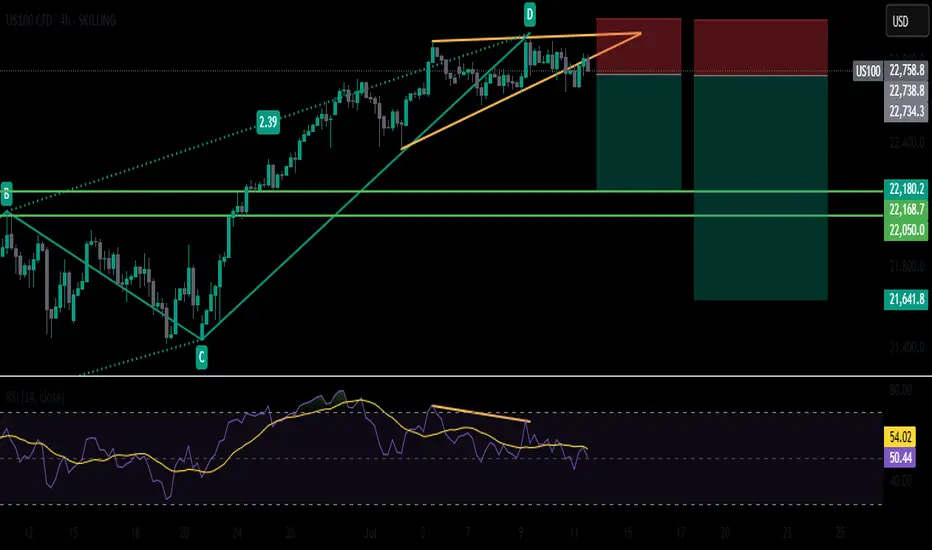
Wedge Cracks + Tariff Heat = Bearish Setup On US100The US100 is showing signs of potential reversal after completing a harmonic ABCD pattern near the wedge resistance. The price has broken below the rising wedge support, indicating bearish momentum.
Bearish Confluences:
1) Completed the ABCD pattern
2) Rsisng Wedge Breakdown
3) Clear Bearish RSI Divergence, showing weakening momentum at highs.
Targets:
TP1: 22180
TP2: 22050
TP3: If the price breaks below 22050, then TP3 will be 21650