NAS100 - Follow Progress 2Dear Friends in Trading,
How I see it,
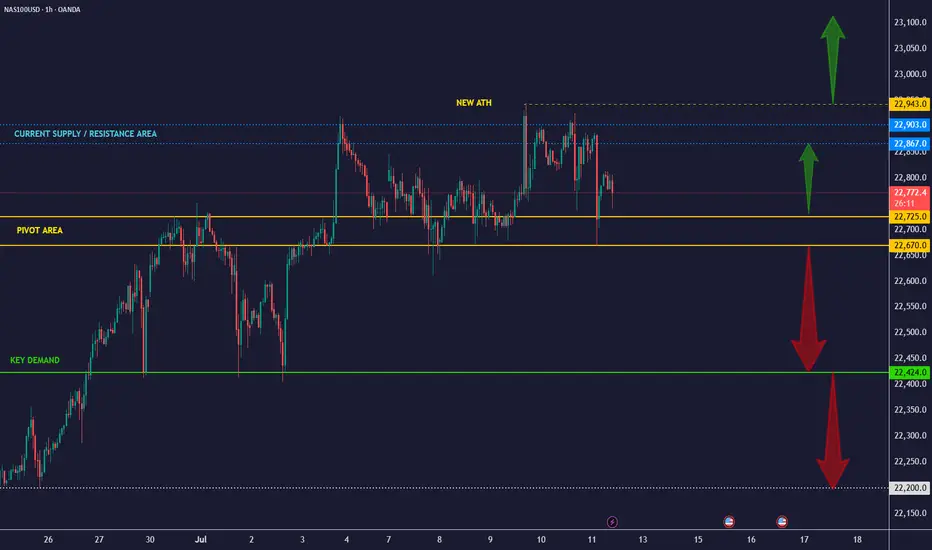
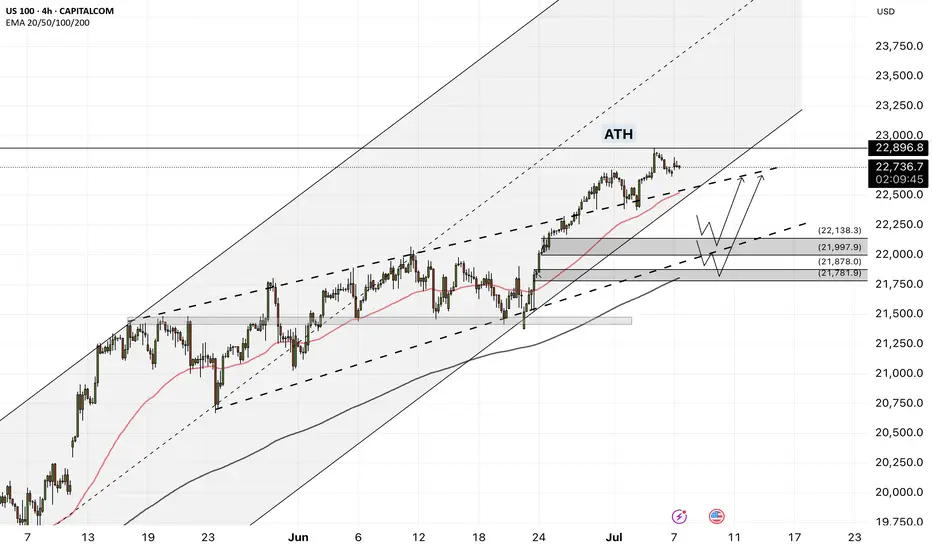
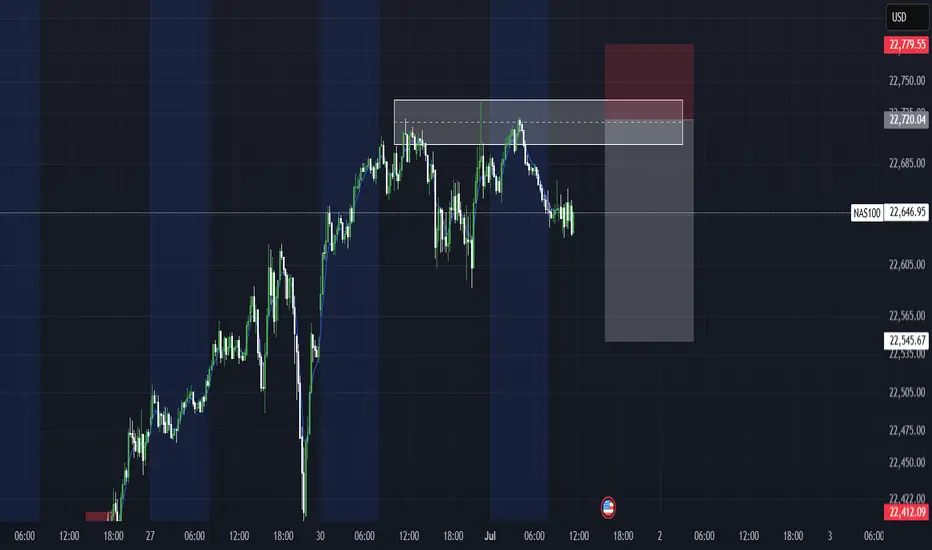
I have summarized the progress and indicated all key levels
Keynotes:
1) I am starting to see strong quality red candles.
2) 22867 is a VERY strong Internal resistance level at this time.
3) 22725 is a VERY strong Internal support level at this time.
I'll keep you posted...please ask if anything is unclear.
I sincerely hope my point of view offers a valued insight.
Thank you for taking the time to study my analysis.
NDQ100 trade ideas
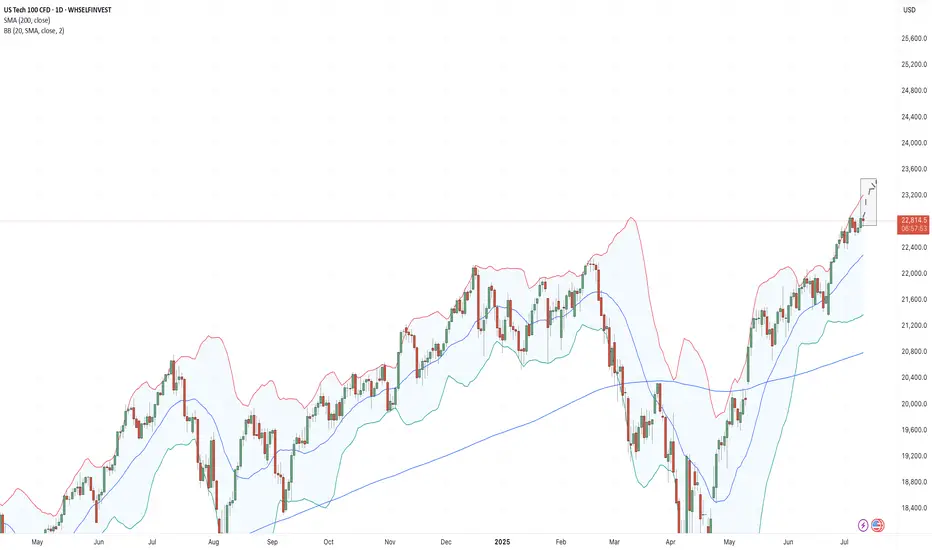
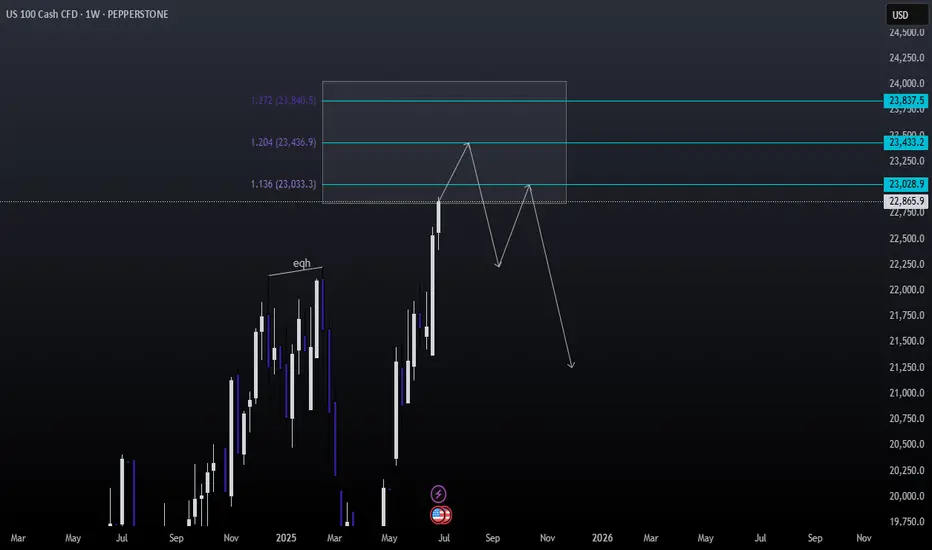
Nasdaq leads the rally and can move for 3-5 days moreWhile crude oil is declining, tech stocks are gaining momentum: Nasdaq had reached another all-time-high recently and that might not be over: according to statistical studies, it rarely reverses quickly above the upper Bollinger Bands line and the average swing duration is between 17 and 20 days (which gives us several days of potential continuation).
The earnings season fuels growth for many technological stocks, and the “sell America” narrative steps back, so we may see Nasdaq growing as shown in the chart below.
Don't forget - this is just the idea, always do your own reserch and never forget to manage your risk!
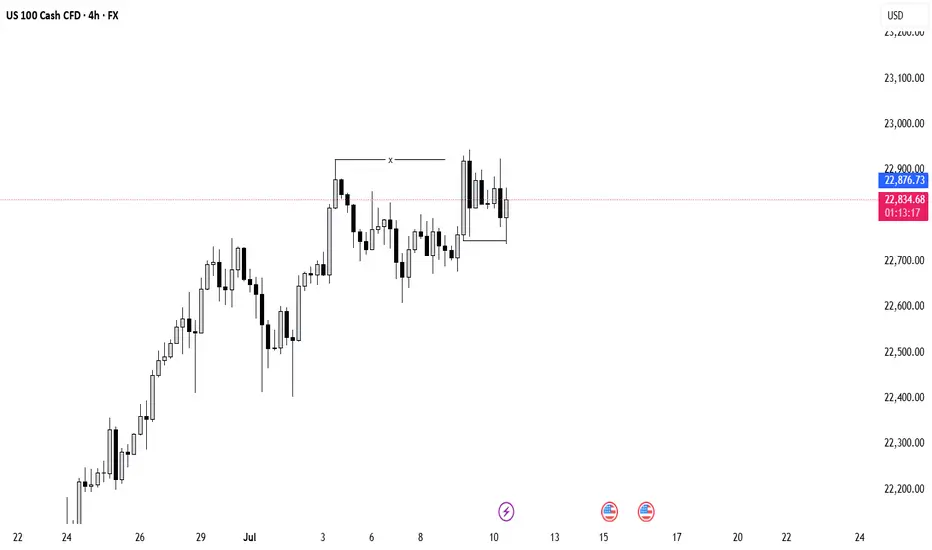
The W FormationThe question now is, with the W pattern forming with bold bullish price, that has broken a high we had as a target yesterday, tapped on the FVG already and now showing some positive candle stick communication, will we buy to continue breaking the highs, or relax and wait for more confirmation within the fvg range or even lower before going in?
NAS100 Reading Market Structure: When to Trade and When to WaitI'm currently keeping a close eye on the NASDAQ 📉. Price has remained largely range-bound over the past few sessions and continues to show signs of pressure 🔻. While we've seen a short-term rally 🚀, it lacks the conviction and momentum typically seen in stronger trending environments 📊.
When comparing the current conditions to previous trend phases, the difference is clear. Structure is unclear, and there's no confirmation of sustained direction yet. As shown on the chart 📈, we previously saw strong bullish momentum followed by a sharp shift, suggesting indecision in the market 🤔.
In these situations, patience is key ⏳. It's just as important to know when not to trade as it is to know when to act 🎯. For now, I’m choosing to stay on the sidelines until a clearer trend develops.
Not financial advice ⚠️

NAS100 - Follow Progress 1Dear Friends in Trading,
How I see it,
At this time, I need the following:
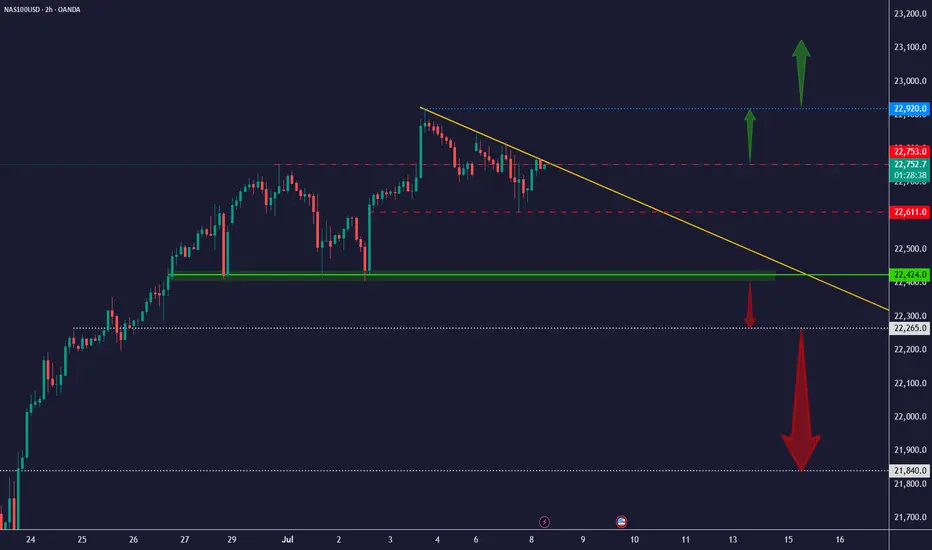
1) A bounce from 22424 to validate current trend resistance.
2) Or an invalidation of previous demand - A breach of 22424.
3) Or a new ATH - A breach of 22920.
Keynote:
We are still in an extreme bullish environment.
Determine your bias every day and each day.
I sincerely hope my point of view offers a valued insight.
Thank you for taking the time to study my analysis.
NAS100 - Stock market is waiting for tariffs!The index is above the EMA200 and EMA50 on the four-hour timeframe and is trading in its ascending channel. Maintaining the ascending channel will lead to the continuation of the Nasdaq's upward path to higher targets, but if it does not rise and corrects towards the demand limits, you can buy the Nasdaq index with appropriate reward and risk.
Three months ago, Donald Trump postponed the imposition of severe retaliatory tariffs, granting America’s major trading partners more time to reach new agreements that Washington views as “fairer.” Now, as the White House’s July 9 deadline approaches, only two official trade deals have been finalized—one with the United Kingdom and another with Vietnam. As for China, merely a fragile temporary truce has been reached, which has so far prevented any additional tariffs from being enforced.
Although reports suggest promising progress in negotiations with India, Japan, and South Korea, no final agreements have been secured with these countries yet. Interestingly, talks with the European Union—which had previously stalled—have suddenly taken a positive turn, and prospects for a deal with Canada in the coming days have also improved.
However, given the limited time left, it seems unlikely that trade agreements with all of America’s 18 key partners will be reached before the deadline. This situation has raised a critical question for the markets: Will Trump set a new deadline for the remaining countries, or will the suspended tariffs be reinstated?
The prevailing view is that the U.S. president will once again resort to threats before granting any extensions—this time not merely by reviving the “Liberation Day” tariffs, but also by promising even heavier tariffs to extract the last concessions from the remaining trade partners.
U.S. Treasury Secretary Scott Bassett stated that if no agreements are reached by August 1, tariffs will revert to the levels announced in April. He also emphasized that Washington’s core strategy in these trade talks is to apply maximum pressure. According to Bassett, letters will be sent to various countries, outlining the August 1 deadline for reaching deals. This news, which broke during the market’s closing hours, sparked a wave of risk appetite in the financial markets.
In a week when the U.S. economic calendar is notably devoid of major data releases, investors are focusing their attention on the minutes from the Federal Reserve’s June FOMC meeting—a document that could offer fresh insights into the trajectory of interest rates for the second half of the year.
June’s strong employment report, which exceeded market expectations, has effectively dashed hopes for an interest rate cut this month. Now, if the positive economic momentum persists, the likelihood of a rate cut in the September meeting may also gradually be priced out by the markets.
According to data from Challenger, Gray & Christmas, U.S. employers announced 47,999 job cuts in June, marking a sharp decline from 93,816 in the previous month. Compared to June of last year, layoffs have dropped by 2%. However, total job cuts in the second quarter of 2025 reached 247,256—a 39% increase from the same period last year (177,391) and the highest second-quarter layoff figure since 2020.
With no significant economic reports scheduled for the coming days, investors will be closely analyzing Wednesday night’s Fed minutes and the limited remarks from central bank officials—statements where every word has the potential to significantly move the markets.
US100/Analysis *📊 US100 (NAS100) – 4H Analysis & Trade Signal*
---
*🔎 Chart Observation:*
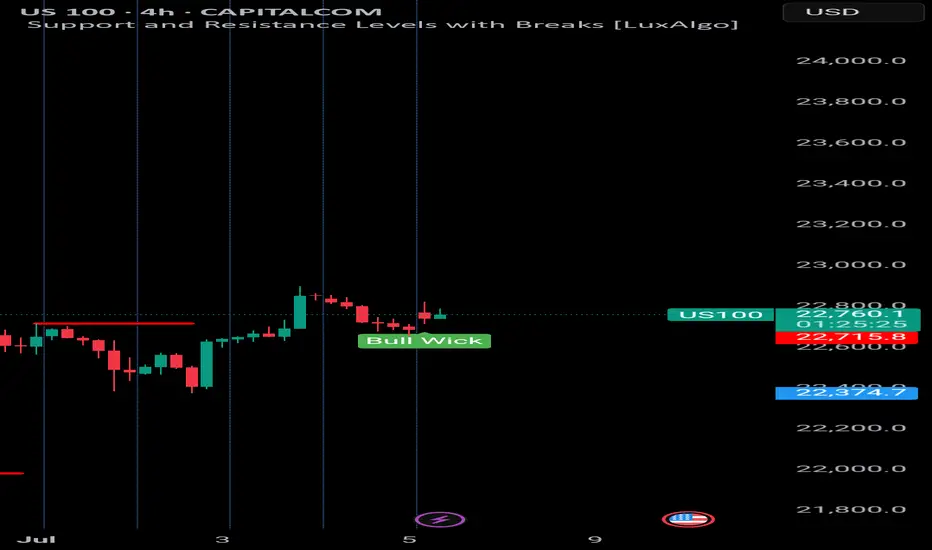
- *Current Price:* 22,764
- *Structure:* Market rejected downside strongly with a *Bull Wick* (demand zone reaction).
- *RSI (14):* 60.38
- Momentum is rising again, just under overbought.
- *Bearish divergence* still visible, but price is defending structure.
---
*📌 Key Levels:*
- *Support:* 22,715
- *Resistance:* 22,865 → 23,000
- *Strong Bullish Zone:* 22,720–22,750
---
*📈 Trade Idea: BUY Setup*
- *Entry:* 22,760–22,770
- *SL:* 22,690 (below wick)
- *TP1:* 22,865
- *TP2:* 23,000
- *TP3 (optional):* 23,150 if breakout occurs
---
*🧠 Smart Money View:*
- Likely a *liquidity sweep* below wick zone.
- Demand zone got respected → smart money possibly reloading longs.
- If next candle closes bullish, more confirmation for continuation.
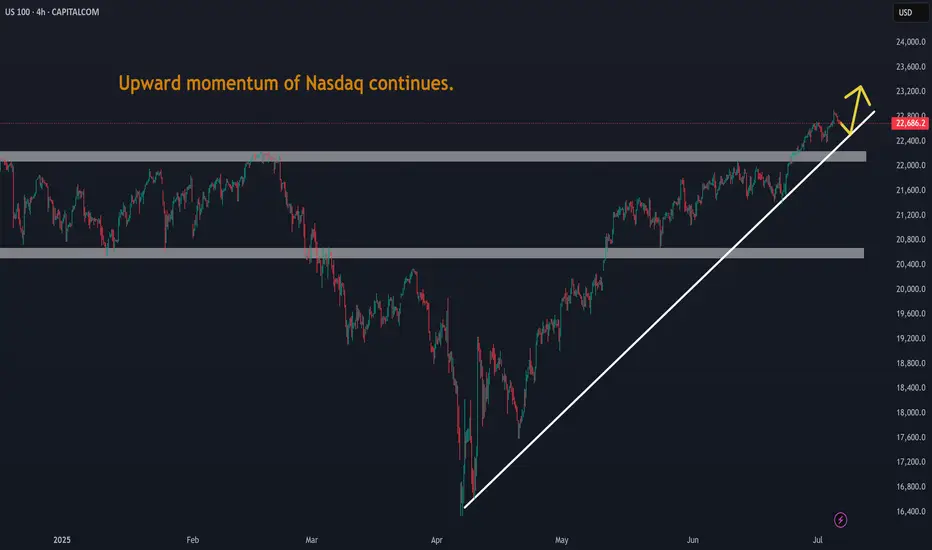
Upward momentum of Nasdaq continues.Upward momentum of Nasdaq continues. Geo-political Tensions cooling down.
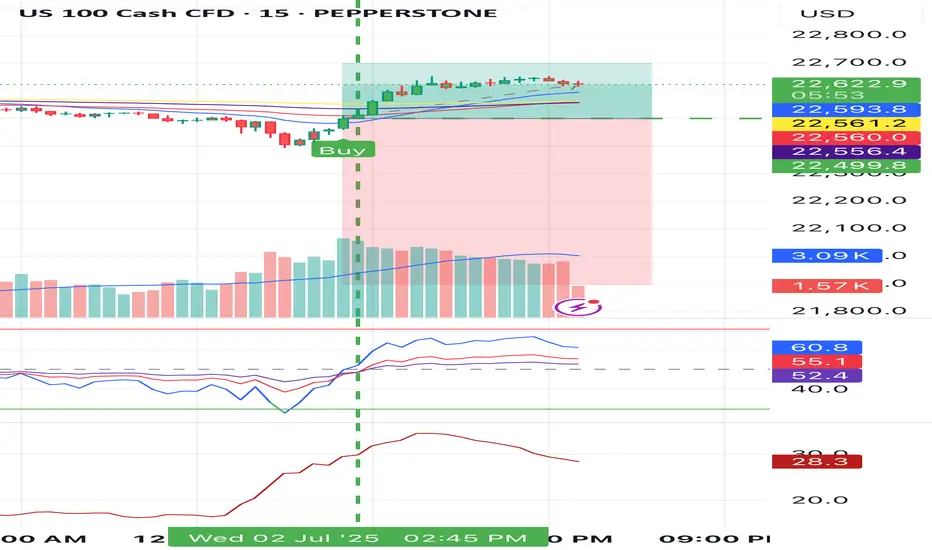
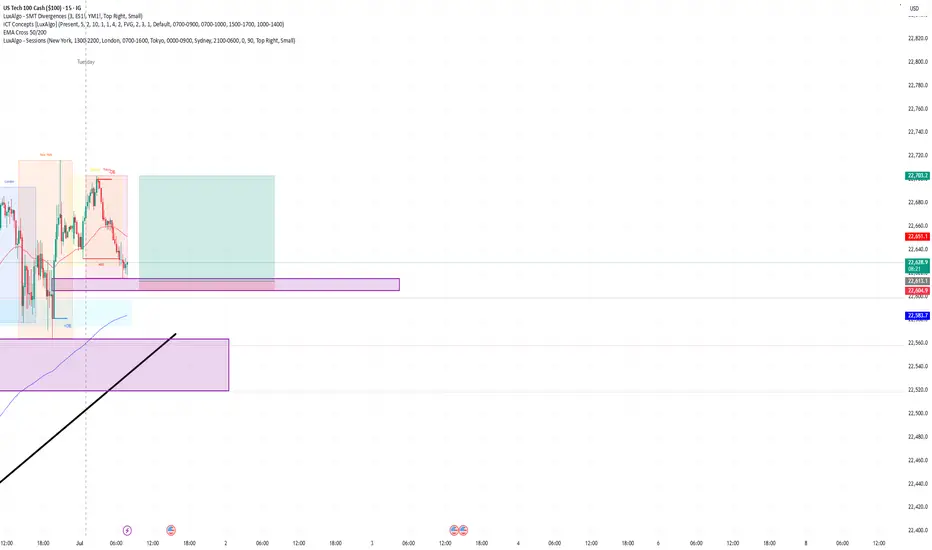
Discount Zone Reversal Play Entered a long position after identifying an short formed W formation within discount territory, mapped from yesterday’s high–low range. Price action showed clear structural symmetry, with the second leg completing at a key demand zone.
📌 Buyside liquidity at 22,692.27 acted as the inducement level—price swept it and respected the zone, signaling smart money accumulation.
Key Confluences:
- Extended W structure with balanced legs and volume support
- Price operating below EQ before trigger, favoring bullish reversal
- TP placed just above EQ to anticipate reaction without overextending
- Structure confirmed by neckline retest and bullish candle ignition
This setup aligns with a classic liquidity sweep and reversal narrative, targeting measured premium zones while managing drawdown with tight risk control. The trade is guided by structure, liquidity, and session timing—a patient play with clean narrative flow.
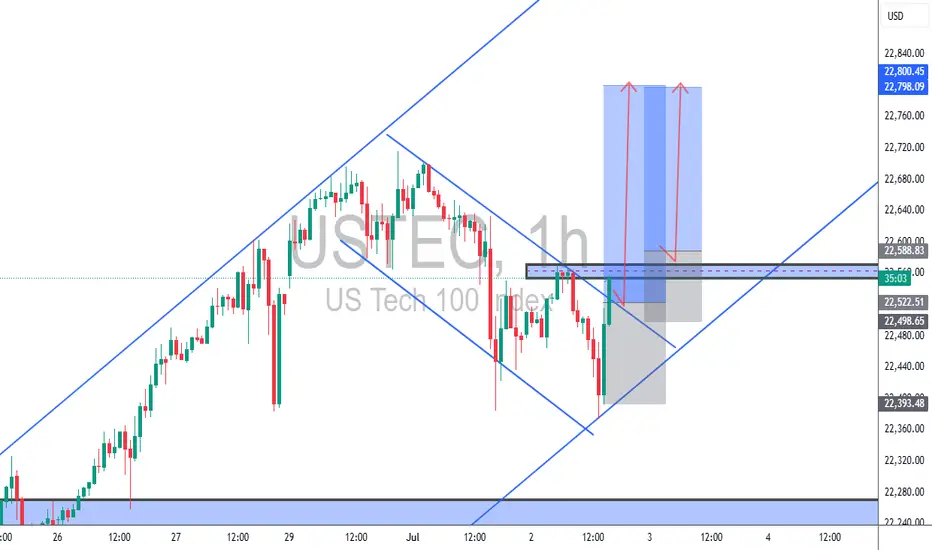
USTEC 15M Trade Setup Analysis (TCB Strategy)📊 USTEC 15M Trade Setup Analysis (TCB Strategy)
Trade Type: Countertrend Breakout -> Continuation
Symbol: USTEC (NASDAQ 100 Index)
Timeframe: 15-Minute
Entry Zone: Around 22,500
Resistance Zone: 22,587.90
Target: 22,865.84
Stop Loss: 22,458.87
Risk–Reward: 1:3 (approx)
Structure: Falling wedge breakout into bullish channel
Setup Confidence Score: 95%
📝 Analyst Notes
Price is breaking out from a well-defined falling wedge within a rising channel. Entry around 22,500 is based on breakout momentum, with SL tucked under structure. A retest entry would offer added confluence. Resistance at 22,587.90 is critical—a break and hold above confirms bullish strength toward the 22,865 target.
🎯 Execution Plan
Option 1: Aggressive entry near 22,500–22,540 (early breakout)
Option 2: Wait for clean retest of wedge breakout or 22,500 zone
Target: 22,865 (upper channel boundary)
SL: 22,458 or below the recent structure low
R:R: ~1:3 — very favorable
🟢 Verdict
This is a high-quality TCB setup, especially if we get a retest confirmation. The bounce off channel support + wedge breakout = excellent confluence.
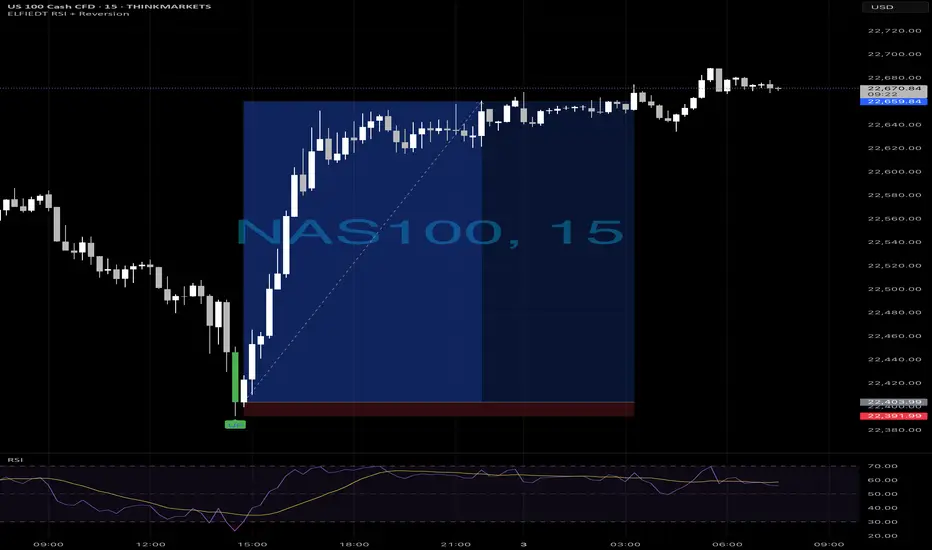
Ustec - longs📈 NAS100 Long Reversal — Powered by ELFIEDT RSI + Reversion Indicator
Timeframe: 15-min
Instrument: NAS100 (US Tech 100)
⸻
✅ Signal Setup (Long Entry)
This clean reversal was captured using my custom ELFIEDT RSI + Reversion indicator, which detects:
• RSI-based exhaustion conditions
• Precise reversal signals (green “UP” label on the chart)
• Trend-aligned confirmations
⸻
📌 Entry Criteria:
1. Oversold RSI conditions signaled potential exhaustion of the downtrend.
2. A clear bullish reversal candle closed with confirmation from the indicator.
3. The “UP” label marked the ideal entry candle just before the impulsive breakout.
4. RSI momentum shifted positively at the point of signal.
⸻
🎯 Execution Plan:
• Entry: At close of the signal candle with the “UP” label
• Stop-Loss: Placed just below the recent swing low (see red zone on chart)
• Target: Up to previous intraday structure and recovery zone
⸻
💡 Key Observations:
• Early signal allowed high RR entry before breakout
• RSI structure confirmed direction shift
• Strong sustained price action into close
⸻
📚 Learn More:
This trade is part of a larger system combining:
• RSI signal dynamics
• Momentum shift detection
• Session and structure alignment
If you’d like more information about the indicator or how to use it in your own strategy, feel free to follow or reach out.
#NAS100 Buy 22499.8#NAS100 Buy 22499.8
SL 21899.8
TP 22699.8
TP 23499.8
TP 24899.8
Trade at your own risk
Protect your capital
The Wizard 🧙♂️ SWFX
ICTTrading foreign currencies can be a challenging and potentially profitable opportunity for investors. However, before deciding to participate in the Forex market, you should carefully consider your investment objectives, level of experience, and risk appetite. Most importantly, do not invest money you cannot afford to lose.
There is considerable exposure to risk in any foreign exchange transaction. Any transaction involving currencies involves risks including, but not limited to, the potential for changing political and/or economic conditions that may substantially affect the price or liquidity of a currency. Investments in foreign exchange speculation may also be susceptible to sharp rises and falls as the relevant market values fluctuate. The leveraged nature of Forex trading means that any market movement will have an equally proportional effect on your deposited funds. This may work against you as well as for you. Not only may investors get back less than they invested, but in the case of higher risk strategies, investors may lose the entirety of their investment. It is for this reason that when speculating in such markets it is advisa

Usrec longs after drop📈 US Tech 100 | 15-Min Chart
✅ Live Trade Example using ELFIEDT RSI + Reversion
⸻
This setup was captured using the ELFIEDT RSI + Reversion indicator. A clean BUY signal was triggered after an extended move, followed by a sharp reversal — perfectly timed and visually confirmed by the indicator’s built-in logic.
💡 The result? A precise entry with a strong follow-through.
This tool is built to spot high-probability reversals with confluence — across timeframes, instruments, and volatility conditions.
⸻
👥 Want to trade with structure and clarity?
Join our community of traders who use this system daily to simplify their decisions and sharpen their edge.
📩 Comment “🔥” or send a DM to learn more.

Nas100With speculation about no rate cuts we can expect to see Nas100 plumet with Fed Powells upcoming speech.
If we look at the technical side we can see that Nas has been somewhat consolidating over the past 2 days creating a fair amount of Sell side liquidity. We can expect Powell to speak about rat cuts today in his upcoming speech and we will use this to our advantage waiting for early buyers to push up the market triggering our setup.
We can look for a plus minus 100 pip move before Nas turns around, we will however closely monitor the movement of Nas now until the speech so that we can execute a trade with the least amount of risk.
Remember to like and subscribe for more A+ setups.
London session long 01/07/2025Clear AMD, london manipulates into remaining 15min fvg, aim for asian highs.
Overfitting Will Break Your Strategy — Here’s Why█ Why Your Backtest Lies: A Quant’s Warning to Retail Traders
As a quant coder, I’ve seen it time and again: strategies that look flawless in backtests but fall apart in live markets.
Why? One word: overfitting.
Compare the signals in the images below. They’re from the same system, but one is overfitted, showing how misleading results can look when tuned too perfectly to the past.
⚪ Overfitting is what happens when you push a strategy to perform too well on historical data. You tweak it, optimize it, and tune every rule until it fits the past perfectly, including every random wiggle and fluke.
To retail traders, the result looks like genius. But to a quant, it’s a red flag .
█ Trading strategy developers have long known that “curve-fitting” a strategy to historical data (overfitting) creates an illusion of success that rarely holds up in live markets. Over-optimizing parameters to perfectly fit past price patterns may produce stellar backtest results, but it typically does not translate into real profits going forward.
In fact, extensive research and industry experience show that strategies tuned to past noise almost inevitably disappoint out-of-sample.
The bottom line: No one succeeds in markets by relying on a strategy that merely memorized the past — such “perfect” backtests are fool’s gold, not a future edge.
█ The Illusion of a Perfect Backtest
Overfitted strategies produce high Sharpe ratios, beautiful equity curves, and stellar win rates — in backtests. But they almost never hold up in the real world.
Because what you’ve really done is this:
You built a system that memorized the past, instead of learning anything meaningful about how markets work.
Live market data is messy, evolving, and unpredictable. An overfit system, tuned to every quirk of history, simply can’t adapt.
█ A Warning About Optimization Tools
There are many tools out there today — no-code platforms, signal builders, optimization dashboards — designed to help retail traders fine-tune and "optimize" their strategies.
⚪ But here’s the truth:
I can't stress this enough — do not rely on these tools to build or validate your strategy.
They make it easy to overfit.
They encourage curve-fitting.
They give false hope and lead to false expectations about how markets actually work.
⚪ The evidence is overwhelming:
Decades of academic research and real-world results confirm that over-optimized strategies fail in live trading. What looks good in backtests is often just noise, not edge.
This isn’t something I’ve made up or a personal theory.
It’s a well-documented, widely accepted fact in quantitative finance, supported by decades of peer-reviewed research and real-world results. The evidence is overwhelming. It’s not a controversial claim — it’s one of the most agreed-upon truths in the field.
█ Why Overfitting Fails
Let me explain it like I do to newer coders:
Random patterns don’t repeat: The patterns your strategy "learned" were noise. They won't show up again.
Overfitting kills the signal: Markets have a low signal-to-noise ratio. Fitting the noise means you've buried the signal.
Markets change: That strategy optimized for low-volatility or bull markets? It breaks in new regimes.
You tested too many ideas: Try enough combinations, and something will look good by accident. That doesn’t make it predictive.
█ The Research Backs It Up
Quantopian’s 888-strategy study:
Sharpe ratios from backtests had almost zero predictive power for live returns.
The more a quant optimized a strategy, the worse it performed live.
Bailey & López de Prado’s work:
After testing enough variations, you’re guaranteed to find something that performs well by chance, even if it has no edge.
█ My Advice to Retail Traders
If your strategy only looks great after a dozen tweaks… It’s probably overfit.
If you don’t validate on out-of-sample data… you’re fooling yourself.
If your equity curve is “too good” to be true… it probably is.
Real strategies don’t look perfect — they look robust. They perform decently across timeframes, markets, and conditions. They don’t rely on lucky parameter combos or obscure filters.
█ What to Do Instead
Use out-of-sample and walk-forward testing
Stick to simpler logic with fewer parameters
Ground your system in market rationale, not just stats
Risk management over performance maximization
Expect drawdowns and variability
Treat backtest performance as a rough guide, not a promise
Overfitting is one of the biggest traps in strategy development.
If you want your trading strategy to survive live markets, stop optimizing for the past. Start building for uncertainty. Because the market doesn’t care how well your model memorized history. It cares how well it adapts to reality.
-----------------
Disclaimer
The content provided in my scripts, indicators, ideas, algorithms, and systems is for educational and informational purposes only. It does not constitute financial advice, investment recommendations, or a solicitation to buy or sell any financial instruments. I will not accept liability for any loss or damage, including without limitation any loss of profit, which may arise directly or indirectly from the use of or reliance on such information.
All investments involve risk, and the past performance of a security, industry, sector, market, financial product, trading strategy, backtest, or individual's trading does not guarantee future results or returns. Investors are fully responsible for any investment decisions they make. Such decisions should be based solely on an evaluation of their financial circumstances, investment objectives, risk tolerance, and liquidity needs.
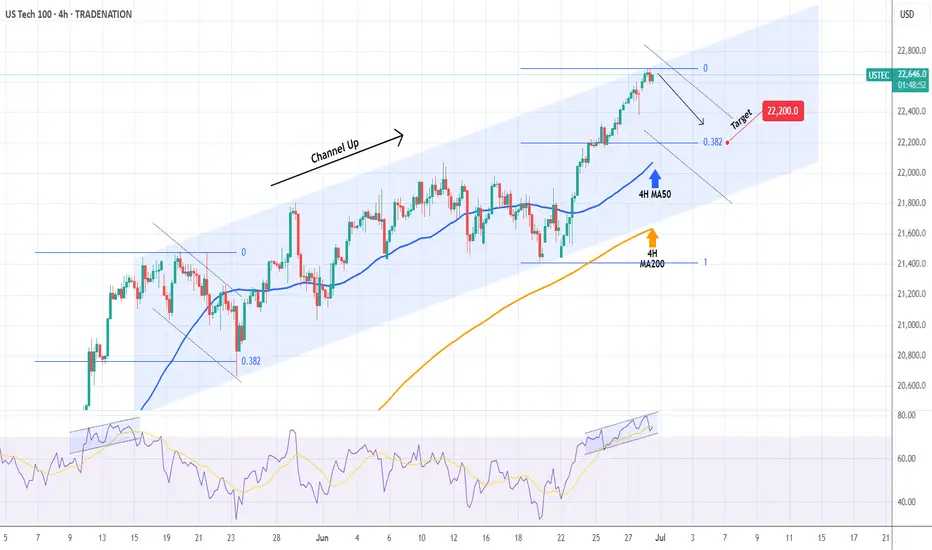
NASDAQ Possible short-term pull-back.Last time we analyzed Nasdaq (NDX) was a week ago (June 23, see chart below), giving a comfortable buy signal as the price was rebounding at the bottom of the 6-week Channel Up:
The price hit our 22300 Target and has now touched the top of the Channel Up. Based on the 4H RSI, it resembles the May 15 price action, which soon after pulled back to the 0.382 Fibonacci retracement level.
It is possible to see such relief profit taking on the short-term and a test of 22200 (Fib 0.382).
-------------------------------------------------------------------------------
** Please LIKE 👍, FOLLOW ✅, SHARE 🙌 and COMMENT ✍ if you enjoy this idea! Also share your ideas and charts in the comments section below! This is best way to keep it relevant, support us, keep the content here free and allow the idea to reach as many people as possible. **
-------------------------------------------------------------------------------
Disclosure: I am part of Trade Nation's Influencer program and receive a monthly fee for using their TradingView charts in my analysis.
💸💸💸💸💸💸
👇 👇 👇 👇 👇 👇
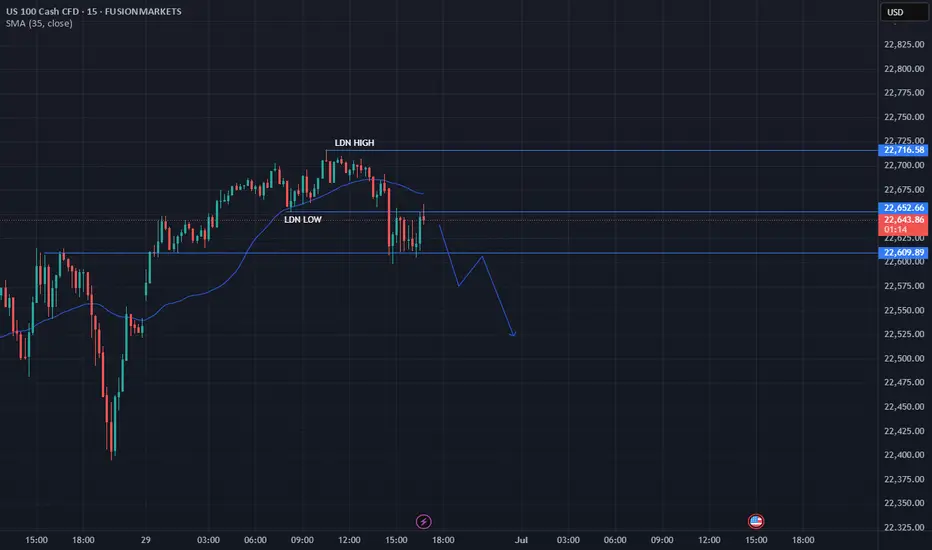
Bullish BiasMarked the LDN highs and lows, Waited for the sweep of sell side liquidity on LDN lows, waiting for BOS and CHoCH and FVG before we enter buys back to the SSL at the London highs.

USNAS100 |Bullish Trend Holds Above Pivot – Eyeing 22790 & 23000USNAS100 | Bullish Movement
The price has stabilized above the key pivot level at 22640, confirming a continuation of the bullish trend toward the next resistance at 22790.
As long as the index remains above 22640, the uptrend is expected to extend toward 22790 and potentially 23000, with minor pullbacks likely to retest the pivot.
Currently, USNAS100 is consolidating between 22640 and 22790.
A 1H candle close below 22640 would signal a bearish correction toward 22520 and possibly 22410.
Pivot Line: 22640
Resistance Levels: 22790, 23000
Support Levels: 22520, 22410
previous idea:

NAS100 Will Go Up From Support! Buy!
Please, check our technical outlook for NAS100.
Time Frame: 9h
Current Trend: Bullish
Sentiment: Oversold (based on 7-period RSI)
Forecast: Bullish
The market is approaching a key horizontal level 21,651.9.
Considering the today's price action, probabilities will be high to see a movement to 22,171.9.
P.S
We determine oversold/overbought condition with RSI indicator.
When it drops below 30 - the market is considered to be oversold.
When it bounces above 70 - the market is considered to be overbought.
Disclosure: I am part of Trade Nation's Influencer program and receive a monthly fee for using their TradingView charts in my analysis.
Like and subscribe and comment my ideas if you enjoy them!
