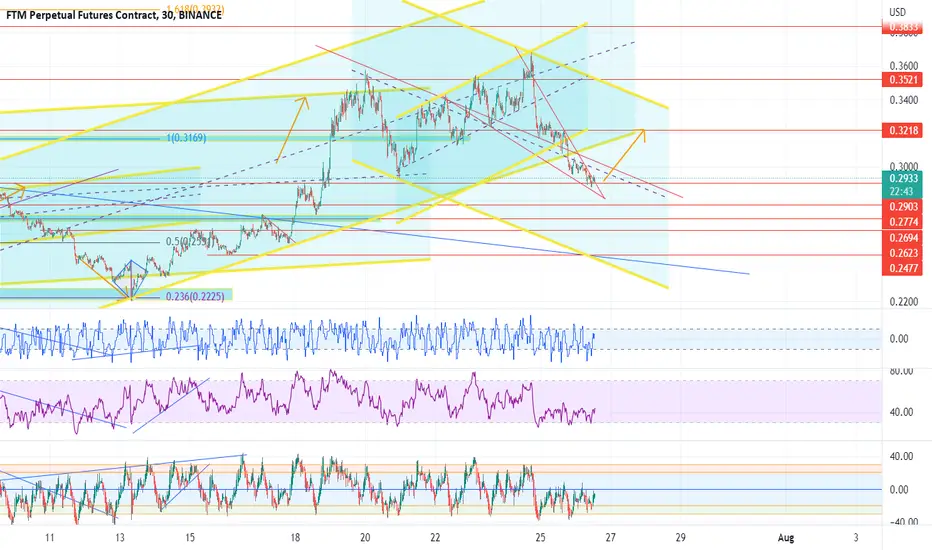
FTMI expect to achieve the above goals on a daily basis over the next few days. I am quite sure about this because I tracked all the times especially 4 hours and 1 day.
But on a weekly basis, the situation is quite complicated, it may find resistance at the 0.37 level and turn bearish.
FTMUSD trade ideas
FTMUSD Rising Wedge Break BINANCE:FTMUSD
Volume profiles show resistance could not be broken
Rising Downward Velocity
MACD Signal Down
Weis Wave Volume decreasing
Over extended rising wedge break abt 75% vs 64%
Price Objective back to longer term trend line.

FTM; we MAY have hit a new range bottomFTM; we MAY have hit a new range bottom
got my beady eye on this mofo
maybeeeeee range bottom here; looks very similar RSI pattern wise. would make quite a bit of sense to get some relief soon after all this bloodshed and misery that has been inflicted.
im quite hung over so thats it.
ps ; read Arthurs latest blog article. VERY good imo.

FTM the long play just a long term view on FTM even with price drops it has stayed in its long term up trend plus good ecosystem that's growing more n more
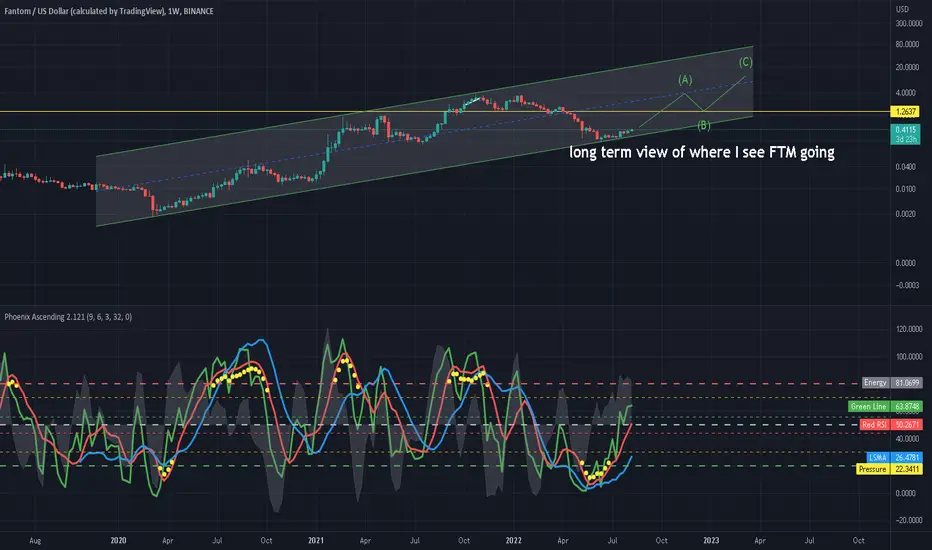
FTMUSD (W)BINANCE:FTMUSD
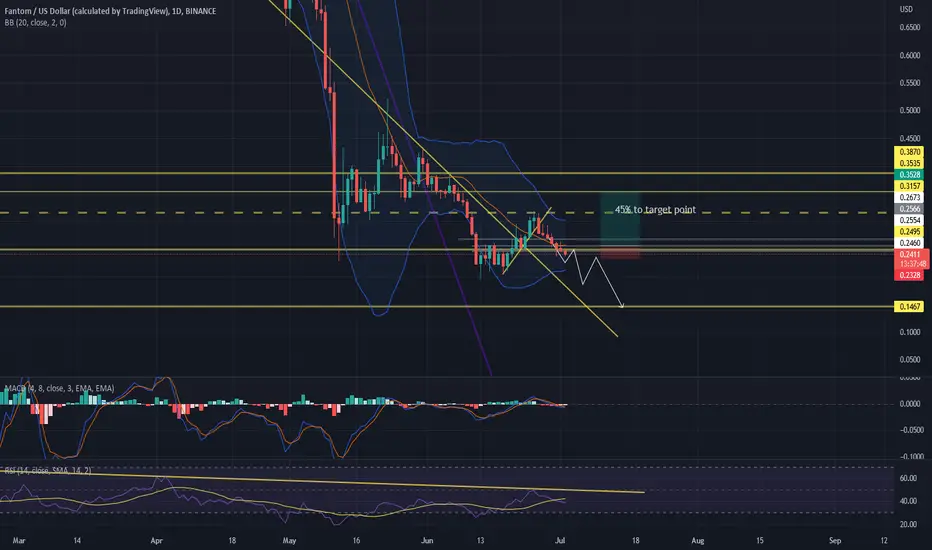
Everything depends on the Total Market Cap, which I published an analysis of earlier. If the market cap stabilizes above the red resistance (in the analysis I have published) and does not return below it, we can expect the FTM price to grow to ranges such as $0.91, $1 and also $4 and $10 in the longer term. If the market cap does not go according to my analysis, we can expect FTM to exit its channel to a range like $0.183, $0.153 and below. Be sure to check the Total Market Cap chart.
(This is just a personal idea. Don't just make a decision based on this opinion).

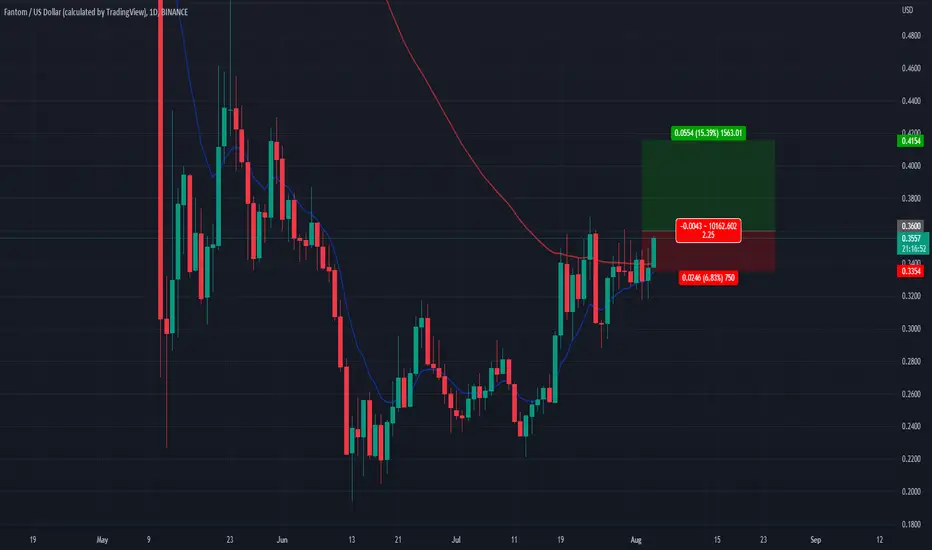
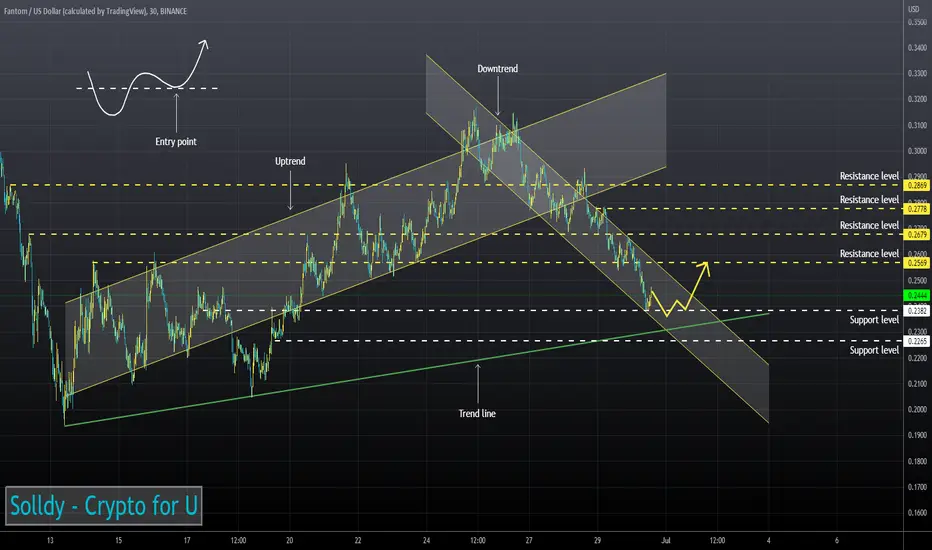
Quick Trade on FantomBINANCE:FTMUSD
With stop below today’s candle, here is a quick trade, with target around previous high of around $0.41 USD. Seems ready to breakout.
Risk-Reward 2.25 to 1.
Use proper risk management when trading (Entry – Stop = 4% or less of Capital)
Not a recommendation.
Good luck to you.
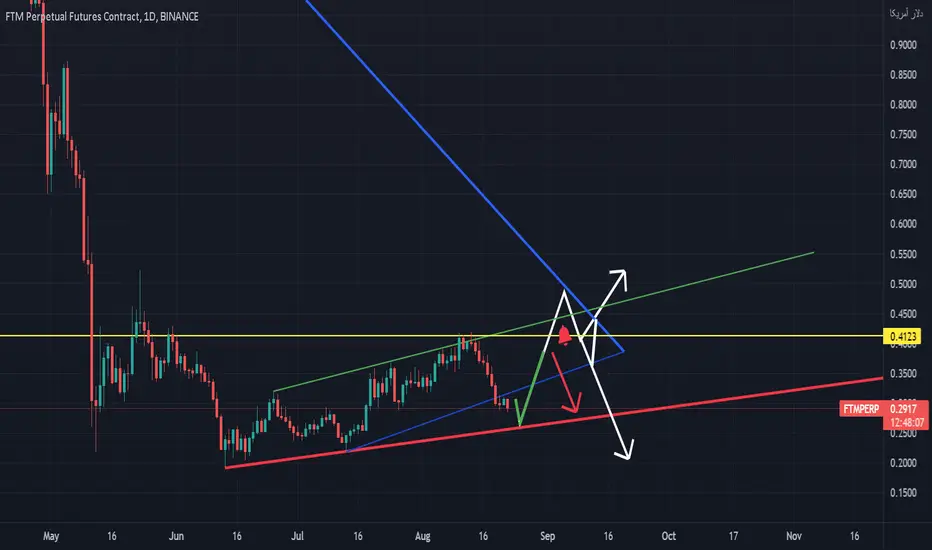
FTMkeeping it simple here, I see only 3 waves up & down so that = corrections.
We must watch to see how the pump evolves to know if we finally have an impulsive move up or not.
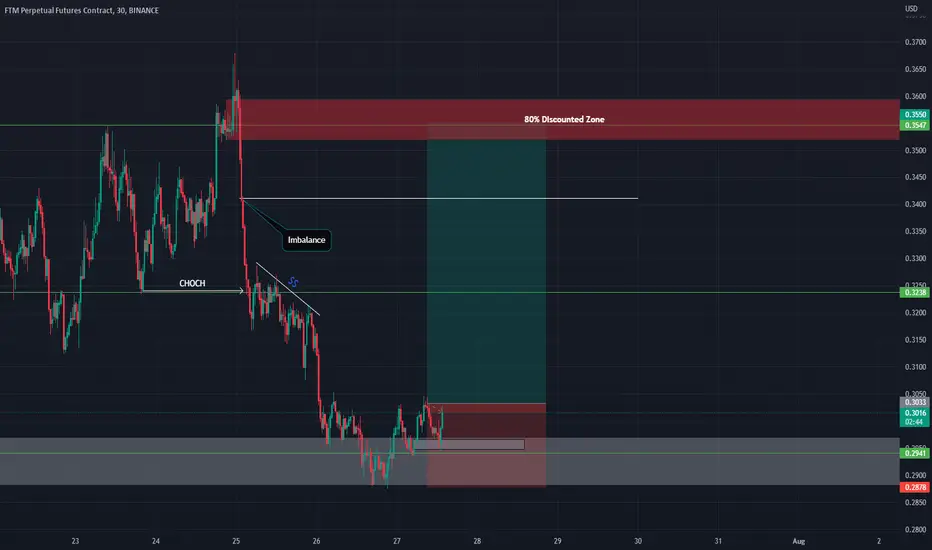
Analysis on Ftm Spotted a change of character on the 1hr time frame, a minor break of structures to the upside on 5mins and 15min time frame, area of liquidity to be taken out at the (0.3238) zone before proper mitigation to the order block to the downside on the 80% discounted zone. However, you could long directly to Ob Trade safe these are volatile periods
entry :0.3033
stop-loss: 0.2878
TP 1: 0.3411
TP 2 : 0.3550
risk 5-10x
(Ps smart money concepts)
FTM falling wedgeFTM broke down from multiple rising channels and is in a very bearish configuration. But price action is in falling wedge, and retest of the rising channel is possible.
Fantom FTM Long-term AnalysisHello friends,
I'm going to study long term FTM. It is indeed one of the most robust projects when you look at on-chain data and wallet movements.
We see that the uptrend from 0.0017 USD has been broken and has received a bearish confirmation.
If we consider USD 0.0106 as strong support, we have reacted as both trend and 0.5 fib support.
But do not be in a hurry to create a new uptrend.
The area where it will be accumulated is very important.
Finally, if we close below the green support channel, the support points that buyers and liquidation hunters are waiting for are indicated on the chart.
In order to create a possible bear flag from here, we can expect an increase to 0.72 cents.
It creates the opportunity for a person who wants to accumulate from this region to sell half of it twice.
Those who bought at the Fib 0.5 support sold half of the doubles. For accumulation, my advice is to wait for positive dissonances and support points that may occur in the 4H graph.
Don't worry, if you're patient, it won't flight without you. If you are inside at the right time, you will be the most profitable.
I wish you good luck.

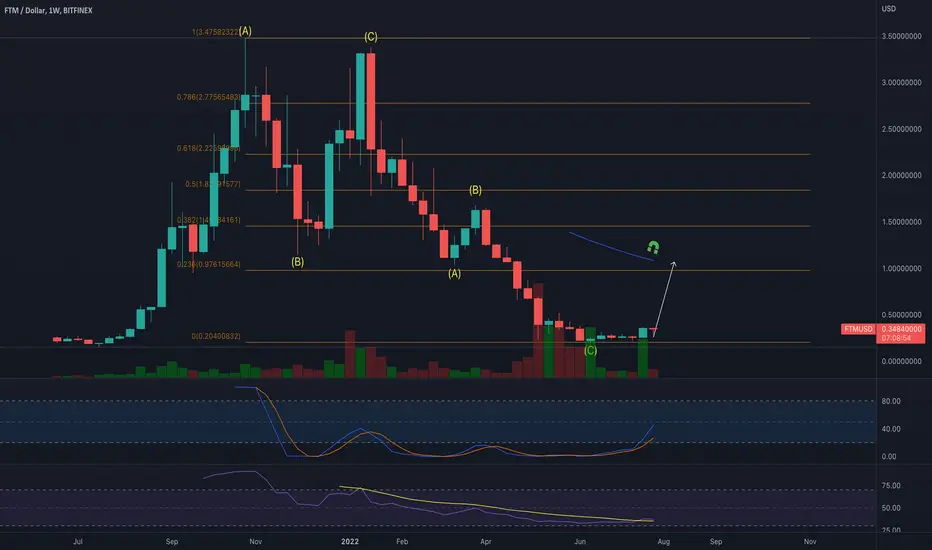
FTM/USDT Elliott Wave countFantom ended an abc correction to the upside and now formed a wave A or 1 to the donwnside

FTMUSD ❕ Is it the end of declining?Fantom is moving in an upward channel within the liquidity zone.
Trading volumes show uncertainty.
Price has tested 100MA as support.
FTM has moved into the bullish zone RSI (30m TF)
I expect the continuation of growth after fixing above the resistance level.

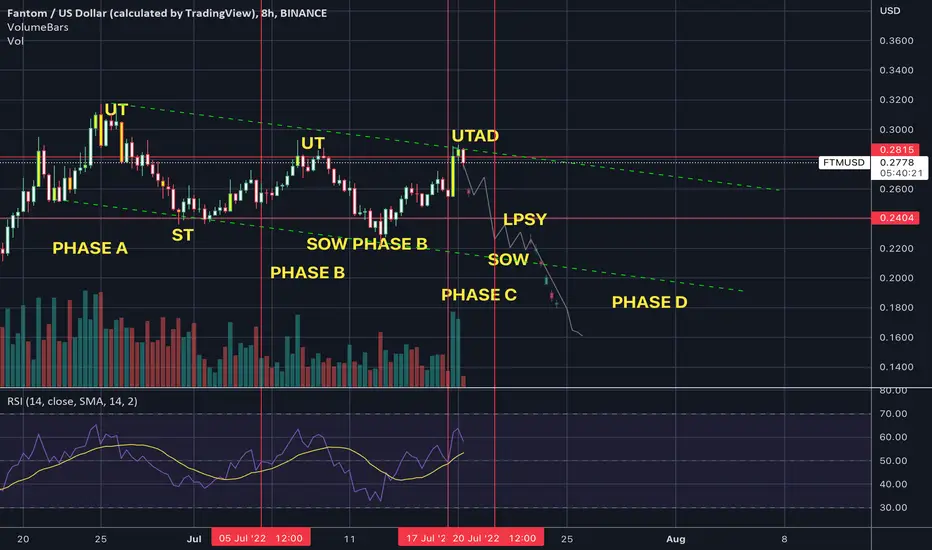
FTMUSD - SHORTHey guys. Some distro happening. Could be accumulation but it doesn't look promising.
SHORT TP: $.06
EZ clap :)

FTM possible bounceMarket looks like it will stop falling for now. There is short term accumulation.

FTM LONGThis is my short-term analysis, of course short-term there are dangerous changes, please see my chart for a good way.
FTMUSD ❕ strong levelsFantom holds a strong support level.
TD Sequential - up reversal signal (30m, 1H and 4H TFs)
Price has exited the oversold zone of the RSI (30m and 1H TFs).
BB indicator - the asset is oversold (4H TFs)
I expect that FTM may retest the support level, but after fixing above it will start to bounce.
FANTOM PATH TO $10 MINIMUM..Fantom shows strenght for a next wave to ATH. Still looking at the project a minimum of $10 should be achievable.

FTM 1h longSetup: In these kind of relief rally, you are looking to long crypto that outperforms BTC and has broken out of its accumulation phase. FTM is one of them. it has broken out of its accumulation range for both its US and BTC pairing with volume supporting it.
Entry: 0.29125
Trailing SL: Trial using the SAR indicator
TP: 0.36

FTM, along the trend line.The following are machine translations:
In the 4-hour chart, it rebounded in the medium and long-term period, and the low point of the callback was gradually raised, forming an upward trend line, and this rebound was walking along the upward trend line. At present, a short-term downtrend line has also formed to suppress and step back. The medium and long-term uptrend line and the short-term downtrend line form a triangle shape, which is gradually narrowing, and the direction is about to be selected. A step back to the uptrend line is now possible, try a short long.
From the perspective of indicators, the energy column of the macd indicator is gradually approaching the zero axis, forming a bullish trend. The rebound of the RSI indicator is blocked at the neutral 50, and the bears are stronger than the bulls, and they may step back near the oversold zone.
In operation, judging from the indicators and the current trend, it is possible to step back on the rising trend line, but at the trend line, the RSI indicator may reach an oversold state, and the macd is still in an upward trend, so do it at the rising trend line. More, looking at the vicinity of 0.42, below the trend line point stop loss.

milked this rangecollected profit at the lows and reentered shorts at the highs lol
i expect a relief rally soon
