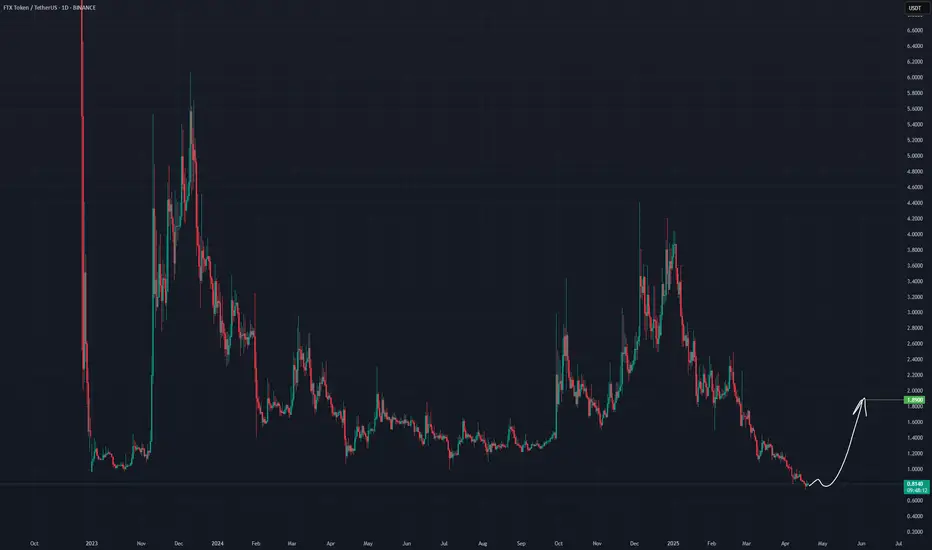
Is FTT token about to print a 400% move?On the above 5 day chart price action has corrected over 70% throughout 2024. A number of reasons now exist to be bullish. They include:
1) Price action and RSI resistance breakouts.
2) Trend reversal. Notice the higher low?
3) The trend reversal follows strong bullish divergence, which has now co

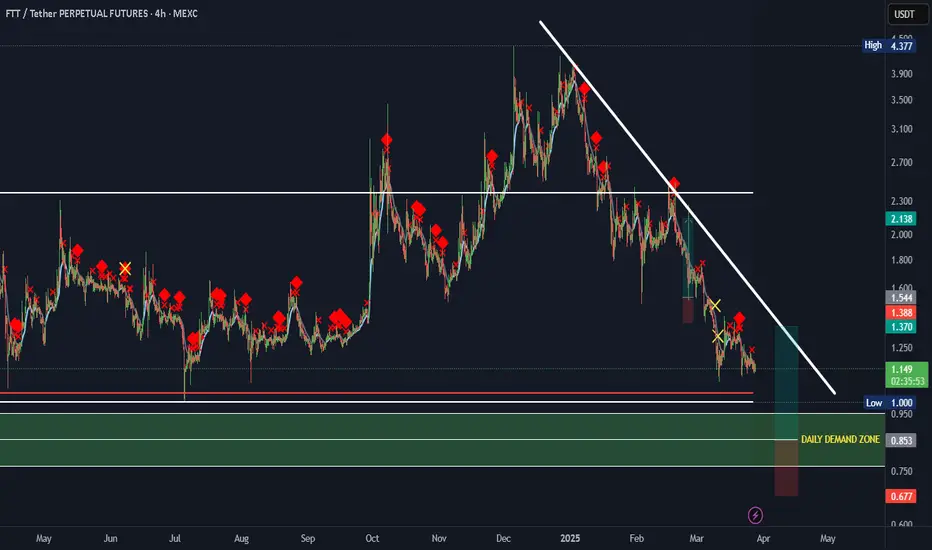
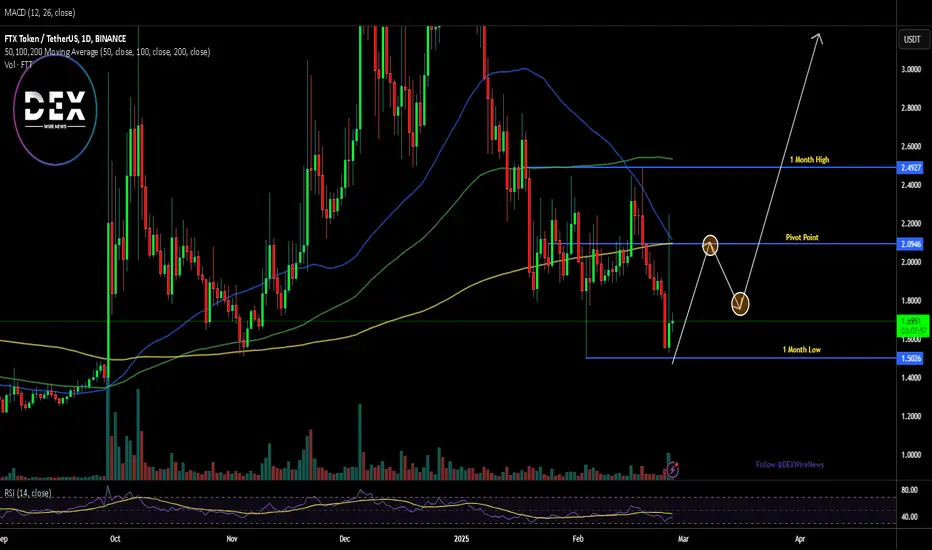
FTT Breakout soonWaiting for breakout this resistant line
You can buy some after breakout with a short -term target of at least 10%+.
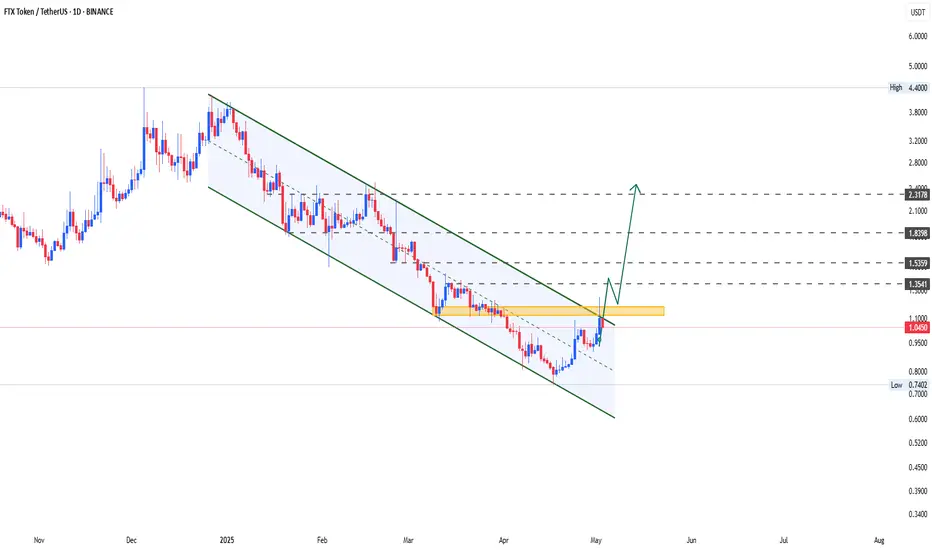
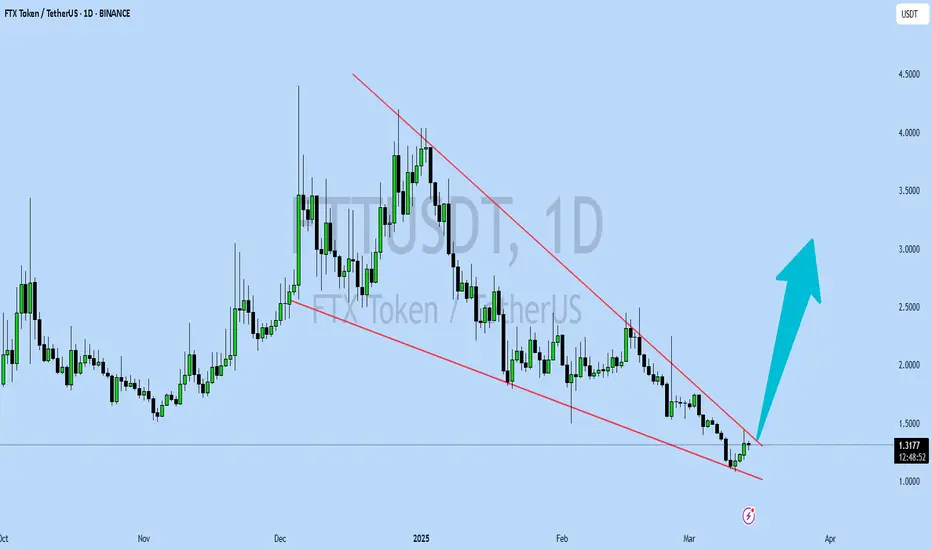
FTTUSDT 1D AnalysisFTT ~ 1D Analysis
#FTT Buy gradually from here if you still have a Conviction on this coin with a short -term target of at least 15%+ from here.
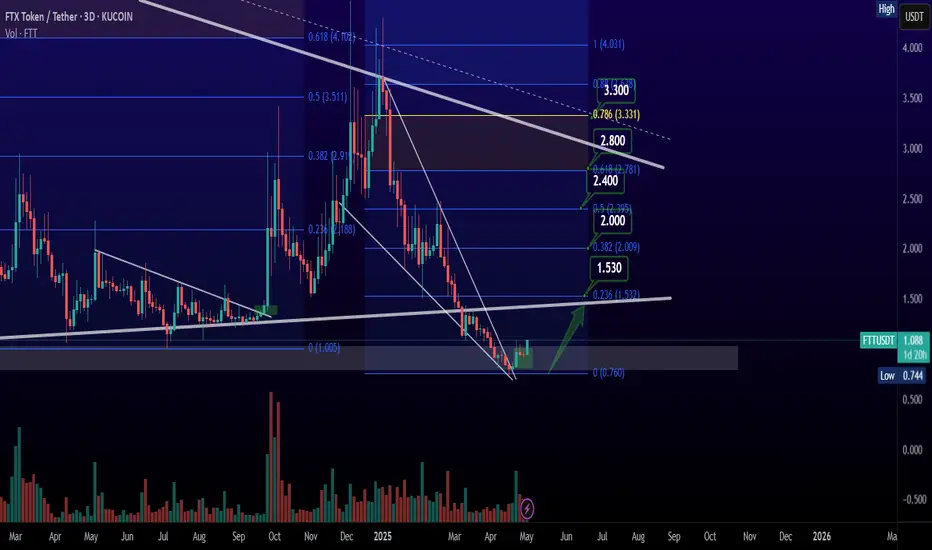
FTT - LongThe main target is $1.89, the waiting time is 1-3 months, the asset analysis is kept secret
(Not an investment recommendation)
FTT LONG SETUP ALL trading ideas have entry point + stop loss + take profit + Risk level.
hello Traders, here is the full analysis for this pair, let me know in the comment section below if you have any questions, the entry will be taken only if all rules of the strategies will be satisfied. I suggest you keep thi
#FTX/USDT#FTX
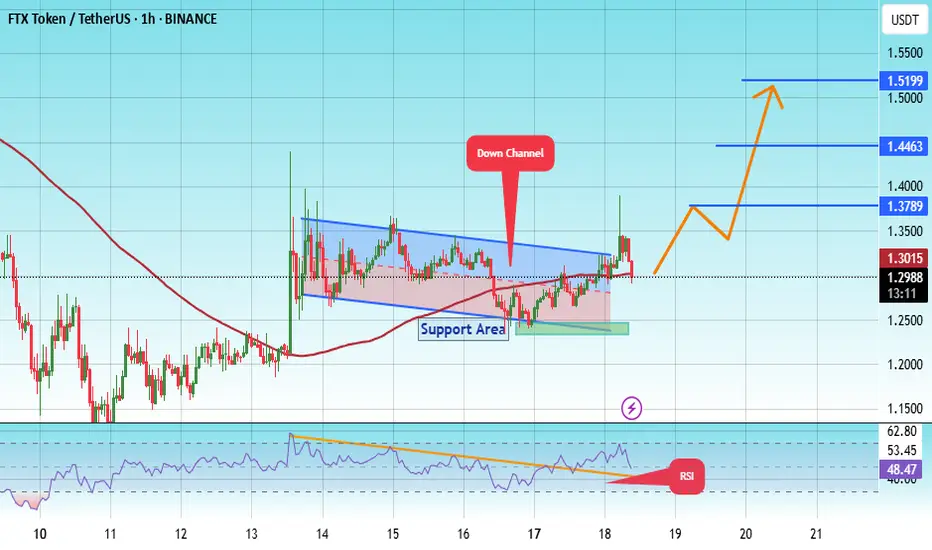
The price is moving within a descending channel on the 1-hour frame, adhering well to it, and is heading for a strong breakout and retest.
We are seeing a bounce from the lower boundary of the descending channel, which is support at 1.23.
We have a downtrend on the RSI indicator that is abou
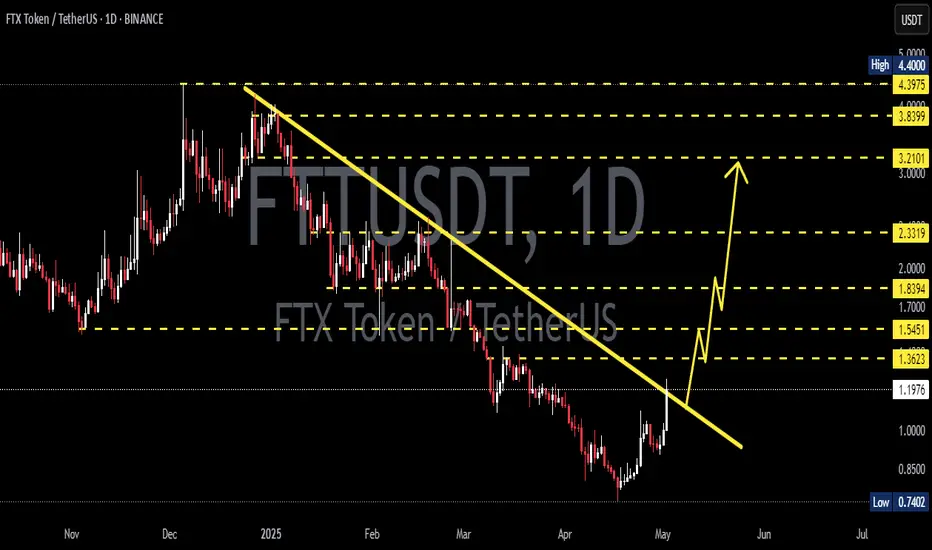
FTTUSDT UPDATEFTTUSDT is a cryptocurrency trading at $1.3195. Its target price is $3.0000, indicating a potential 100%+ gain. The pattern is a Bullish Falling Wedge, a reversal pattern signaling a trend change. This pattern suggests the downward trend may be ending. A breakout from the wedge could lead to a stron
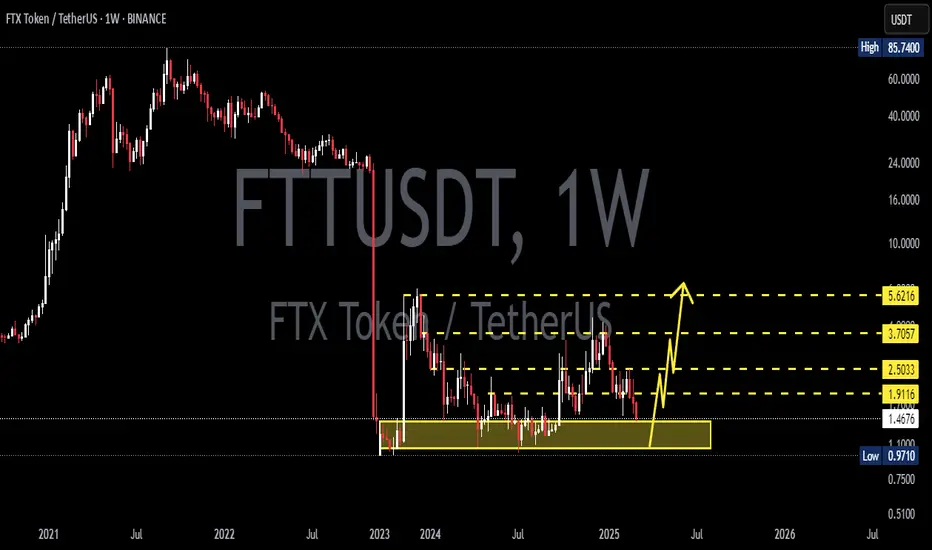
FTTUSDT 1WFTT ~ 1W Analysis
#FTT Buy gradually from here with a short -term target of at least 20%+.
Breaking: FTT Has to Break This Price Levels to Start A BullrunThe defunct platform native token TSX:FTT has been on a falling wedge lately losing about 50% of value as the long lasting lawsuit against her founders most especially Sam Bankman-fried is showing no signs of ending.
The token has long been oversold with the RSI at 38.45 further solidifying our
See all ideas
Summarizing what the indicators are suggesting.
Oscillators
Neutral
SellBuy
Strong sellStrong buy
Strong sellSellNeutralBuyStrong buy
Oscillators
Neutral
SellBuy
Strong sellStrong buy
Strong sellSellNeutralBuyStrong buy
Summary
Neutral
SellBuy
Strong sellStrong buy
Strong sellSellNeutralBuyStrong buy
Summary
Neutral
SellBuy
Strong sellStrong buy
Strong sellSellNeutralBuyStrong buy
Summary
Neutral
SellBuy
Strong sellStrong buy
Strong sellSellNeutralBuyStrong buy
Moving Averages
Neutral
SellBuy
Strong sellStrong buy
Strong sellSellNeutralBuyStrong buy
Moving Averages
Neutral
SellBuy
Strong sellStrong buy
Strong sellSellNeutralBuyStrong buy
Displays a symbol's price movements over previous years to identify recurring trends.