ger30 stay al art on ger30 we follow according to trend confirmation nothing by the best stay positive and download the cash please don't for get the rules and relegation of trading don't risk or over trader
GER40 trade ideas
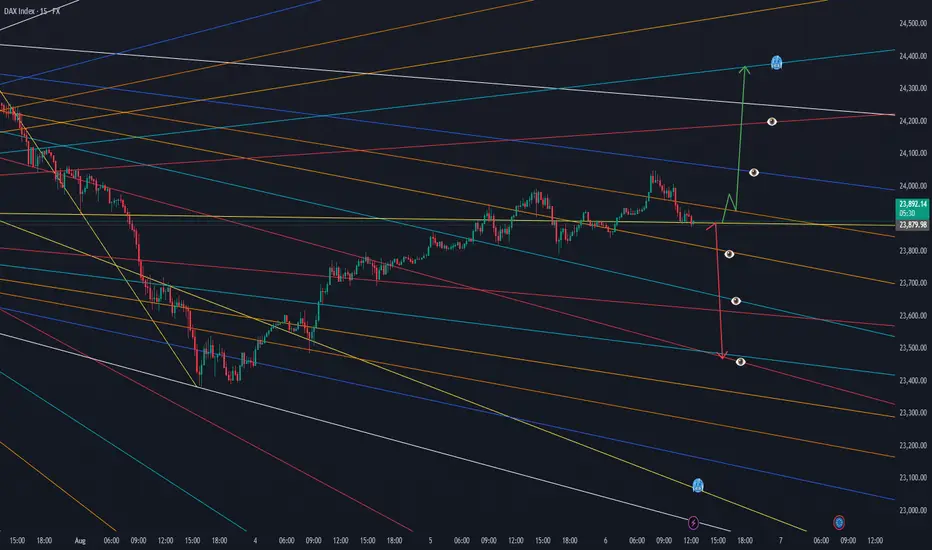
GER40 (DE40) SHORT - Double top 15minPotential short on GER40 with a double top on the 15min.
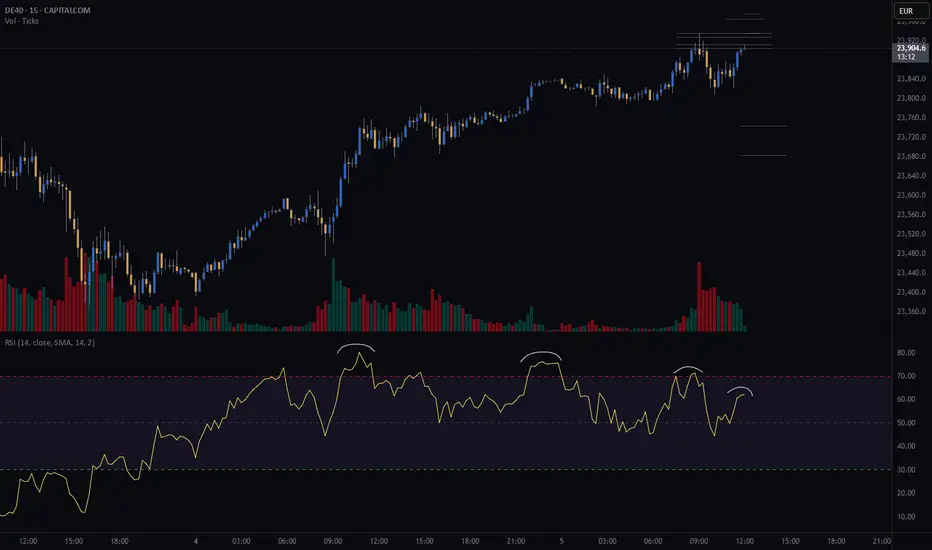
There is negative rsi divergence which is one of the indicators I use to look for double tops.
Still waiting on further confirmation before I take the trade.
Risk/reward = 3.2
Entry price = 23 905
Stop loss price = 23 965
Take profit level 1 (50%) = 23745
Take profit level 2 (50%) = 23684
What do you guys and girls think the GER40 is going to do from here?
Technical Analysis WeeklyGermany 40 is now in a range-bound environment, currently trading at 23,630, below its VWAP of 24,150 and close to StdDev #2 Lower. RSI at 43 reflects weakening momentum. Support lies at 23,630 and resistance is seen at 24,740
UK 100 continues its bullish trend, undergoing a small pullback. Price is at 9,102, just above its VWAP at 9059. RSI at 61 indicates steady bullish interest. Support is at 8,906 and resistance is at 9,212
Wall Street remains bullish but is now in a corrective phase. Price has dropped to 43,786, below its VWAP of 44,407. The RSI of 43 highlights growing downside pressure. Support is at 43,580, and resistance is at 45,253.
Brent Crude continues in a choppy range, albeit with lower volatility, trading at 6,932, right at its VWAP. The RSI at 50 confirms the lack of directional bias. Support sits at 6,631 and resistance at 7,198.
Gold continues to consolidate in a broad triangle pattern - keeping it in a neutral range, with price at 3,357, nearly equal to its VWAP. The RSI at 53 shows a balanced outlook. Support is at 3,280 and resistance at 3,416.
EUR/USD holds a bullish trend but is correcting. The pair trades at 1.1565, slightly below the VWAP of 1.1635. RSI at 45 reflects subdued buying pressure. Support is at 1.1435 and resistance at 1.1834.
GBP/USD has potentially entered a new bearish trend in a quick reversal from the prior uptrend. It trades at 1.3275, below the VWAP of 1.3404. The RSI of 36 signals fresh bearish momentum. Support is at 1.3204 and resistance at 1.3604.
USD/JPY remains neutral and in a range phase but is possibly building a new uptrend with its recent drop back from range resistance. Price is 147.95, aligned with the VWAP. RSI at 53 suggests a balanced tone. Support is near 145.95 and resistance stands at 149.88.
Dax short medium termBearish till 21.800 which is an important retest. SL on a daily close above 24.000
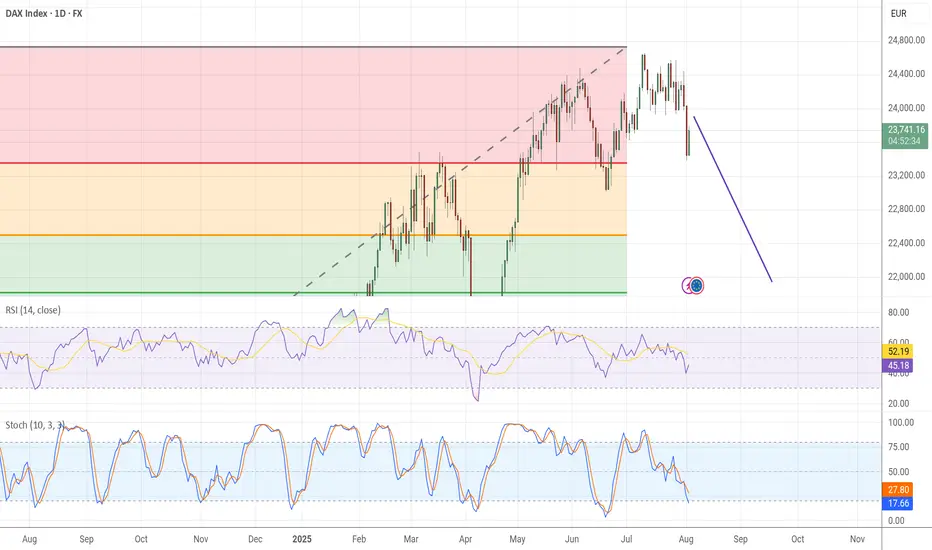
Germany 40DE40 Looks like doing this. It's going to retest an old area that was used bypassed while making an all time high.

GER40 ATH LOADINGIt as not been an easy week for the market. But we move, here on these post, i made analysis on EIGHTCAP:GER40 , Using the combination of dailytf, H4 and H2, For further clarification, pls see the video. All the best.


DAX - potential buyPotential buy on the German index as we are coming out of the 30min correction that followed a first small impulse to the upside. Conservative target is a move equivalent to the first 30 min setup. Optimal target are the break of the top and even better the 24.85 area. Levels on the chart. Trade with care.

DAX 24.07.2025~+ Post-trade deal risk-on seems to be subsiding
~+ Profit taking towards the ECB Rate decision

Technical Analysis WeeklyGermany 40 remains in a bullish trend and is currently in a pullback phase. It trades at 24,308, almost identical to its VWAP of 24,307.5. The RSI at 54 suggests a pause in momentum. Support is found at 23,786 and resistance at 24,650.
UK 100 is in an impulsive bullish phase, breaking above previous highs with price at 9,145 well above the VWAP at 8,970. The RSI is at 73, indicating strong buying pressure. Support is at 8,748 and resistance is at 9,101.
Wall Street continues its bullish trend, pausing near recent highs. The price is at 44,880, above its VWAP of 44,445. RSI at 63 confirms steady bullish momentum. Support sits at 43,921 and resistance at 44,880.
Brent Crude remains in a broad neutral trend with short-term range-bound action. Price is at 6,768, just under VWAP of 6,866. RSI at 45 reflects a lack of directional conviction. Support is at 6,717 and resistance at 7,015.
Gold continues to trade sideways within a broad range. It trades at 3,337, nearly equal to its VWAP. The RSI at 47 suggests balance. Support is found at 3,290 and resistance at 3,407.
EUR/USD holds a bullish trend while undergoing a correction. It trades at 1.1740, close to its VWAP at 1.1699. The RSI at 59 shows mild positive momentum. Support is at 1.1585 and resistance at 1.1814.
GBP/USD is in a bullish trend but under corrective pressure and seemingly turning rangebound. The price is 1.3433, slightly below the VWAP of 1.3511. RSI is at 42, hinting at waning momentum. Support is 1.3336, resistance at 1.3687.
USD/JPY continues in a neutral trend but could be about to break higher, currently ranging around 147.66 and VWAP at 147.00. RSI at 57 shows a modest bullish bias after having pulled back from overbought territory. Support is at 144.54 and resistance at 149.46.
GER40 | Cools Below ResistanceThe DAX rallied aggressively into 24,618.3, but price action has since turned sideways. The index is now ranging just below resistance, as bulls and bears battle for direction in this consolidation phase.
Support at: 24,000.00 / 23,687.21 / 23,500.00 / 23,047.01 🔽
Resistance at: 24,618.30 🔼
🔎 Bias:
🔼 Bullish: Clean break and close above 24,618.30 targets fresh highs.
🔽 Bearish: Break below 24,000 may confirm short-term distribution toward 23,687 and 23,500.
📛 Disclaimer: This is not financial advice. Trade at your own risk.

Long or short?📉 Everyone Bought the Dip… You Could’ve Sold the Top.
While most traders chased short-term bounces,
the ELFIEDT RSI + Reversion script called SHORT on the 4H — right at the peak.
🔻 Double confirmation:
1. Reversion SELL trigger
2. Bearish RSI divergence
Result? A massive unwind.
⸻
Why Swing Traders Win:
⚠️ Lower timeframes were printing BUYs inside this structure…
But smart money knows:
🧠 4H structure > 15m noise
This is the power of top-down confluence:
Trust the higher timeframe → avoid false longs → ride the move with confidence.
⸻
📍 ENTRY STRATEGY:
1. Watch 4H RSI diverge from price
2. Wait for ELFIEDT “DOWN” tag confirmation
3. Enter short on next candle break
4. SL = above signal high
5. Let the cascade unfold
This is how you avoid the trap — and catch the trend early.
⸻
💬 DM “DAX 4H SHORT” for the full system
📈 Follow for high-timeframe precision setups
🔒 No noise. No hype. Just structure + signals that deliver

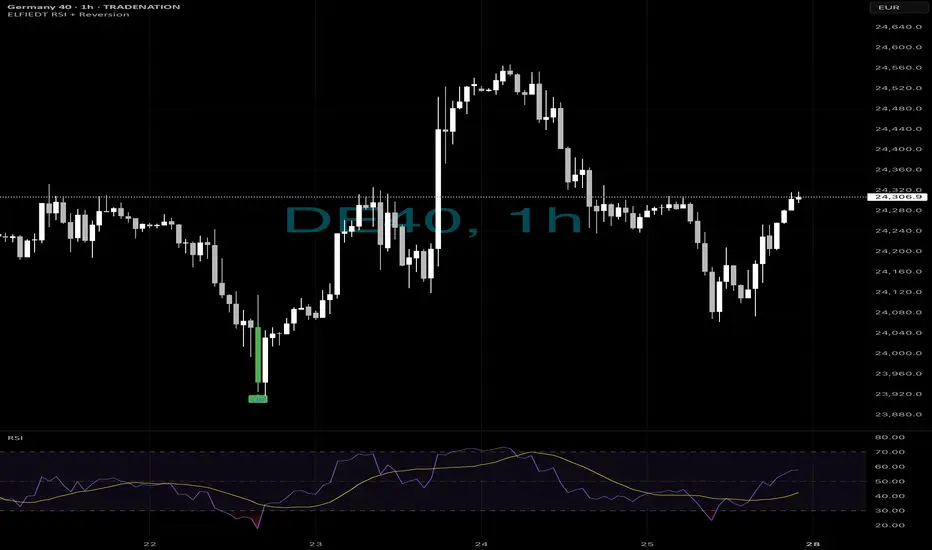
Home runs?📊 Swing Traders: This is Your Signal.
Big trades don’t need to be complicated.
You just need confluence — and a system that waits for the right moment.
Here’s the German DAX 1H chart.
👉 While others panicked, ELFIEDT RSI + Reversion waited.
At the absolute low, it fired a clean BUY — and the rally followed.
⸻
Why This Setup Works for Swing Traders:
🟢 Higher timeframe = stronger structure
🧠 RSI printed deep oversold + divergence
🎯 Reversion zone tagged cleanly
📈 Signal confirmed with “UP” — trade activated
✅ Follow-through into a multi-hour rally
⸻
You didn’t need to monitor every tick.
You just needed one clean trigger — backed by structure, RSI, and timing.
Hold it. Trail it. Scale it.
That’s the power of swing confluence.
⸻
🛠️ This isn’t a repainting indicator.
🧪 It’s been built and refined from real market structure and RSI logic.
📬 DM “DAX H1” for access
📲 Follow for high-conviction, low-stress trade setups
The edge is real. You just need to ride it.
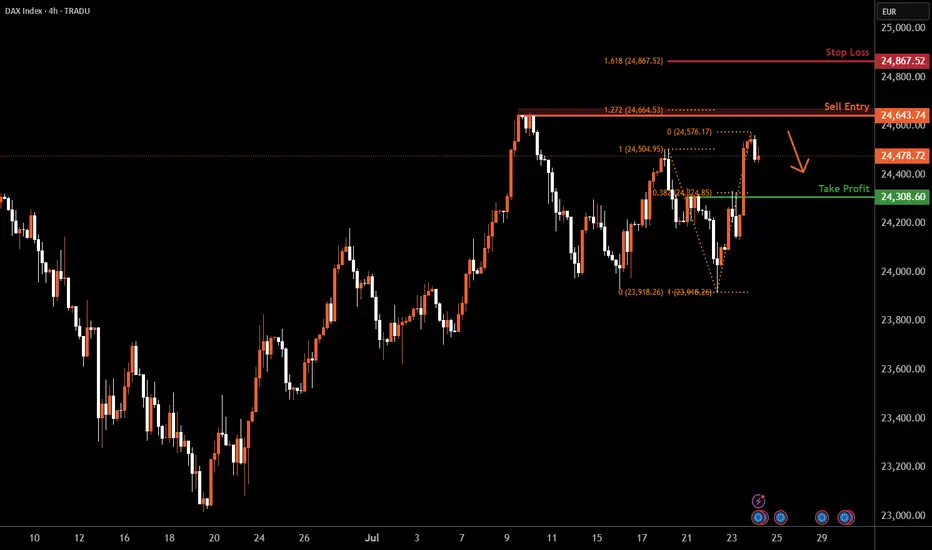
DAX H4 | Heading into a swing-high resistanceThe DAX (GER30) is rising towards a swing-high resistance and could potentially reverse off this level to drop lower.
Sell entry is at 24,643.74 which is a swing-high resistance that aligns with the 127.2% Fibonacci extension.
Stop loss is at 24,867.52 which is a level that aligns with the 161.8% Fibonacci extension.
Take profit is at 24,308.60 which is a pullbacl support that aligns with the 38.2% Fibonacci retracement.
High Risk Investment Warning
Trading Forex/CFDs on margin carries a high level of risk and may not be suitable for all investors. Leverage can work against you.
Stratos Markets Limited (tradu.com ):
CFDs are complex instruments and come with a high risk of losing money rapidly due to leverage. 66% of retail investor accounts lose money when trading CFDs with this provider. You should consider whether you understand how CFDs work and whether you can afford to take the high risk of losing your money.
Stratos Europe Ltd (tradu.com ):
CFDs are complex instruments and come with a high risk of losing money rapidly due to leverage. 66% of retail investor accounts lose money when trading CFDs with this provider. You should consider whether you understand how CFDs work and whether you can afford to take the high risk of losing your money.
Stratos Global LLC (tradu.com ):
Losses can exceed deposits.
Please be advised that the information presented on TradingView is provided to Tradu (‘Company’, ‘we’) by a third-party provider (‘TFA Global Pte Ltd’). Please be reminded that you are solely responsible for the trading decisions on your account. There is a very high degree of risk involved in trading. Any information and/or content is intended entirely for research, educational and informational purposes only and does not constitute investment or consultation advice or investment strategy. The information is not tailored to the investment needs of any specific person and therefore does not involve a consideration of any of the investment objectives, financial situation or needs of any viewer that may receive it. Kindly also note that past performance is not a reliable indicator of future results. Actual results may differ materially from those anticipated in forward-looking or past performance statements. We assume no liability as to the accuracy or completeness of any of the information and/or content provided herein and the Company cannot be held responsible for any omission, mistake nor for any loss or damage including without limitation to any loss of profit which may arise from reliance on any information supplied by TFA Global Pte Ltd.
The speaker(s) is neither an employee, agent nor representative of Tradu and is therefore acting independently. The opinions given are their own, constitute general market commentary, and do not constitute the opinion or advice of Tradu or any form of personal or investment advice. Tradu neither endorses nor guarantees offerings of third-party speakers, nor is Tradu responsible for the content, veracity or opinions of third-party speakers, presenters or participants.
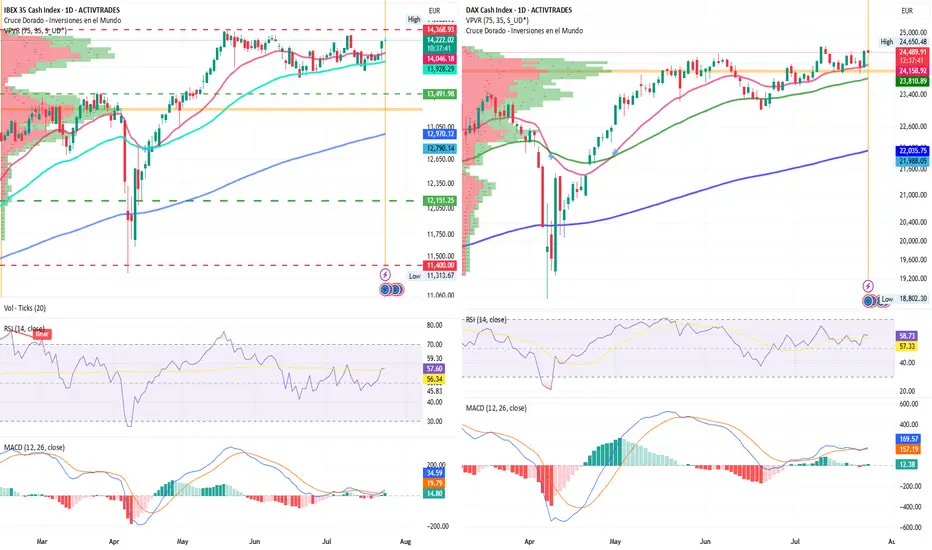
IBEX 35 Leads European Gains, DAX Enters Price Discovery ModeIBEX 35 lider of european bullish advances in the tariff agreements
By Ion Jauregui – Analyst at ActivTrades
European markets kick off the day with strong gains, driven by renewed optimism over trade negotiations between the United States and China. In this context, IBEX 35 futures surge by 1.52% to 14,273 points, positioning the index as one of the top performers in Europe. Meanwhile, Germany’s DAX 40 also rises 1.34% to 24,635 points.
News of potential tariff agreements, combined with growing expectations of a more accommodative stance from the European Central Bank (ECB), are pushing major European indices higher. The French CAC 40 climbs 1.56%, while the EuroStoxx 50 gains 1.33%, reflecting renewed risk appetite across the board.
Global Context: Asian Rebound and Moderate Commodities Euphoria
The upbeat tone isn’t limited to Europe. In Asia, major indices closed in the green, and the Australian dollar hit an eight-month high, reflecting investor optimism around global trade and corporate earnings. Oil prices are also rising, supported by a larger-than-expected drop in U.S. crude inventories and expectations of stronger global demand.
All Eyes on the ECB
Today’s highlight is the ECB meeting, where a decision on interest rates will be announced. While no major surprises are expected, investors will be watching closely for clues on the timing of future rate cuts—especially in light of recent inflation and activity data.
Additional key data scheduled for release today:
Unemployment and PPI in Spain
Composite PMIs for Germany, France, the Eurozone, and the U.S.
U.S. housing data and jobless claims
Corporate Outlook: IBEX Boosted by Strong Earnings
Several IBEX 35 companies are in the spotlight due to positive developments:
Banco Sabadell targets a 16% return on equity by 2027, supported by a €6.3 billion shareholder payout plan.
Indra nearly doubles profits, fueled by operational gains and revaluation of its stake in TESS.
ACS acquires Segade to strengthen its position in the data center sector.
Telefónica is in talks with AXA to join its fiber joint venture with Vodafone.
Santander makes a €1 billion bid for Mercedes’ leasing division.
Technical Analysis – IBEX 35: Key Zone at 14,300 Points
The IBEX 35 shows a clear structure of higher lows since the beginning of the month. Breaking above the 14,200-point level, an intermediate resistance, reinforces its short-term bullish outlook. The index is now approaching the 14,300–14,350 zone, which has acted as a ceiling since May.
This is a pivotal area; a failure to break through could form a triple top pattern, potentially triggering a correction toward support at 13,698 or even lower toward the control area near 13,491. A consolidation above 14,350, however, could set the stage for a new upward leg toward 14,500 points, provided the ECB maintains a dovish tone.
Momentum indicators support the move, although they are nearing overbought levels. RSI stands at 57.89%, while the MACD remains positive and climbing above the histogram.
Technical Analysis – DAX 40: Eyeing a Break Above 24,700
The DAX 40 is also benefiting from global bullish momentum. After consolidating above 24,300, a breakout above the 24,650 resistance could trigger a move toward the 24,700–24,800 zone, pushing the index beyond its all-time highs recorded in June.
A daily close above 24,800 would place the German index firmly in price discovery mode, with the next psychological target at 25,000 points. The RSI remains strong at 58.84%, with no immediate signs of exhaustion, while the MACD confirms the bullish signal from last week, expanding well above the histogram—though momentum appears moderate.
Conclusion
Progress in trade negotiations and expectations of a dovish ECB are setting the stage for a bullish session in European markets. The IBEX 35 leads the rally, supported by strong corporate results and technical strength, while the DAX 40 continues its upward trend, with potential for new all-time highs. Today’s ECB decision could be a turning point if it confirms the accommodative stance the market is anticipating.
*******************************************************************************************
The information provided does not constitute investment research. The material has not been prepared in accordance with the legal requirements designed to promote the independence of investment research and such should be considered a marketing communication.
All information has been prepared by ActivTrades ("AT"). The information does not contain a record of AT's prices, or an offer of or solicitation for a transaction in any financial instrument. No representation or warranty is given as to the accuracy or completeness of this information.
Any material provided does not have regard to the specific investment objective and financial situation of any person who may receive it. Past performance and forecasting are not a synonym of a reliable indicator of future performance. AT provides an execution-only service. Consequently, any person acting on the information provided does so at their own risk. Political risk is unpredictable. Central bank actions can vary. Platform tools do not guarantee success.

Ger40 buy setupSo breakout happen
Now we need a retest
I only trade with trend breakout and retest strategy
GER40 SELLGER40 SELL
SL & TP as shown
Entry on 24180,24160,24120
Adjust your SL accordingly
Could be a scalp trade according to your taste

DAX / DE30 Long Day TradeXETR:DAX / ICMARKETS:DE30 taking a pullback towards up, catching this pullback.
These are good levels if you trade nicely.
Use proper risk management
Looks like good trade.
Lets monitor.
Use proper risk management.
Disclaimer: only idea, not advice

The Kiss of Death Trade & Other Reasons for EntryFollowing up on the 2618 opportunity that we looked at on the FOREXCOM:GER40 this past weekend the market has now created more potential trading opportunities to get involved.
1) A bullish bat pattern that has completed due to a result of a complex pullback into the original double bottom.
2) A potential Kiss of Death trading opportunity
3) A bigger potential bullish gartley pattern IF the current 2618 opportunity is violated.
Please leave any questions or comments below & feel free to share your opinion on the setup.
Akil

Before GER40 Roars, It WhispersHey guys👋
Here’s the latest GER40 analysis I’ve prepared for you:
🔻 If the **24,179** support level breaks, the next target is **23,972**.
🔺 If the **24,373** resistance level breaks, the next target is **24,511**.
🎯 I’ve shared two key levels with you — please monitor them carefully.
Every like from you gives me a big boost of motivation 🙏
Thanks to everyone who supports my work — truly appreciate it 💙

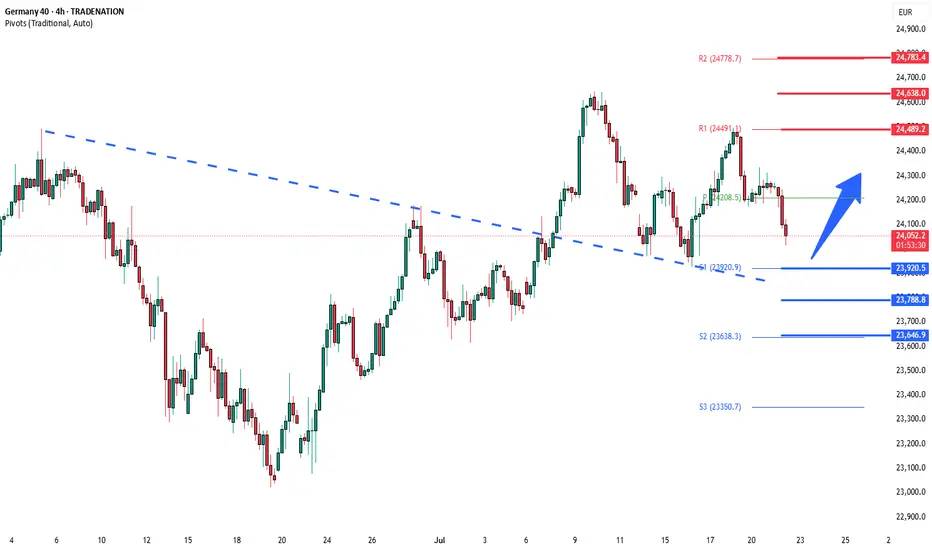
DowJones corrective pullback supported at 23920Key Support and Resistance Levels
Resistance Level 1: 24490
Resistance Level 2: 24640
Resistance Level 3: 24780
Support Level 1: 23920
Support Level 2: 23790
Support Level 3: 23646
This communication is for informational purposes only and should not be viewed as any form of recommendation as to a particular course of action or as investment advice. It is not intended as an offer or solicitation for the purchase or sale of any financial instrument or as an official confirmation of any transaction. Opinions, estimates and assumptions expressed herein are made as of the date of this communication and are subject to change without notice. This communication has been prepared based upon information, including market prices, data and other information, believed to be reliable; however, Trade Nation does not warrant its completeness or accuracy. All market prices and market data contained in or attached to this communication are indicative and subject to change without notice.