7/21/25 ((NAS100)) analysisPrice is definitely going up
may come down to quickly tap the daily FVG first
perhaps in the beginning of the week
---Monday/Tuesday style but not married to that Idea
could also come back to hit that volume weekly line thing
I just decided to implement lol who knows
anyways I plan to be in BUYS all week long BABYYY
NAS100 trade ideas

NASDAQ Short OpportunityPrice formed a distribution schematic 1 and currently forming the LPSY at OTE Level

Risk off The cycle low is due 10/10 -20th The Bullish wave count is that we are ending wave 1 of 5 in super cycle blowoff wave 2 would drop in a ABC decline and drop back to .382 alt 50% of the whole rally from 4835 low . This is the bull wave count ! The bearish wave count is that we are ending the final 5th wave up from 2020 low march 23th see my work calling for a panic into 3/18/3/20 2020 the low was 3/23 20 into perfect math at 2191 as was the call for 3510 to 3490 low and the 4835 low all are in near perfect math . My worry for this oct 10 to the 20th Is I see a 1987 like decline taking out the 4835 in a wave E CRASH . Under all three counts I moved to a 110 % short. best of trades WAVETIMER

US consumer sentiment improved in Jun could boost US indices The US July Michigan Consumer Sentiment Index increased to 61.8 from 60.7, while the 12-month inflation expectation decreased to 3.6% from 4% in the previous month. This suggests an easing of inflation concerns and improved consumption optimism.
This data, coupled with recent stronger Retail Sales figures, continues to support expectations for robust US economic growth amidst trade tariff uncertainties. Inflation is anticipated to have a limited short-term impact. Concurrently, the approval for AMD and Nvidia (NVDA) to export AI chips to China further bolsters the US tech sector.
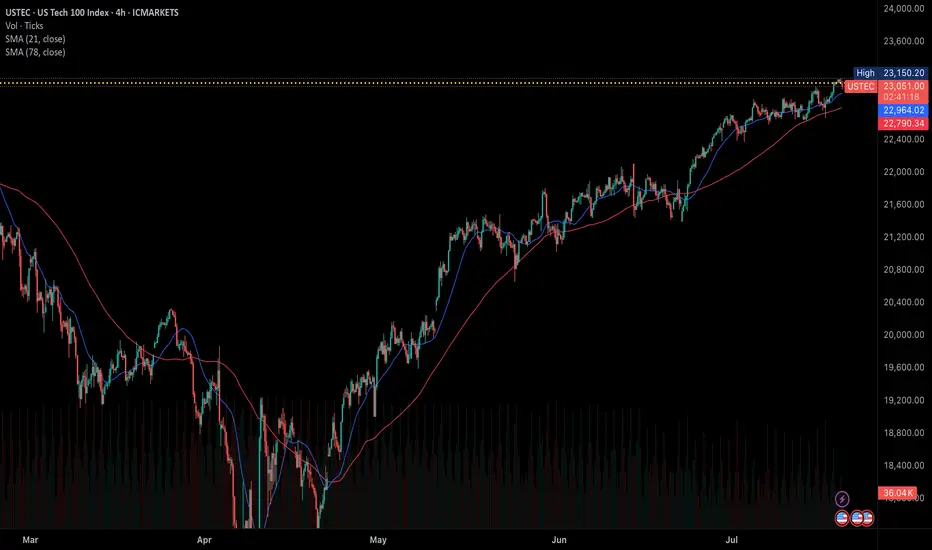
The USTEC is currently in an upward trend, having reached a new high before a slight retreat. It is trading above both the EMA21 and EMA78, indicating higher highs and higher lows, suggesting the rally could persist.
Should the USTEC continue its surge, the index may test the resistance level at 23,200. Conversely, a failure to maintain above the trendline could trigger a decline towards the next support at 22,600.
By Van Ha Trinh - Financial Market Strategist from Exness
NAS100 (CASH100) SHORT - head and shoulders 30minRisk/reward = 3.9
Entry price = 23 137.9
Stop loss price = 23 153.9
Take profit level 1 (50%) = 23 071
Take profit level 2 (50%) = 23 060
Still need to validate a few variables.
Lets goooooo
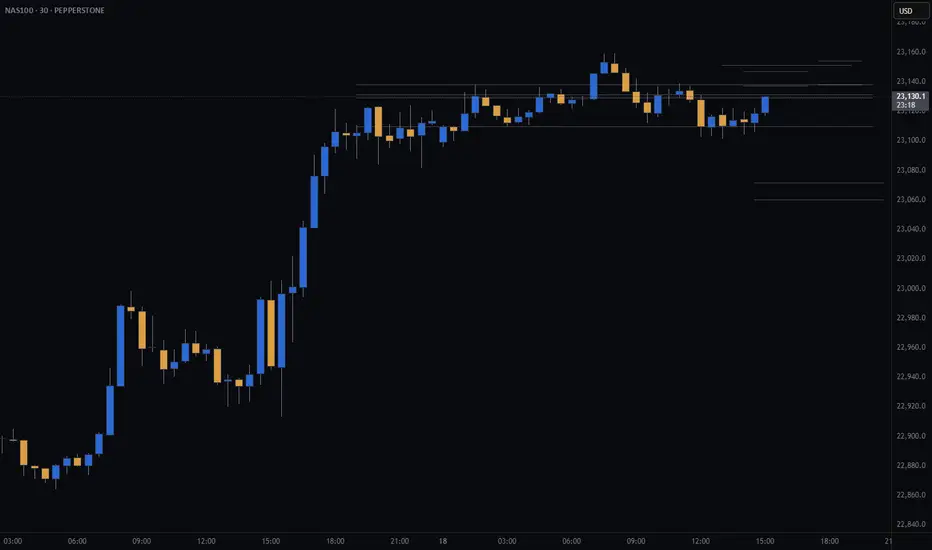
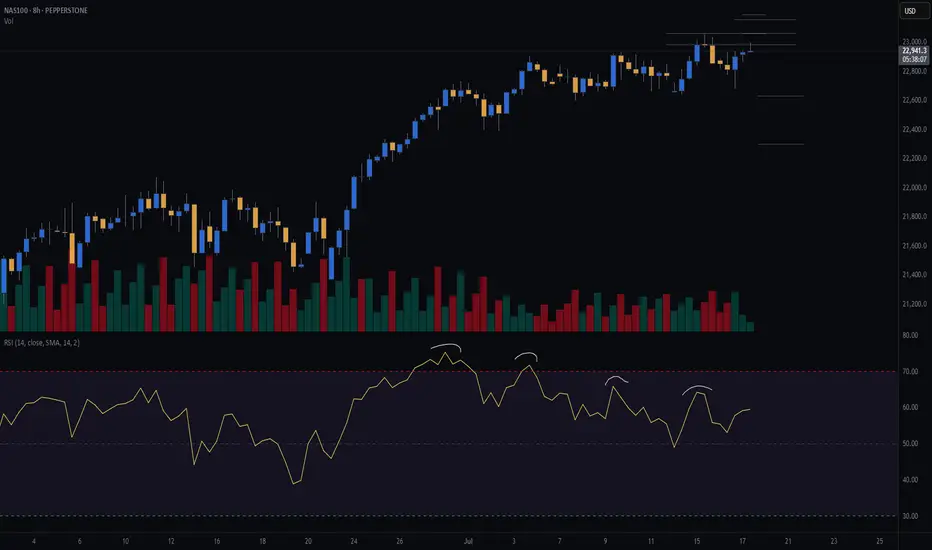
Weekly Close High to HOLD?As expected Nas100 will end in a weekly high after hitting a nice fresh record due to TSMI stock among other things like Trump walking back on firing Jermone Powell.
Technicals tell me that this is extremely overbought and I wonder if this will continue I cannot believe this rally. AS LONG as it holds the 23100 to 23150 range then it could break out again and set another high but I would be cautiously optimistic. Somebody's got to take the profit!
SellRejection Level
Daily Volume
Market Structure Shift
London US Session
Trend Line Break
Untapped Order Point
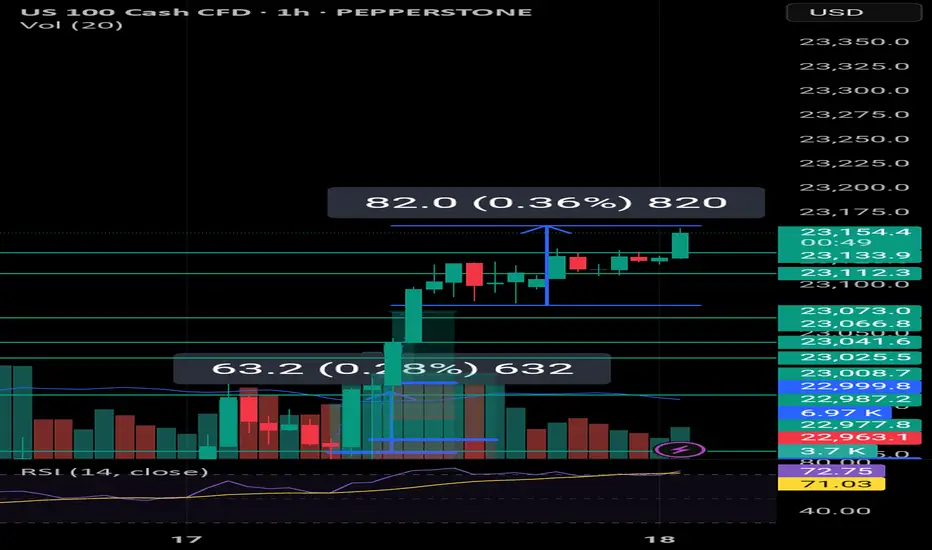
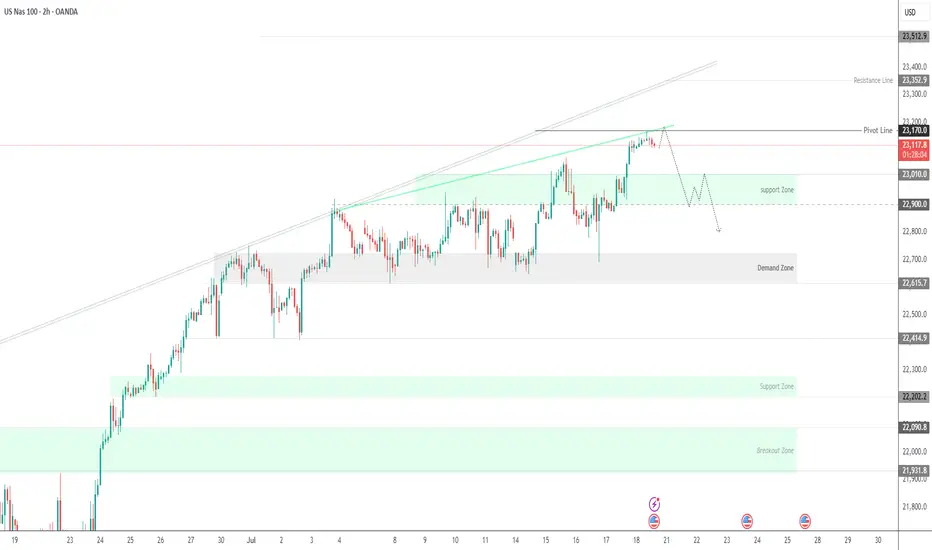
NASDAQ100 Hits Target at 23170 – Watch for Breakout or PullbackNASDAQ100 Tests ATH – Key Decision Zone at 23170
New ATH Achieved:
NASDAQ100 recorded a new All-Time High (ATH), hitting our target at 23170 precisely as projected.
Currently, price is consolidating below 23170. Sustained rejection at this level could trigger a short-term bearish pullback toward 23010. A deeper correction may extend to 22900 or even 22815.
However, a clean breakout above 23170 would confirm bullish continuation, with the next target at 23350.
Key Levels
• Pivot: 23170
• Resistance: 23250 / 23350
• Support: 23010 / 22900 / 22815
Outlook:
• Bullish above 23170
• Bearish below 23170 (short-term pullback zone)

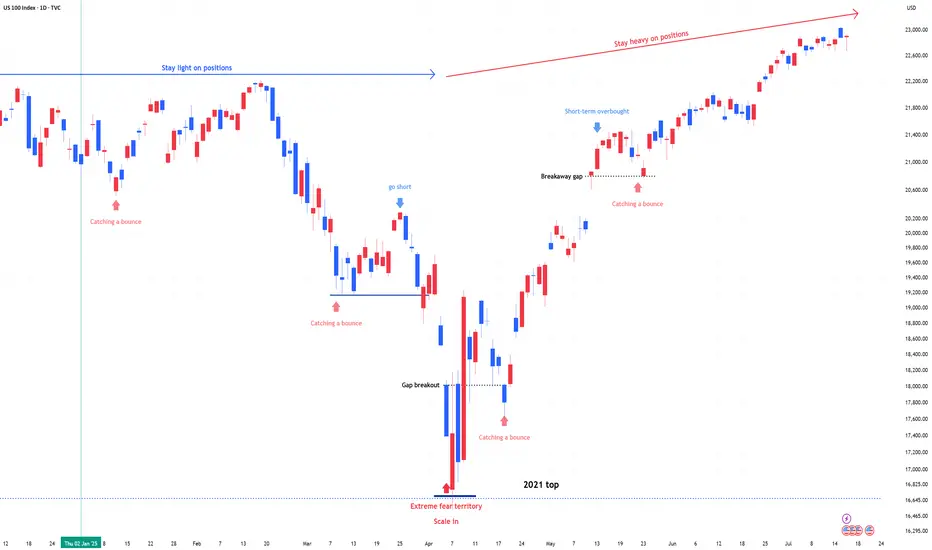
US 100 (NDQ) : Stay Heavy on Positions1) April Fear & Buy Signals
In early April, the Nasdaq 100 experienced a sharp sell-off, triggering extreme fear sentiment across the market.
At that point, scale-in buy signals appeared—classic "buy the fear" conditions.
2) Current Market State: No More Fear, but Watching
Since then, the market has stabilized.
The fear has disappeared, but we are still in a wait-and-see mode as traders assess the next move.
Momentum is holding, but participation remains cautious.
3) Stay Heavy on Positions
Despite short-term uncertainty, I’m maintaining an overweight position on the Nasdaq 100.
As long as we don’t see a major breakdown, the bias remains bullish.
NAS100 (CASH100) SHORT - Double Top H8Risk/reward = 4.6
Entry price = 23 063
Stop loss price = 23 190
Take profit level 1 (50%) = 22 635
Take profit level 2 (50%) = 22 303
Still waiting for confirmation on some variables.
For example, need H8 candle to close in range and volume to validate, amongst other variables.
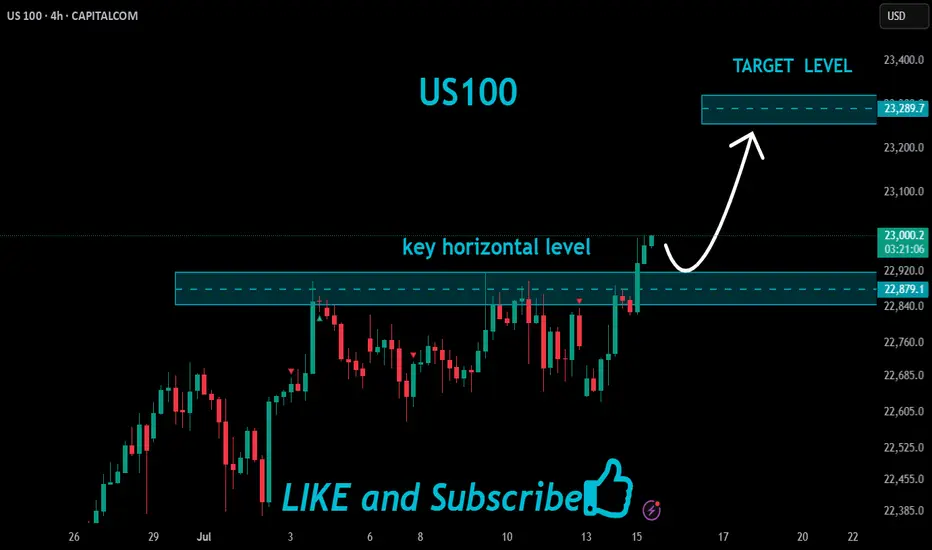
US100 Strong Bullish Breakout!
HI,Traders !
#US100 is trading in a
Strong uptrend and the
made a bullish breakout
Of the key horizontal level
Of 22879.1 so we are
Bullish biased and we will
Be expecting a further
Bullish move up !
Comment and subscribe to help us grow !
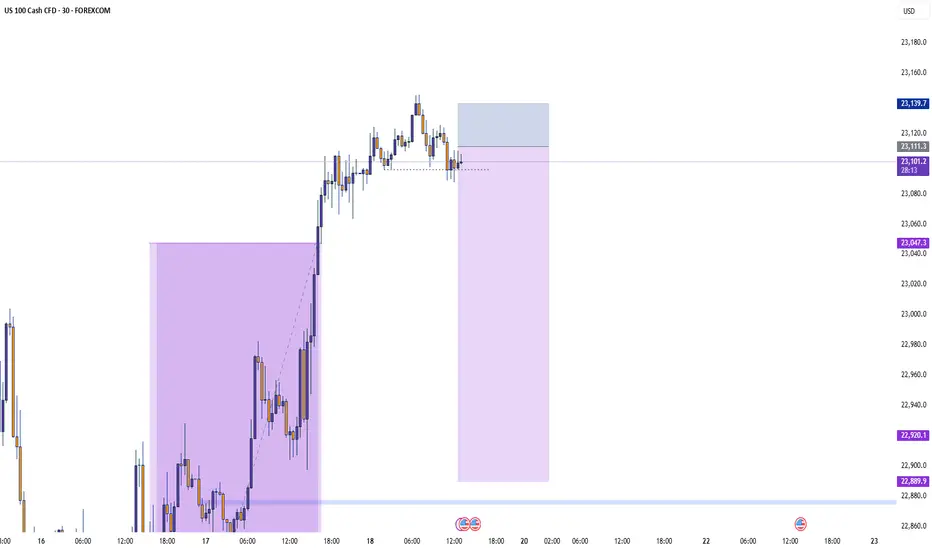
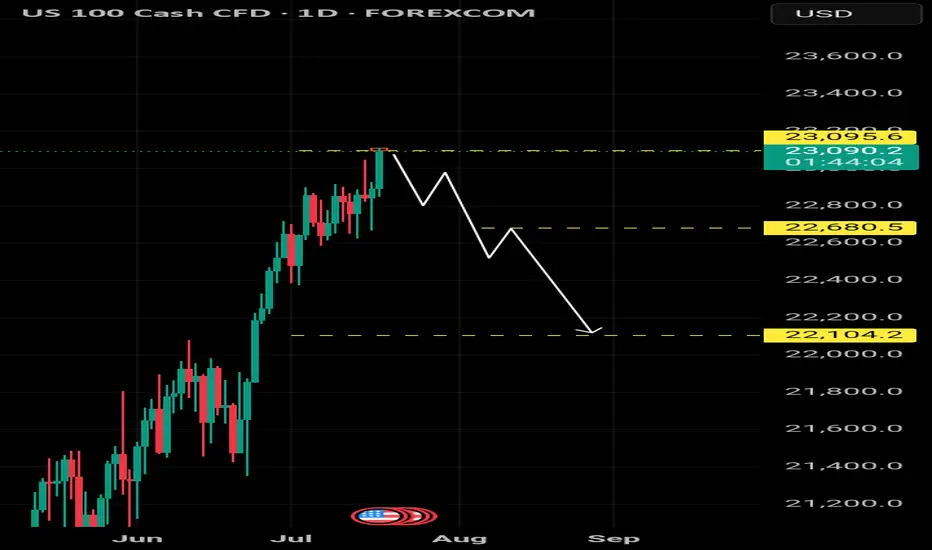
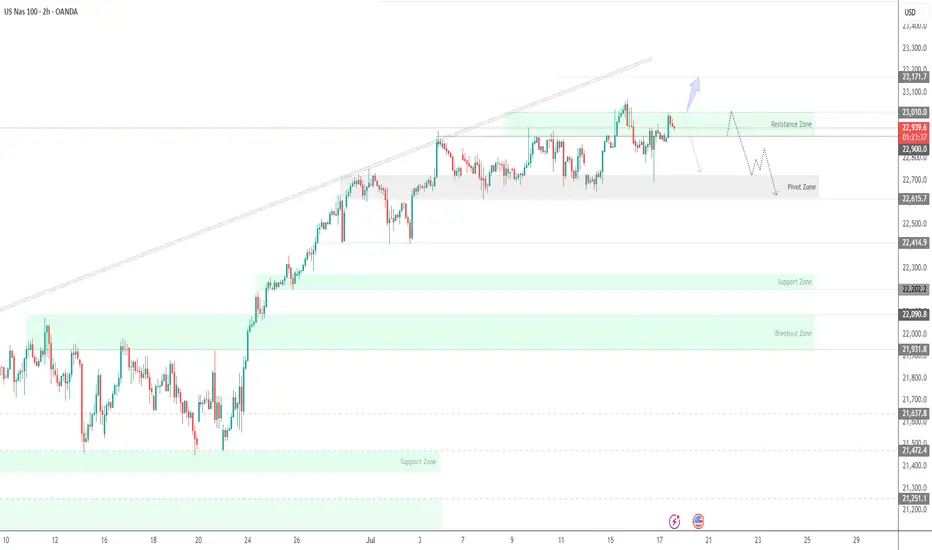
NASDAQ Outlook – Coming WeeksIn the coming weeks, we may see a potential downward move in the NASDAQ, provided that it fails to hold above the current level at 23,100.
If the index remains unstable below this level, a sharp decline toward the 22,800 zone is likely.
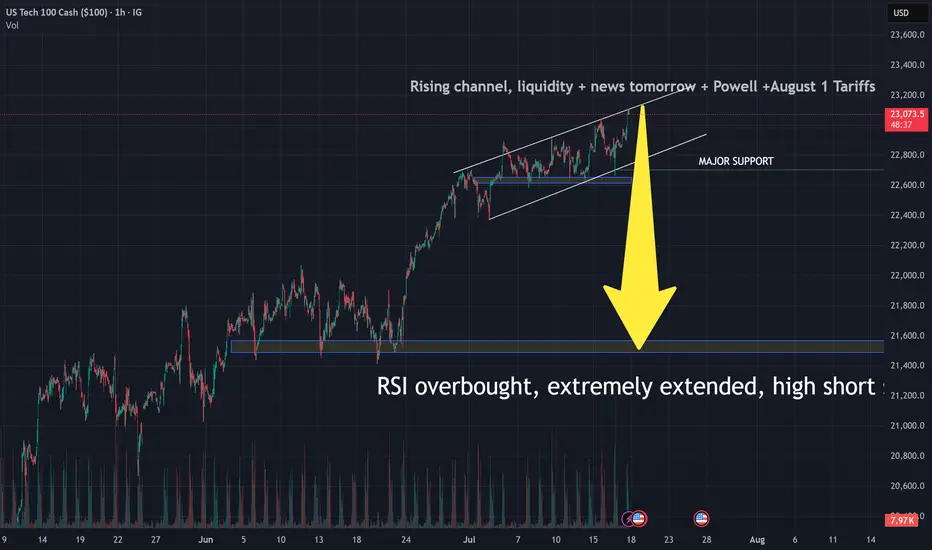
NASDAQ will fall to 21500 until August 1Nearly all Indicators, Geopolitics, uncertainties, Trade Tariffs, Powell vs Trump- tell us to sell, marking a bearish perception on Stock Market. Although your right analysis to sell is still bougt by super fast algorithms, there are facts that neither investors nor programms can ignore, and they are about to come. If housing market stambles tomorrow, which, probably, will be the fact, it will be the first step towards this deep dive. Wish us all profitable trading. Remember, it is not about being right or wrong, it is about making money, so even if you are wrong-dont compete with your own money against you, stay focused falks. See ya.
[LONG] NASDAQ still very bullishFundamentals for bias.
Technicals for entry.
Daily support at 22,600
Target ATH at 23,050
Im buying more @ 22,730
higher high higher low higher high higher low = bullish.
NAS100Short-Term Outlook for NAS100 (as of mid-July 2025):
Recent Trend:
• The NAS100 has been in a strong bullish trend throughout much of 2025, driven by:
• Big tech earnings growth (e.g., Apple, Nvidia, Microsoft, Meta).
• AI and chip sector boom.
• Fed’s pause (or even rate cuts) in interest rates.

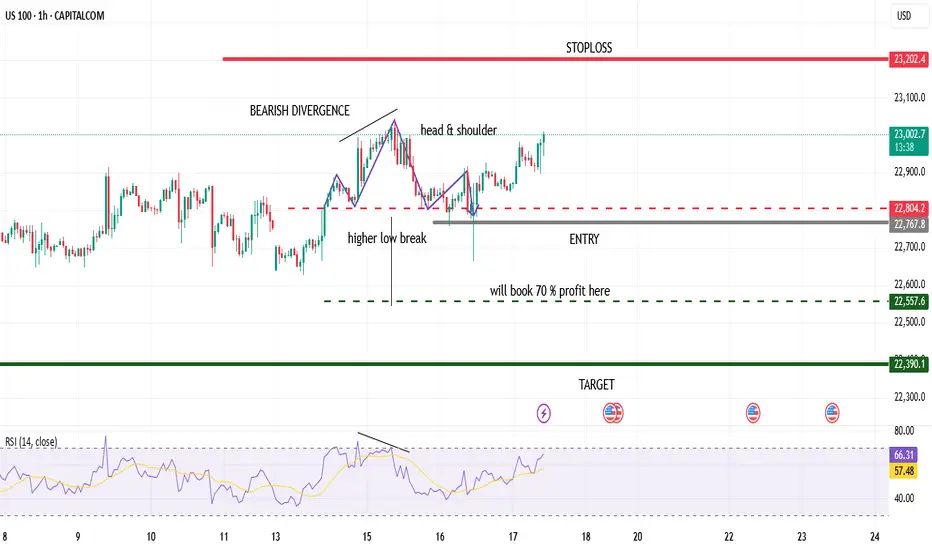
US 100 ShortUS 100 short
1st us100 formed bearish divergence
then break last higher low
also formed bearish head & shoulder
DXY index is bullish it also indicates for bearish stock
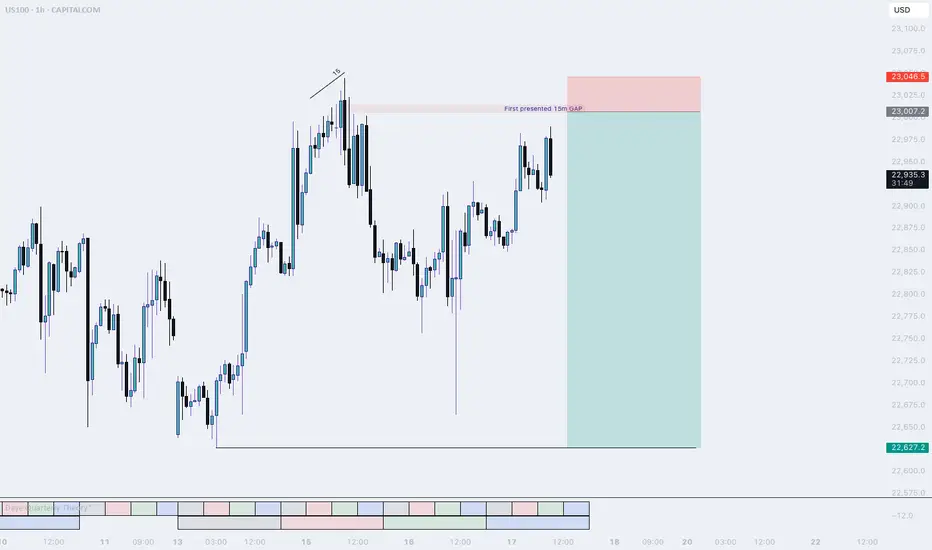
NQ, Short setupJust before market Open price dropped lower, I expect price to travel back up into the 15 m Gap and then sell off. This is the only setup I am interested in today.
The 15m level will be a resistance level for price. This level is derived from the last reversal. Since NQ was lagging, i expect price to use his level to squeeze the shorts out and start a new down trend.
If this does not happen and the highs get taken out, I will be flat today
Goodluck, Good trading.
F
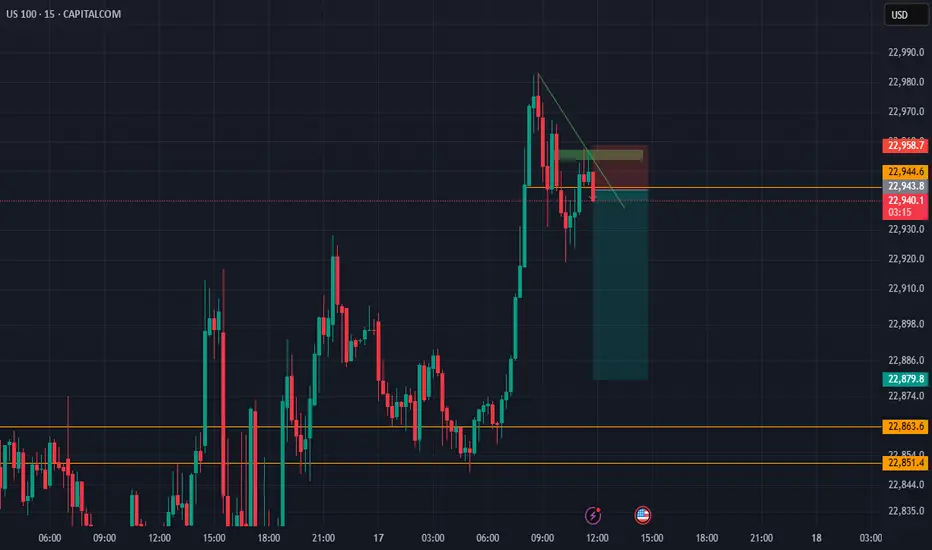
NASDAQ ShortLooking forward to this Setup dropping back down to attent to low of the day as the New york session approaches, Looking to take profit before 15:00 Central African Time
USNAS100 | Consolidation 23010 - 22900, Bearish or Not Yet...USNAS100: Cautious Consolidation as Powell Uncertainty Lingers
Following political noise around Fed Chair Powell — with Trump admitting he floated the idea of replacing him — tech markets have entered a cautious consolidation. While no immediate action was taken, the underlying uncertainty continues to weigh on sentiment, especially in rate-sensitive sectors like tech.
Technically: Consolidation Before the Break
The price is currently consolidating between 22900 and 23010.
A confirmed 1H close below 22900 would signal the start of a bearish trend, targeting 22700 and 22615.
Conversely, a close above 23010 would open the path toward a new all-time high (ATH) at 23170.
Key Levels:
Support: 22700, 22615
Resistance: 23010, 23170
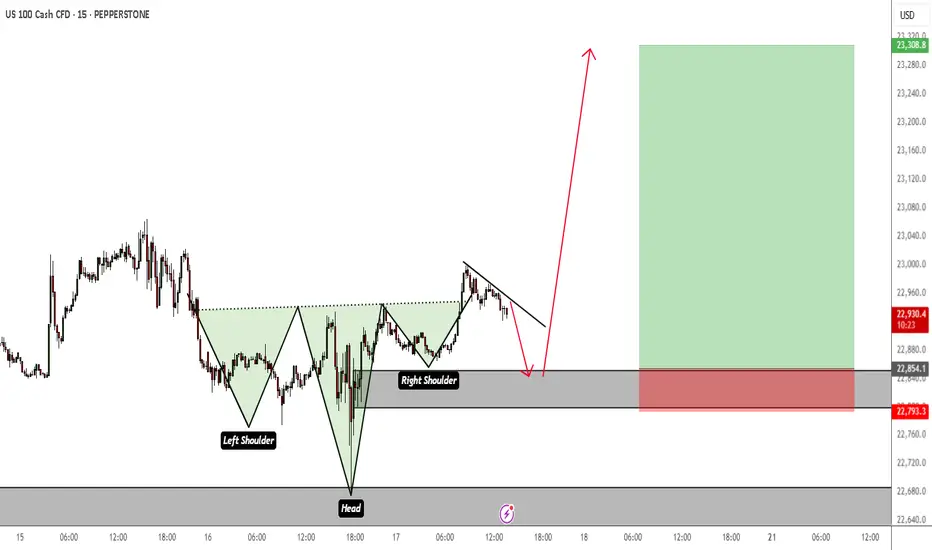
NASDAQ Inverted Head & Shoulders Retest Before Bullish MomentumI see a possible retest of an Inverted Head and Shoulders on M15 TF before the bullish momentum resumes. The SL and TP are just a rough estimation. Price could dip a bit lower than that.
But my overall bias is bullish.
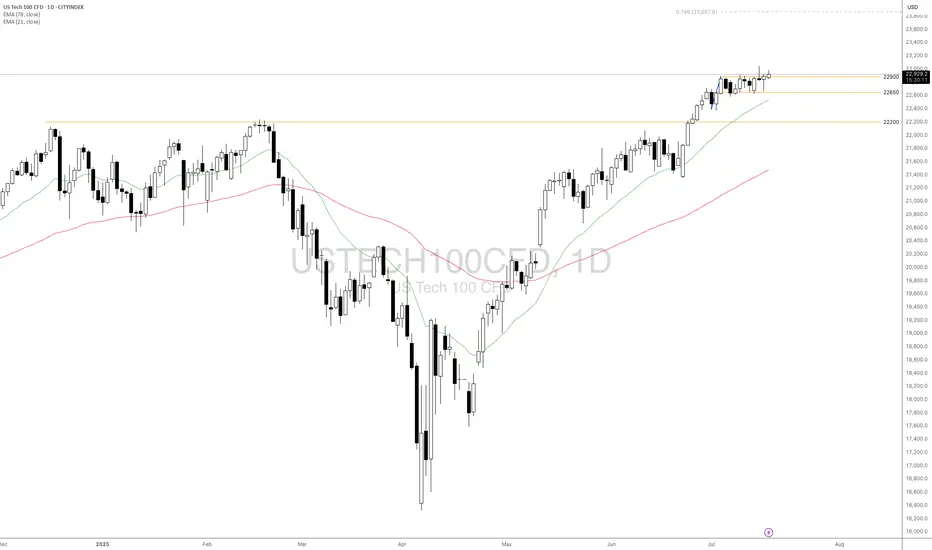
Will USTEC Continue to Climb Amid Key Catalysts Ahead?Fundamental approach:
- USTEC climbed to fresh record highs this week, supported by positive investor sentiment amid consolidation ahead of key catalysts.
- Sentiment was buoyed by expectations of continued AI and semiconductor strength, with Nvidia (NVDA) and Amazon (AMZN) registering gains, while Tesla (TSLA) rebounded on optimism despite recent volatility. However, persistent tariff threats and uncertainty around US trade policy generated caution, with markets jittery as investors eyed incoming earnings reports and inflation data releases for further direction. The term structure in tech remains constructive, with buyers stepping in on minor pullbacks, showing little sign of trend exhaustion.
- USTEC may face heightened volatility as the next round of corporate results and updates on US tariffs could shift sentiment. Upcoming earnings from major tech firms and macroeconomic releases, including key inflation and consumer confidence data, could set the tone for the index's next move.
Technical approach:
- USTEC closed above the range of 22650-22900, and also above both EMAs, indicating a strong upward momentum.
- If USTEC maintains above 22900, it may continue to rise to 78.6% Fibonacci Extension at around 23870.
- On the contrary, closing below 22900 may push the price to retest the previous support at 22650.
Analysis by: Dat Tong, Senior Financial Markets Strategist at Exness
NASDAQ 100: AI Momentum and Resilient Earnings Drive New HighsThe NASDAQ 100 continues its strong uptrend 📈, recently breaking to new highs after a period of consolidation. The rally is broad-based but remains led by heavyweight tech names and AI-related stocks 🤖.
Key Fundamental Drivers:
AI & Tech Growth 🤖💡: The biggest catalyst is the ongoing boom in artificial intelligence and digital transformation. Companies in the index, especially the “Magnificent Seven” (like NVIDIA, Microsoft, Apple), are seeing robust earnings growth and strong investor demand for AI exposure. Global IT spending is projected to grow by over 9% in 2025, with AI spending up nearly 30% year-on-year.
Earnings Resilience 💪💰: Despite high interest rates and inflation, tech companies have adapted well, maintaining strong margins and growth. The sector is expected to remain a top performer through 2025.
Fed Policy & Rate Expectations 🏦🔮: Markets are increasingly pricing in a pause or even cuts in US interest rates later in 2025, which is bullish for growth stocks and tech-heavy indices like the NASDAQ 100.
Geopolitical & Macro Factors:
Reduced Uncertainty 🌏🕊️: The market has absorbed major geopolitical shocks (such as the Israel-Iran conflict and US-China trade tensions), and the resolution or de-escalation of these risks has reduced uncertainty, supporting risk assets.
US Election & Policy 🇺🇸🗳️: The outcome of the US election and expectations for stable or pro-business policies have also contributed to positive sentiment.
Global Supply Chains & Resilience 🌐🔗: While some risks remain (e.g., cyber threats, regulatory changes, and supply chain disruptions), the tech sector’s global reach and adaptability have helped it weather these challenges.
Why is it rallying now?
AI optimism and strong tech earnings are the main drivers 🤖💹.
Expectations of easier Fed policy and a resilient US economy are fueling risk appetite 🏦📈.
Geopolitical risks have eased or are being priced in, allowing investors to focus on growth 🌍🕊️.
Summary:
The NASDAQ 100’s rally is powered by AI-driven tech growth 🤖, resilient earnings 💪, and easing macro/geopolitical risks 🌏. The index remains a global leader as investors bet on the next wave of technology and digital innovation 🚀.
