Bulls Steady Ahead of Key Earnings and Economic DataU.S. equities are holding steady in what has been a week of conflicting signals. President Trump’s aggressive stance on trade, including potential 30% tariffs on EU and Mexican goods, has shaken market sentiment, but his public commitment to retain Jerome Powell as Fed Chair brought some temporary relief. That stability, at least for now, is helping underpin stock indices.
Focus has now turned to corporate earnings, with key players like TSMC and Netflix reporting shortly. These names could set the tone for the broader Q2 earnings season. At the same time, traders are closely monitoring incoming U.S. data — including retail sales and jobless claims — to gauge the health of the consumer and labor market. The combination of strong earnings and resilient macro data could provide the momentum
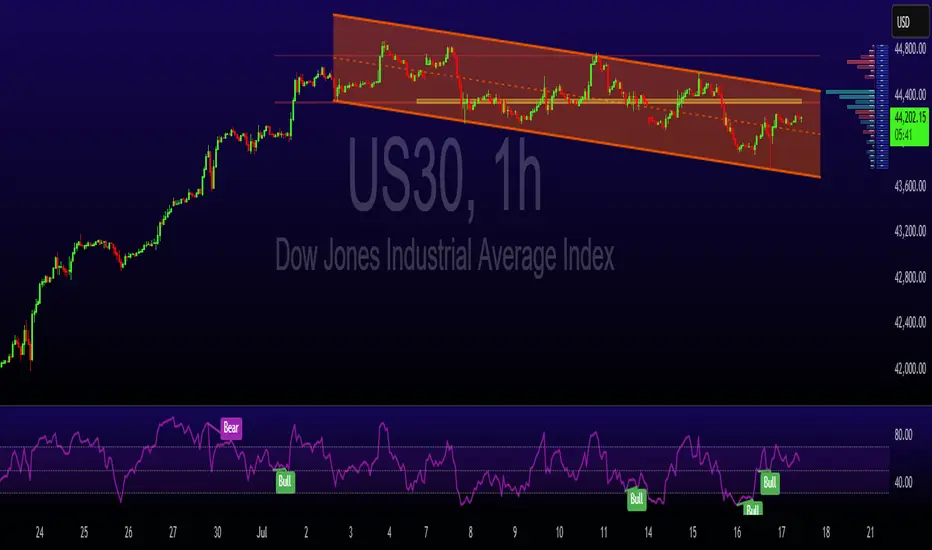
Technical Structure:
• Resistance: 44,350 — a potential breakout point
• Support: 44,000 and 43,800
• Pattern: The index is trading within a descending channel, but recent strength suggests a breakout may be developing.
• Upside potential: If earnings and macro data support risk appetite, a breakout toward 44,800 becomes plausible.
Takeaway: Sentiment remains fragile but stable. Traders should keep a close eye on both corporate results and macro data releases for direction cues.
US30 trade ideas
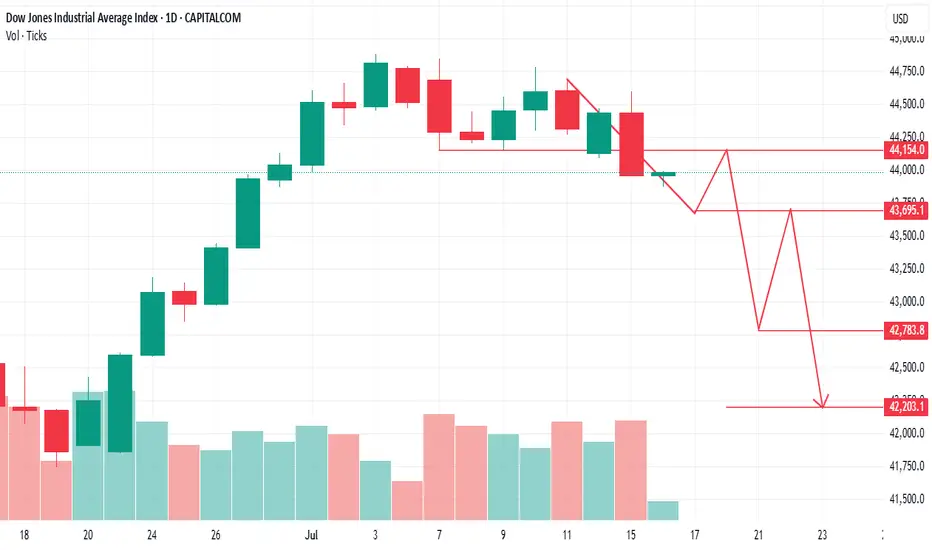
The trend has decreasedAt the moment, the trend has decreased, it will probably fall to the bottom of the pivot daily, and then it will rise and continue to fall to the bottom of the pivot for the first week
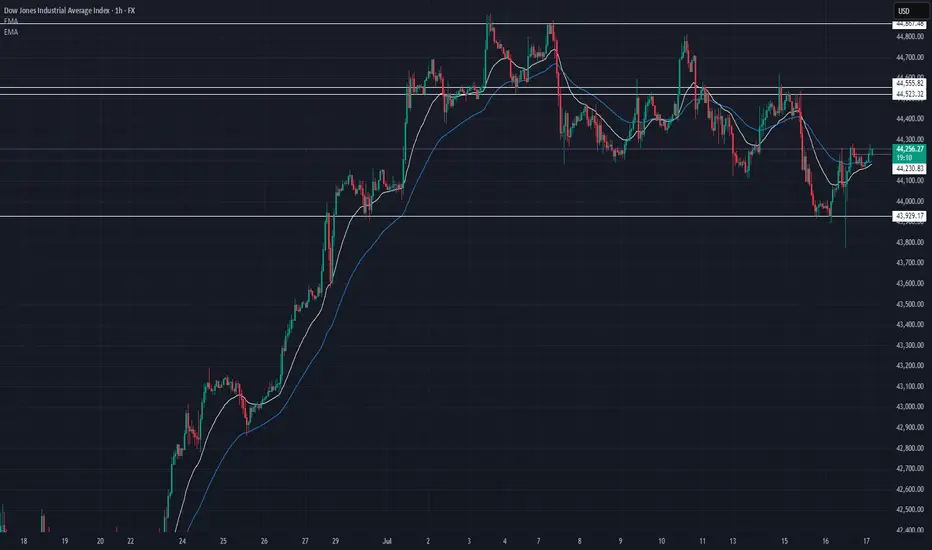
DOW JONES 1H ANALYSIS – JULY 17, 2025📉 DOW JONES 1H ANALYSIS – JULY 17, 2025
🔎 Tracking structure | key levels | trade ideas
🔹 Current Price: 44,248
📆 Timeframe: 1H
📈 Bias: Neutral → Short-term bullish ✅
📌 MARKET STRUCTURE UPDATE:
Price held strong at 43,929 – key support from earlier July lows 🔁
After a deep pullback from 44,800s, we’re seeing a bounce with price reclaiming the 21 & 50 EMA 🧠
This signals short-term buyer momentum stepping in – but caution: we’re still trading below key resistance 👀
🔹 KEY LEVELS TO WATCH:
Support:
🟢 43,929 → major bounce zone (held)
🟢 44,182 → short-term EMA support
Resistance:
🔴 44,523 → former support, now flipped resistance
🔴 44,555 → breakdown origin
🔴 44,857 → major supply zone top
💡 TRADE SCENARIOS:
🔼 Bullish Case:
If price holds above 44,200 and pushes through 44,523–44,555, we likely see 44,700+ retest 🔥
A breakout + hold above 44,555 = trend shift confirmed 📈
🔽 Bearish Case:
If rejection at 44,523/555 holds, watch for rotation back to 44,000 → 43,929
Below 43,929 = possible slide to 43,700–43,600 demand 🚨
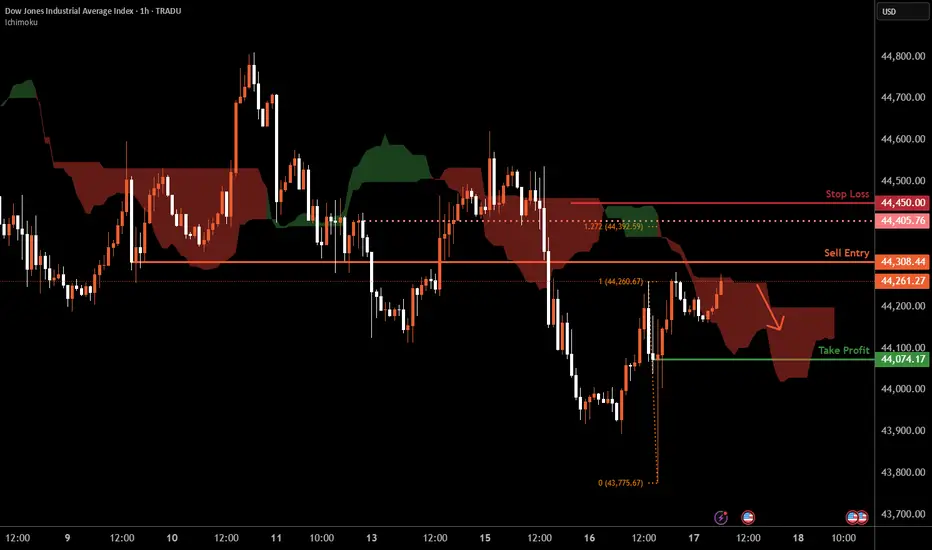
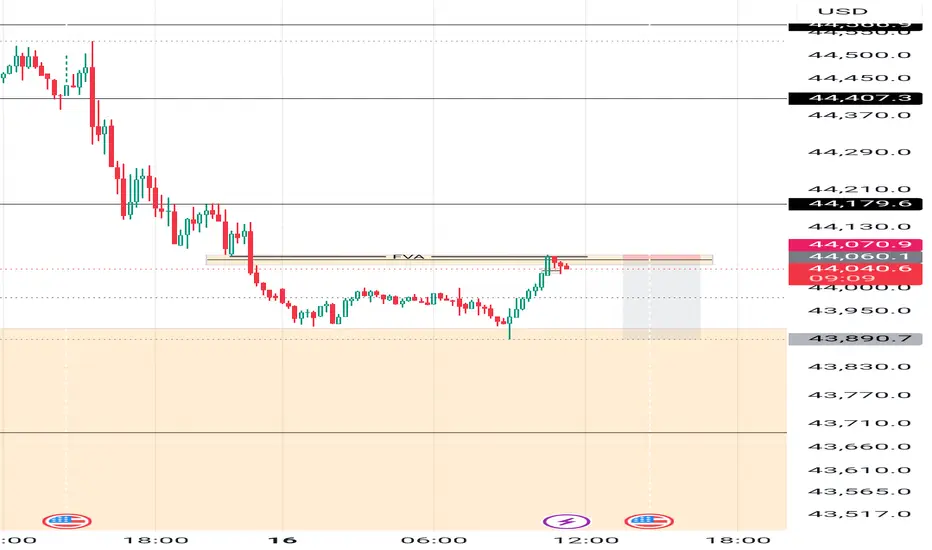
Dow Jones H1 | Approaching a pullback resistanceThe Dow Jones (US30) is rising towards a pullback resistance and could potentially reverse off this level to drop lower.
Sell entry is at 44,308.44 which is a pullback resistance.
Stop loss is at 44,450.00 which is a level that sits above an overlap resistance and the 127.2% Fibonacci extension.
Take profit is at 44,074.17 which is a swing-low support.
High Risk Investment Warning
Trading Forex/CFDs on margin carries a high level of risk and may not be suitable for all investors. Leverage can work against you.
Stratos Markets Limited (tradu.com ):
CFDs are complex instruments and come with a high risk of losing money rapidly due to leverage. 66% of retail investor accounts lose money when trading CFDs with this provider. You should consider whether you understand how CFDs work and whether you can afford to take the high risk of losing your money.
Stratos Europe Ltd (tradu.com ):
CFDs are complex instruments and come with a high risk of losing money rapidly due to leverage. 66% of retail investor accounts lose money when trading CFDs with this provider. You should consider whether you understand how CFDs work and whether you can afford to take the high risk of losing your money.
Stratos Global LLC (tradu.com ):
Losses can exceed deposits.
Please be advised that the information presented on TradingView is provided to Tradu (‘Company’, ‘we’) by a third-party provider (‘TFA Global Pte Ltd’). Please be reminded that you are solely responsible for the trading decisions on your account. There is a very high degree of risk involved in trading. Any information and/or content is intended entirely for research, educational and informational purposes only and does not constitute investment or consultation advice or investment strategy. The information is not tailored to the investment needs of any specific person and therefore does not involve a consideration of any of the investment objectives, financial situation or needs of any viewer that may receive it. Kindly also note that past performance is not a reliable indicator of future results. Actual results may differ materially from those anticipated in forward-looking or past performance statements. We assume no liability as to the accuracy or completeness of any of the information and/or content provided herein and the Company cannot be held responsible for any omission, mistake nor for any loss or damage including without limitation to any loss of profit which may arise from reliance on any information supplied by TFA Global Pte Ltd.
The speaker(s) is neither an employee, agent nor representative of Tradu and is therefore acting independently. The opinions given are their own, constitute general market commentary, and do not constitute the opinion or advice of Tradu or any form of personal or investment advice. Tradu neither endorses nor guarantees offerings of third-party speakers, nor is Tradu responsible for the content, veracity or opinions of third-party speakers, presenters or participants.
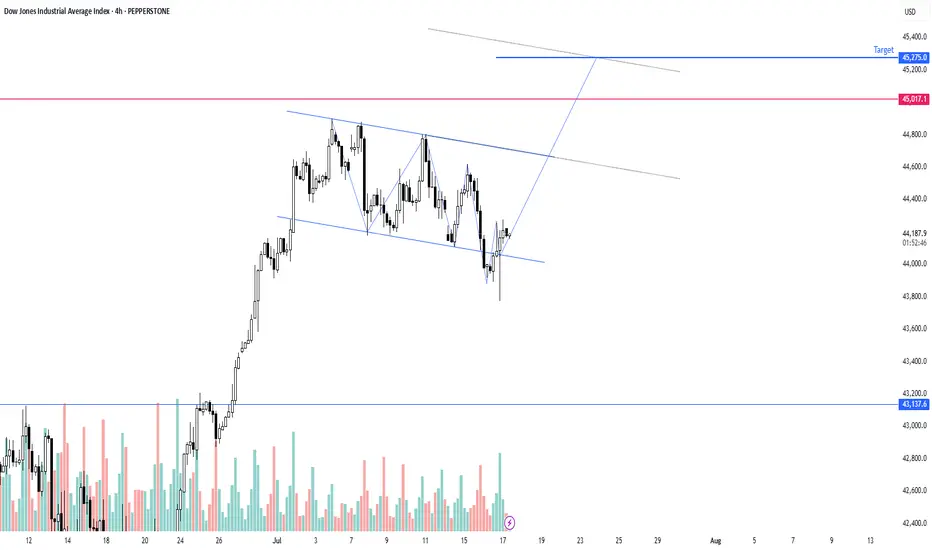
US30 in the US stock market will also set a new highUS30 in the US stock market will also set a new high
He is a little slower but will reach the goal
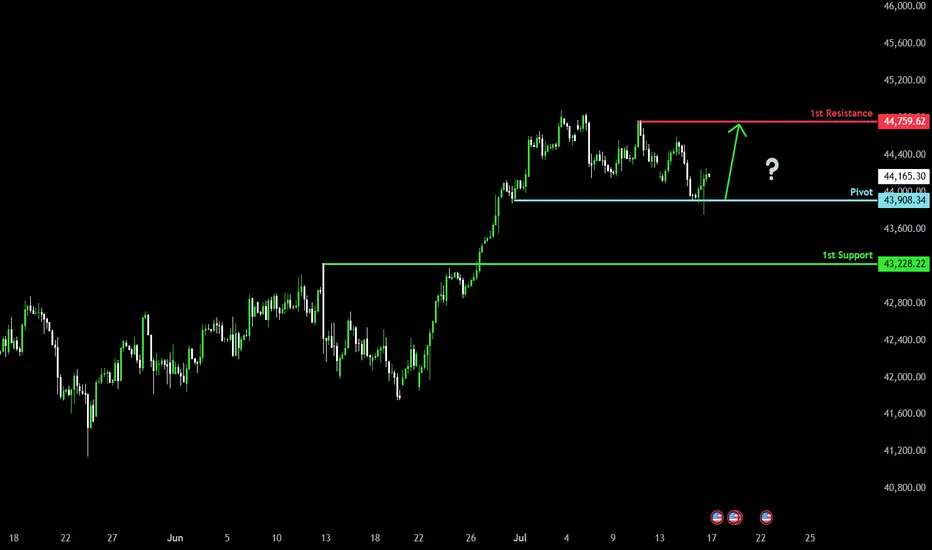
Could the price rise from here?Dow Jones (US30) has bounced off the pivot and could potentially rise to the 1st resistance which acts as a pullback resistance.
Pivot: 43,908.34
1st Support: 43,228.22
1st Resistance: 44,759.62
Risk Warning:
Trading Forex and CFDs carries a high level of risk to your capital and you should only trade with money you can afford to lose. Trading Forex and CFDs may not be suitable for all investors, so please ensure that you fully understand the risks involved and seek independent advice if necessary.
Disclaimer:
The above opinions given constitute general market commentary, and do not constitute the opinion or advice of IC Markets or any form of personal or investment advice.
Any opinions, news, research, analyses, prices, other information, or links to third-party sites contained on this website are provided on an "as-is" basis, are intended only to be informative, is not an advice nor a recommendation, nor research, or a record of our trading prices, or an offer of, or solicitation for a transaction in any financial instrument and thus should not be treated as such. The information provided does not involve any specific investment objectives, financial situation and needs of any specific person who may receive it. Please be aware, that past performance is not a reliable indicator of future performance and/or results. Past Performance or Forward-looking scenarios based upon the reasonable beliefs of the third-party provider are not a guarantee of future performance. Actual results may differ materially from those anticipated in forward-looking or past performance statements. IC Markets makes no representation or warranty and assumes no liability as to the accuracy or completeness of the information provided, nor any loss arising from any investment based on a recommendation, forecast or any information supplied by any third-party.
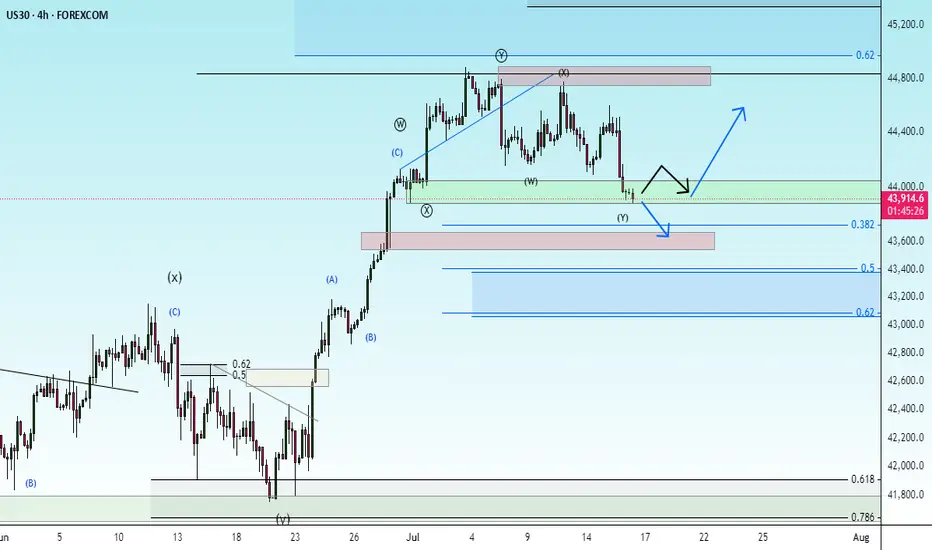
US30 DOW BULLISH ANALYSIS Triple tops are the next liquidity targets from a fvg support as shown. the tops are week as we have seen NASDAQ and S&P500 hav3 liquidated their highs its. Lear US30 is following the same path.
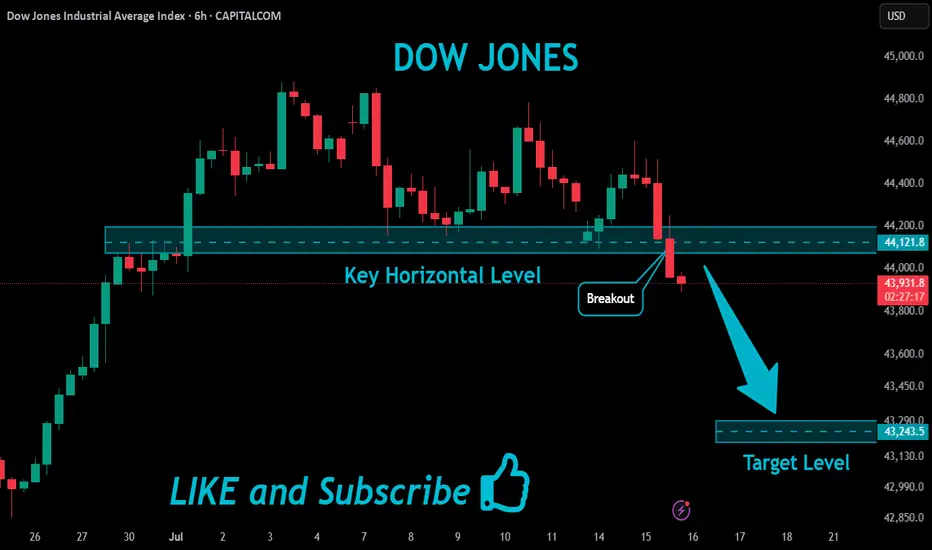
US30 Bearish Breakout!
HI,Traders !
#US30 index is trading in a strong downtrend,
and has broken through the key horizontal
level at 44121.8, reinforcing our bearish
outlook. We expect further declines !
Comment and subscribe to help us grow !
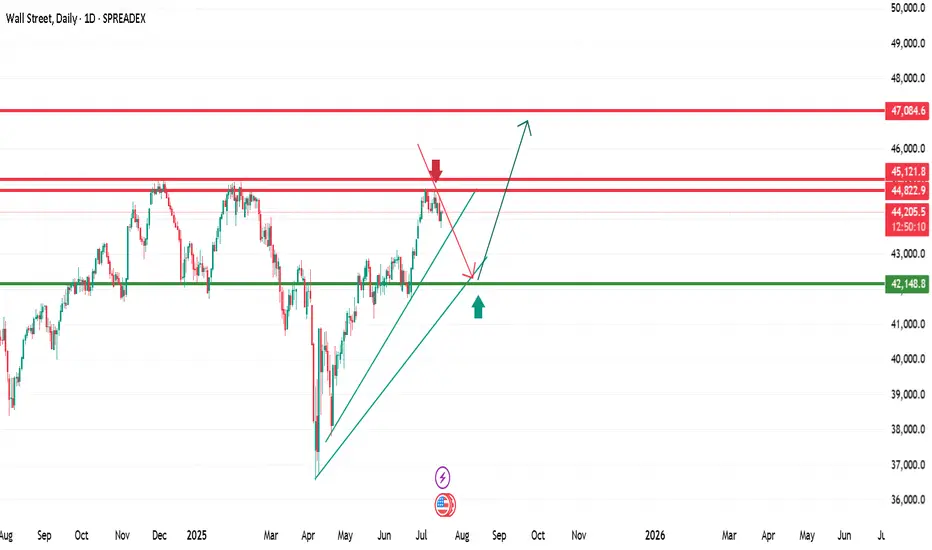
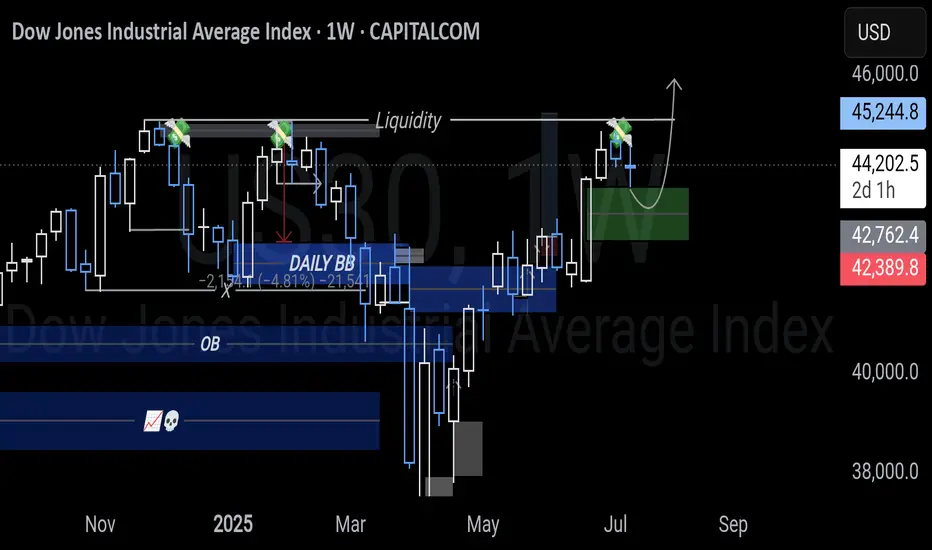
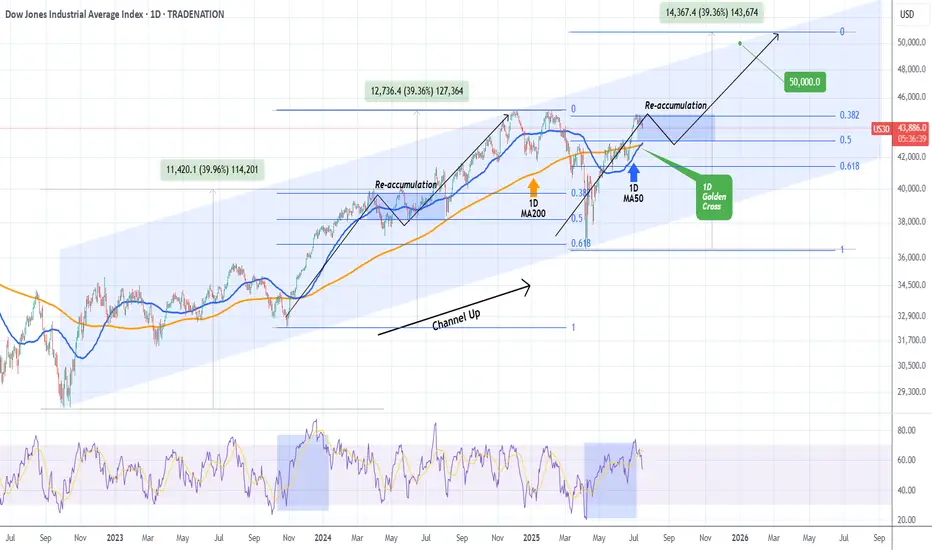
DOW JONES formed 1st 1D Golden Cross since 2022!Dow Jones (DJIA) completed on Monday its 1st Golden Cross on the 1D time-frame since December 12 2022! This powerful bullish pattern comes with the price close to its All Time High (ATH).
Being inside almost a 3-year Channel Up, the current rise is the pattern's latest Bullish Leg following the April 07 2025 bottom (Higher Low). Both previous Bullish Legs rose by +39.96% before forming a Higher High.
Based on the Fibonacci retracement levels, last time the previous Bullish Leg was within the 0.382 - 0.5 Fibonacci Zone, it formed a Re-accumulation Phase for 3 months. As a result, we shouldn't dismiss the fact of trading sideways for the rest of the Summer and then picking up the pace. Our end-of-year Target remains 50000.
-------------------------------------------------------------------------------
** Please LIKE 👍, FOLLOW ✅, SHARE 🙌 and COMMENT ✍ if you enjoy this idea! Also share your ideas and charts in the comments section below! This is best way to keep it relevant, support us, keep the content here free and allow the idea to reach as many people as possible. **
-------------------------------------------------------------------------------
Disclosure: I am part of Trade Nation's Influencer program and receive a monthly fee for using their TradingView charts in my analysis.
💸💸💸💸💸💸
👇 👇 👇 👇 👇 👇
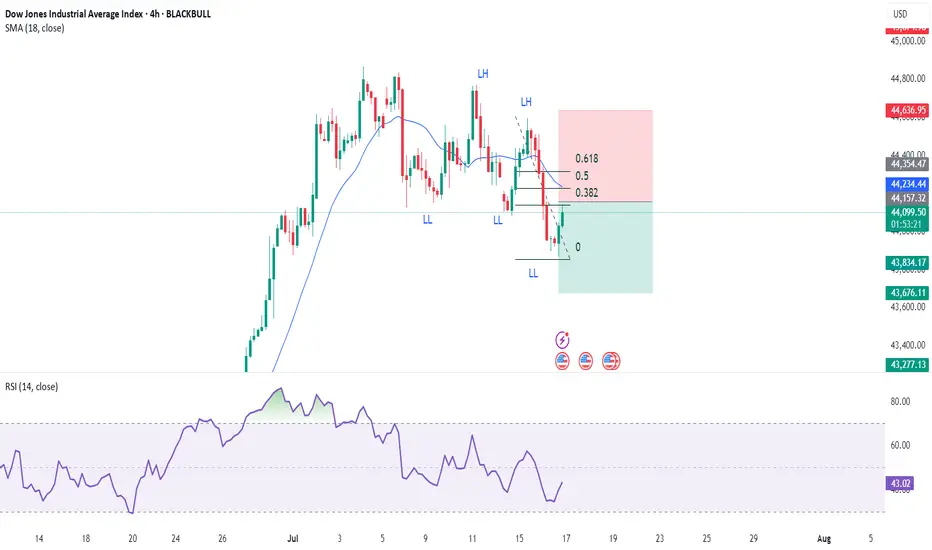
Dow Short IdeaDow jones has started making LL's so it is effectively in a downward trend on 4Hr chart so shorting on pullback to key Fib Retracement levels would be a good idea.
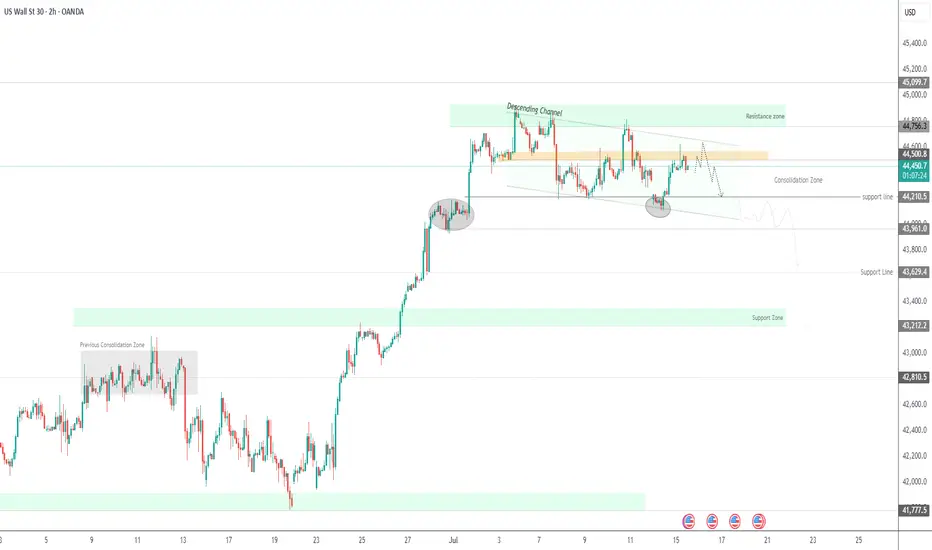
US30 – Bearish Outlook Below 44,500 as CPI Looms US30 – Bearish Outlook Below 44,500 as CPI Looms
US30 rallied and successfully reached our resistance target, as expected in the previous analysis.
However, with today’s CPI release, the market is likely to see increased volatility. As long as the index trades below 44,500–44,570, the bias remains bearish, with downside targets at 44,210 and 43,960.
• If CPI prints below 2.6%, we may see a bullish breakout toward 45,100
• Above or equal to 2.6% supports continuation of the bearish move
However, we expect a 2.7% reading, driven by tariff-related price increases, which would support the bearish scenario.
us30 to break down us30 to break down
bears to take control - as shown in zigzag manne
swing low broken
volumes drying up
stoploss will be swing high
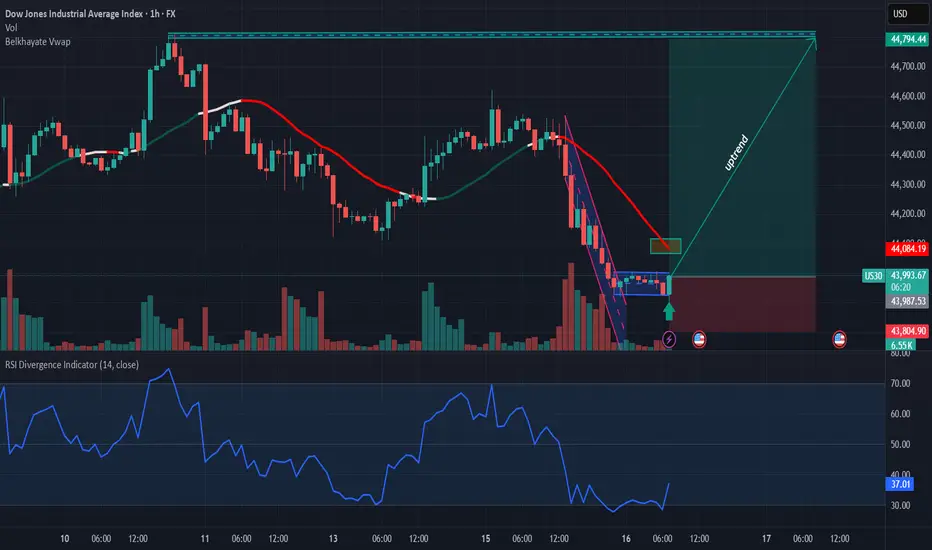
US30: Buy ideaOn US30 as you can see on the chart we would have a hight probability to have an uptrend.
check the trendGiven the behavior of the index in the current support area, possible scenarios have been identified.
If the index breaks through the support area, a continuation of the downward trend will be likely.
US30 Update – 07/16/2025📍 US30 Update – 07/16/2025
The bearish momentum continues — and it's clean.
After rejecting 44,555–44,600 supply last week, US30 has been in a clear downtrend, and now we’ve broken below 44,000, tapping into the 43,900 zone. Sellers are dominating, and buyers haven’t shown strength on any retrace yet. ⚠️
📊 Market Structure:
✅ Lower highs, lower lows locked in
🧭 Rejected 44.6k supply on lower volume = bearish intent
📉 Price now below EMAs (20 & 50), which are sloping down hard
📉 Current price printing near multi-week support
🔑 Key Levels:
🔽 Support: 43,800 → 43,600 → 43,300
🔼 Resistance: 44,100 → 44,220 → 44,555
💣 Break of 43,800 = high probability for further downside flush
💡 Trade Ideas:
🔻 Short Setup – Trend Continuation:
Entry: Pullback into 44,100–44,200
Confirmation: Bearish rejection candle
TP1: 43,800
TP2: 43,600
SL: Above 44,300
⚠️ No long bias unless bulls reclaim 44,400 with conviction.

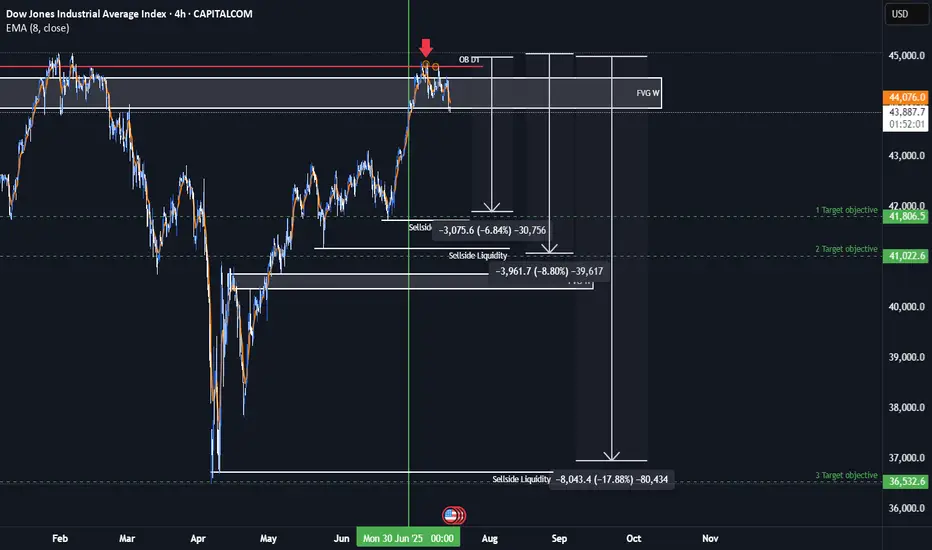
US30 Bearish IdeaAs we can see this is a anticipation of us being in a quarterly shift in the markets and having an assumption that we had a retracement up to collect more orders for smart money to go short. We have relative strength with US30 against both NASDAQ and the SP500. We have seen resistance in our premium arrays of our weekly FVG and daily order block
* Fundamental analysis:
We are are having a shift in our bond yields which could potentially effect the dollar giving it strength and you add the fact that dollar is under valued when we have a stronger dollar rate than the rest of the basket currencies we could see it negatively effect the Dow this quarter. The Dow is very over valued and we have had consistent quantitative easing from the Fed and the Fed balance sheet has been still consistently decreasing. The commercial interest have also seen a great rise of buying dollar and if dollar is being bought up then something would need to be sold.
Dow Jones Industrial Average Index - 4 Hour Chart4-hour chart of the Dow Jones Industrial Average (US30) shows a recent price movement as of July 13, 2025. The index is currently at 44,315.0, reflecting a decline of 285.5 points (-0.64%). The chart highlights a sell signal at 44,312.0 and a buy signal at 44,318.0, with a shaded area indicating a potential downward trend from a recent peak. Key price levels include 44,855.7 (high) and 43,902.2 (low), with a support level around 44,315.0.
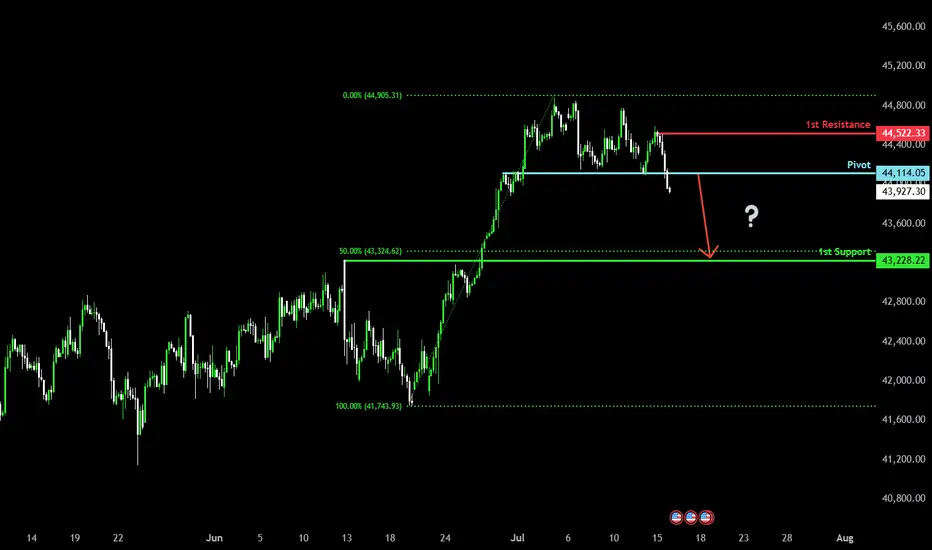
Bearish drop?Dow Jones (US30) has reacted off the pivot and could drop to the 1st support which has been identified as a pullback support.
Pivot: 44,114.05
1st Support: 43,228.22
1st Resistance: 44,522.33
Risk Warning:
Trading Forex and CFDs carries a high level of risk to your capital and you should only trade with money you can afford to lose. Trading Forex and CFDs may not be suitable for all investors, so please ensure that you fully understand the risks involved and seek independent advice if necessary.
Disclaimer:
The above opinions given constitute general market commentary, and do not constitute the opinion or advice of IC Markets or any form of personal or investment advice.
Any opinions, news, research, analyses, prices, other information, or links to third-party sites contained on this website are provided on an "as-is" basis, are intended only to be informative, is not an advice nor a recommendation, nor research, or a record of our trading prices, or an offer of, or solicitation for a transaction in any financial instrument and thus should not be treated as such. The information provided does not involve any specific investment objectives, financial situation and needs of any specific person who may receive it. Please be aware, that past performance is not a reliable indicator of future performance and/or results. Past Performance or Forward-looking scenarios based upon the reasonable beliefs of the third-party provider are not a guarantee of future performance. Actual results may differ materially from those anticipated in forward-looking or past performance statements. IC Markets makes no representation or warranty and assumes no liability as to the accuracy or completeness of the information provided, nor any loss arising from any investment based on a recommendation, forecast or any information supplied by any third-party.
US30 Price close below Bullish reversal Then drop to 43,800The US30 is currently in a consolidation phase after a strong bullish rally, but is now showing signs of weakness. The index is facing resistance near 44,700, and as long as the price remains below this level, the bearish correction is expected to continue.
If the price fails to break above 44,700 and closes below this resistance, we could see a push toward the support zones at 44,004 and 43,800. A bullish reversal may only be considered if the price successfully holds above 44,700 on a strong candle close.
For now, bearish bias remains intact unless a confirmed breakout occurs above key resistance.
Ps Support with like and comments for more better analysis share with you Thanks for Supporting.

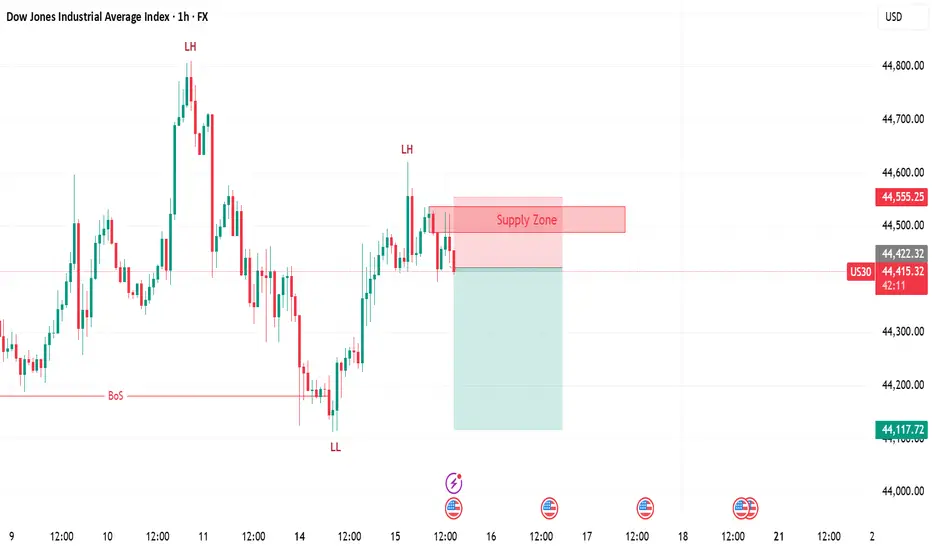
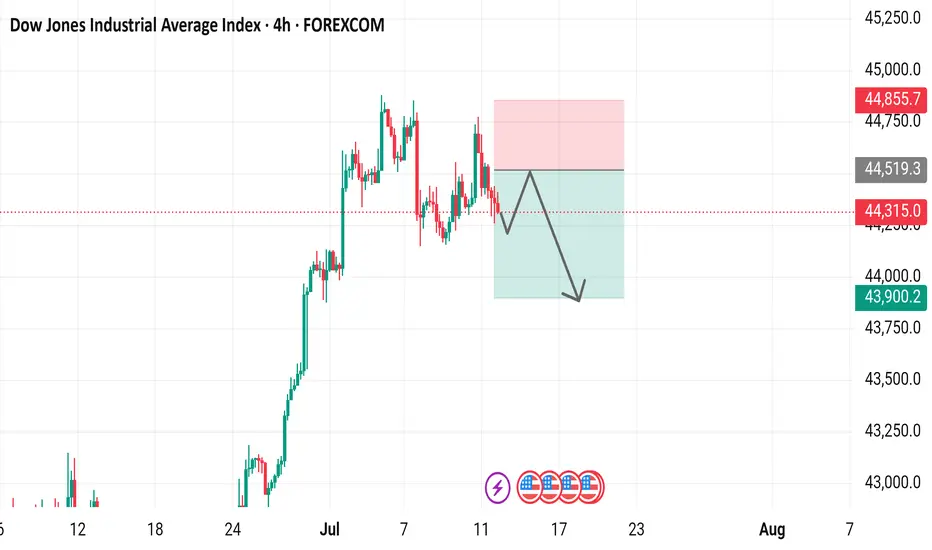
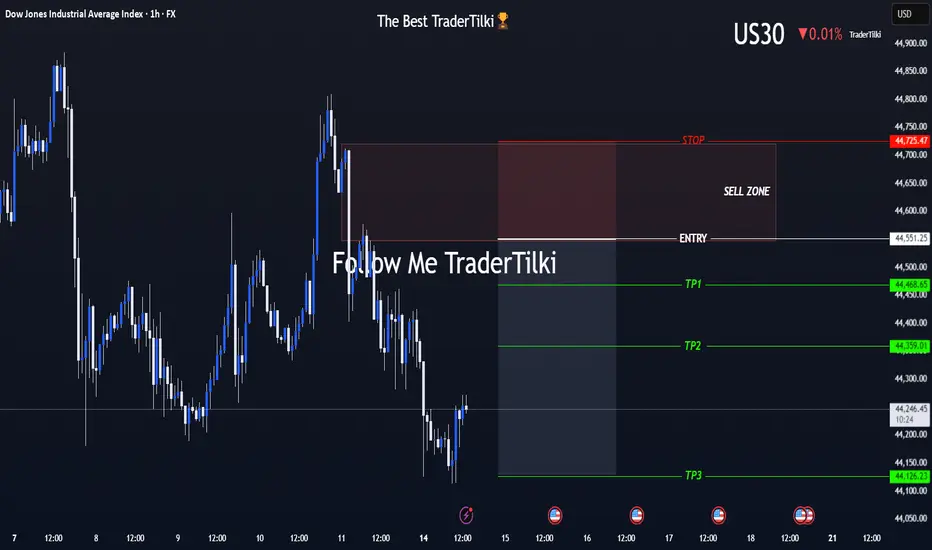
US30 (Dow Jones) Is On My Radar — The Moment’s Getting Close!Hey Guys,
I've marked my sell zone on the Dow Jones (US30) chart.
Once price reaches my entry range, I’ll be jumping into this high-probability trade setup.
🚪 Entry Levels: 44,551 – 44,632 – 44,677
🛑 Stop Loss: 44,725
🎯 Targets:
• TP1: 44,468
• TP2: 44,359
• TP3: 44,126
📐 Risk-to-Reward Ratio: Approximately 2.41 from the 44,551 entry
Your likes and support are what keep me motivated to share these analyses consistently.
Huge thanks to everyone who shows love and appreciation! 🙏
US30 | SELLConfirmation from 15 minute timeframe.
General trend in 1H is downward.
Trading with impulse.